


The rising concern about global food security and climate change has led to an increased interest in sustainable and healthy diets(1– Reference McMichael, Powles and Butler 4 ). Typically, food drives 20–30 % of the life-cycle environmental impacts of final household consumption( Reference Tukker, Goldbohm and Koning 5 ). To reduce the current burden of food consumption on the environment, food consumption patterns need to change( Reference Garnett 6 , Reference Macdiarmid, Kyle and Horgan 7 ).
The FAO defines sustainable diets as ‘diets protective and respectful of biodiversity and ecosystems, culturally acceptable, accessible, economically fair and affordable; nutritionally adequate, safe and healthy; while optimizing natural and human resources’( 8 ). Accordingly, the FAO recommends giving due consideration to sustainability when developing food-based dietary guidelines and policies, acknowledging the need for studies demonstrating the synergies between the different dimensions of sustainability( 8 ). The Health Council of the Netherlands, in addition, considers it as important to evaluate synergies between environmental load and health and to identify targets for interventions to lower the environmental load of diets( 9 ).
Ecological or environmental indicators are used to evaluate the impact of human activity on ecosystems. The environmental pressure indicator, greenhouse gas emission (GHGE), has been applied in most previous research papers and can be considered a good proxy for this total environmental load( Reference Fisher, James and Sheane 10 ). The European Commission set a goal to reduce GHGE by at least 20 % by 2020. GHGE covers CO2 emissions from fossil fuels, CH4 released during the rearing of cattle and the cultivation of certain crops, and N2O released from fertilizers, manure and ploughing of grassland(1, Reference Solomon, Qin and Manning 11 ). GHGE is expressed as kg CO2-equivalents (CO2e). GHGE for a day’s consumption was estimated to be 4·7 (sd 1·2) kg CO2e for men and 3·7 (sd 0·9) kg CO2e for women in a population-based survey in France( Reference Vieux, Darmon and Touazi 12 ). In Western diets, meat and dairy are the most important contributors to GHGE( Reference Tukker, Goldbohm and Koning 5 , Reference Macdiarmid, Kyle and Horgan 7 , Reference Baroni, Cenci and Tettamanti 13 – Reference Westhoek, Rood and van de Berg 16 ). Changing from a meat- and dairy-based diet towards a more plant-based diet may reduce GHGE by 20–35 % on a daily basis( Reference van Dooren, Marinussen and Blonk 17 – Reference Hoolohan, Berners-Lee and McKinstry-West 19 ). It is less clear what the associations between GHGE and macro- and micronutrient intakes are. Modelling studies show that changing currently consumed diets to diets in accordance with guidelines for healthy nutrition reduces GHGE by about 8 %( Reference Marinussen, Kramer and Pluimers 15 ) to 36 %( Reference Macdiarmid, Kyle and Horgan 20 ). Vieux et al.( Reference Vieux, Soler and Touazi 21 ), on the other hand, reported results that seem to contradict these findings. Self-selected diets of French adults with the highest nutritional quality scores tended to have a high level of diet-related GHGE as well( Reference Vieux, Soler and Touazi 21 ). Obviously, this area of research needs more studies providing insight into the relationships between environmental loads of diets and food and nutrient intakes in real-life settings. Moreover, since children have different consumption patterns and nutritional requirements compared with adults, such associations might be different for adults and children. To our knowledge, no previous studies have calculated the environmental impact of children’s diets.
The aims of the present study were therefore to evaluate the GHGE of diets in Dutch girls, boys, women and men separately and to explore associations with diet composition, total (food and energy) intake and macronutrient intakes. The insights from the study may be used in developing (age- and gender-specific) food-based dietary guidelines that take into account both health and sustainability aspects.
Methods
Study population
Consumption data were from the most recent food consumption survey, the Dutch National Food Consumption Survey (DNFCS) 2007–2010( Reference Van Rossum, Fransen and Verkaik-Kloosterman 22 ), among Dutch children and adults aged 7–69 years. The food consumption of 3819 people was measured on two non-consecutive days, by means of a 24 h dietary recall, in a representative sample of the Dutch population. One individual consuming only meal replacers (for weight reduction) was excluded from the present analyses. Calculations are thus based on 3818 individuals.
The target population comprised all men and women living in the Netherlands between the ages of 7 and 69 years. Pregnant and lactating women, people who were institutionalized and those without adequate command of the Dutch language were excluded. Participants were drawn from representative consumer panels of the market research agency GfK. The market research agency invited selected persons by either post or email to participate in the study. Those who agreed to participate were sent the general questionnaire. Contact with children between the ages of 7 and 15 years was made initially through their parents or carers. The overall response was 69 %.
General questionnaire
The questions in the general questionnaire covered various sociodemographic and lifestyle factors such as physical activity, education level and income. Data from the questionnaires were checked for impossible values, inconsistencies and missing values. Information on educational level was combined and/or aggregated into low, middle and high. The highest educational level of the respondent – or, in case of those aged 7–18 years, the highest educational level of their parents or carers – was defined. The information on physical activity was obtained according to the Squash (Short QUestionnaire to ASses Health enhancing physical activity) questionnaire for adolescents and adults( Reference Wendel-Vos, Schuit and Saris 23 ). Questions on physical activity included activities at work/school, household activities and activities during leisure time. Respondents were asked to state per activity how many days they performed the activity, how many hours per day and what the intensity of the activity was (the question on intensity was available only for adults). In the questionnaires for children (7–11 years) and adolescents (12–18 years) questions on activities more relevant for these age groups were included; for example, questions referring to watching television, computer time, sports at school, walking or cycling to school, sports club activities and playing outdoors. Based on the information in the questionnaires, time spent on physical activities was taken together (based on the manual from Squash) and calculated in MET×h/week( Reference Van Rossum, Fransen and Verkaik-Kloosterman 22 ). MET are metabolic equivalents to assess physical activity levels. General information about the participant (such as self-reported height and weight) was assessed in the food consumption interview. Based on the information on both interview days, the average body weight and height were calculated. BMI was determined as the average body weight (in kilograms) divided by average height (in metres) squared (kg/m2). Estimates of BMR were calculated from standard equations based on weight, age and sex( Reference Schofield 24 ).
Dietary assessment
For the dietary assessment, participants aged 16–69 years were interviewed by telephone by a trained dietitian, on two separate days and at times unknown to the participants. The interview was about the day before the interview (24 h recall). The 24 h period started in the morning on the day before the 24 h recall and continued until the following day when the person got up (the day on which the interview was held). Food consumption on Saturday was recalled on the following Monday. The two 24 h food recalls for children between the ages of 7 and 15 years were compiled by means of face-to-face interviews during home visits. The child’s parents were also present during this interview. Each person was interviewed twice with an interval of about 4 weeks between the interviews. The aim was that all recalled days of the week were equally represented.
The dietitians used the computer-controlled interview software EPIC-Soft® (© International Agency for Research on Cancer)( Reference Van Rossum, Fransen and Verkaik-Kloosterman 22 ). With EPIC-Soft answers were directly entered into a computer( Reference Slimani, Ferrari and Ocke 25 ).
Energy and macronutrient composition
Composition data were already linked to food consumption data via 1599 NEVO food codes. Energy and macronutrient intakes were calculated using an extended version of the Dutch food composition database (NEVO table 2011/3·0)( 26 ).
Greenhouse gas emission of foods and drinks
To estimate GHGE of foods and drinks, life-cycle assessments (LCA) were performed for 254 food items (Blonk Consultants data set, version 2012). LCA is a technique to assess environmental loads associated with all the stages of a product’s life, in this case from farm to fork. The LCA included all phases in between primary production, processing, use of packaging, transport, storage, preparing, cooking and incineration of waste products. Waste in the Netherlands is either recycled or incinerated. Landfilling of municipal waste is forbidden. Part of the organic waste is composted. We assumed waste incineration of packaging materials (plastic, drink cartons, etc.) with energy recovery, except for glass and paper, as the default waste scenario. Wasted amounts of foods were taken into account in the mass balance of the LCA analyses. Emissions and avoided emissions due to incineration and composting of food waste were not included. Foods with the highest (frequency of) consumption in the DNFCS 2007–2010 were selected for the LCA analyses. Calculation of LCA followed uniform calculation methods and current standards like those of the International Organization for Standardization (ISO 14040) and the Publicly Available Specification (PAS 2050). Life-cycle inventory data were collected from primary sources and literature preferably representative for the Dutch situation. Economic allocation was applied for co-products using agricultural statistics (of the FAO and others) and information on food processing (based on literature and additional studies). For background data, Eco-invent (http://www.ecoinvent.ch/) was used. The calculated GHGE are expressed as kg of CO2e/kg of a certain food as consumed. The time horizon for GHGE calculations is 100 years.
An experienced dietitian extended the LCA-based GHGE database for the 254 most frequently consumed foods to the other reported food codes in the DNFCS 2007–2010. Extrapolations were based on the ingredient compositions of the foods, similarities in production system and similarities in type of food and variety. For example, for solid cheese, the available GHGE value for a certain type of solid cheese with high consumption was applied to all other types of solid cheese. For alcoholic beverages, the available GHGE value for gin was used as a value for spirits and brandy, and all beers and wines received the value from a resembling type of beer or wine. GHGE for spices, herbs and meal replacers (for weight reduction) were not included in the analysis.
Environmental load, food, energy and macronutrient intakes of daily diets
For each participant, the mean daily total amount of food and drink was calculated in grams and the GHGE, in kg CO2e. Further analyses were carried out according to gender and age groups separately; girls and boys aged 7–18 years, and women and men aged 19–69 years. For presentation purposes, these groups were classified according to low, intermediate or high environmental load of diets averaged over two days by group-specific tertile cut-off points. This classification provided the basis for further presentation of characteristics and food, energy and macronutrient intakes.
For the analyses of gram intake per food group, we aggregated EPIC-Soft food groups: meat, fish and egg consumption were combined; potato, vegetable, legumes, pulses and fruits were combined; fat, soups and sauces were combined; and sugar, sweets and biscuits were combined( Reference Van Rossum, Fransen and Verkaik-Kloosterman 22 ). Dairy products were classified as dairy drinks, dairy desserts and cheese. Drinks were aggregated into drinks with and without alcohol (in Fig. 2); non-alcoholic drinks were subdivided into fruit and vegetable juices, soft drinks, coffee and tea, and tap water (in Figs 1 and 3).
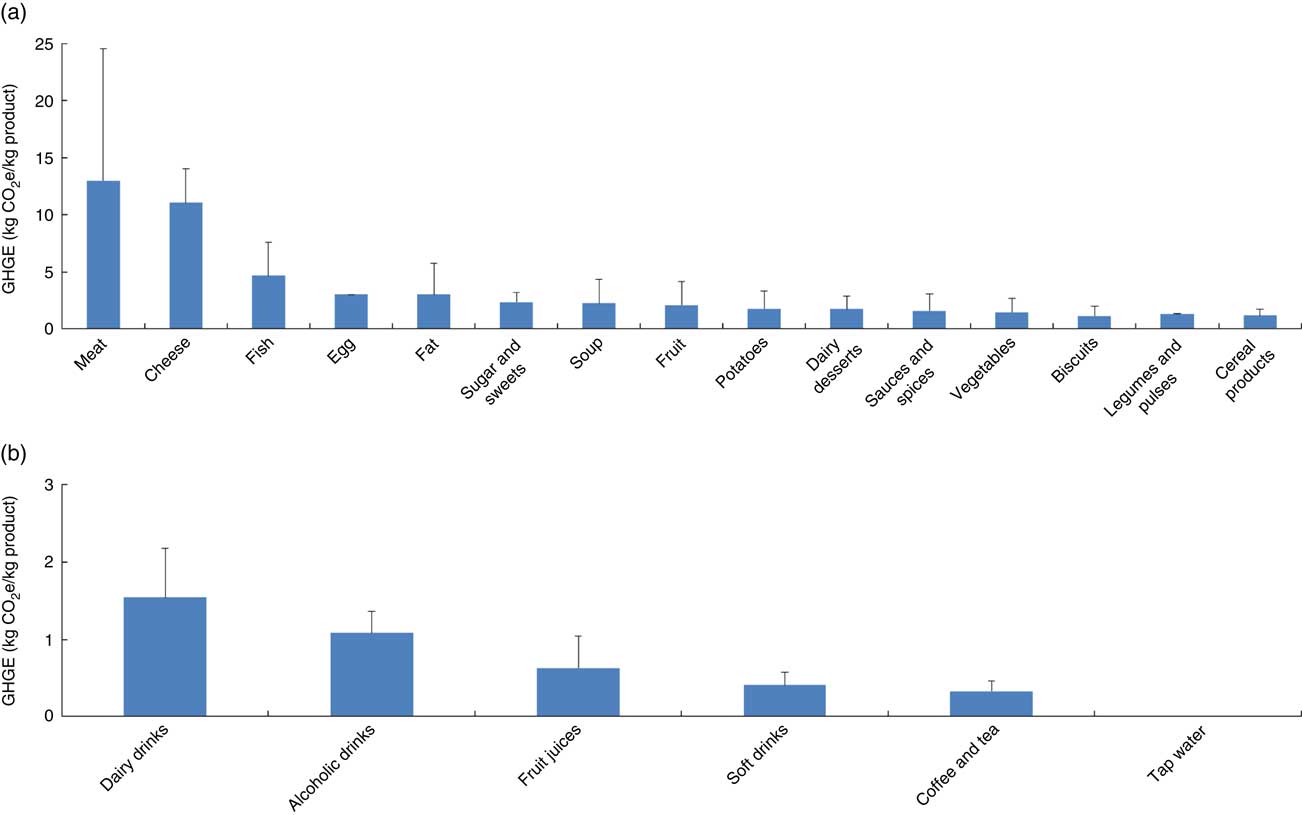
Fig. 1 (colour online) Average greenhouse gas emissions (GHGE; in kg CO2-equivalents (CO2e)/kg product) for different (a) food and (b) drink categories. Values are means, with their standard deviations represented by vertical bars
The ratio of energy intake to physical activity level (EI:PAL) was calculated by dividing each participant’s mean daily total energy intake in kilojoules by the mean physical activity level in MET×h. The ratio of energy intake to BMR (EI:BMR) was calculated for each individual and averaged per subgroup to evaluate the possibility of under- and over-reporting.
Statistical methods
To evaluate the habitual GHGE distributions of daily diets the long-term GHGE was estimated, correcting for the intra-individual variation using SPADE (Statistical Program to Assess Dietary Exposure)( Reference Dekkers, Verkaik-Kloosterman and Slob 27 ).
For all other calculations the mean observed intakes were calculated from the two consumption days. Descriptive statistics (means and standard deviations and percentages of the population) were calculated for the total population, as well as stratified by gender and age and within these categories according to environmental load classification. Further statistical analyses were carried out within groups of girls (aged 7–18 years), boys (aged 7–18 years), women and men (>18 years). For categorical variables, χ 2 tests were applied to test for statistically significant differences between environmental load categories (low, intermediate and high).
To investigate the associations between GHGE of diets and continuous variables (characteristics, food and macronutrient intakes), simple general linear models (GLM procedure of the SAS statistical software package version 9·3) were applied. In the models, GHGE of the daily diet was the dependent variable and the parameter of interest the independent variable, and analyses were carried out by gender and age class. To increase normality we used the natural logarithm of GHGE in all models. In all models, age was included as a covariate. An α level of 0·05 was used to determine statistical significance.
Results
Greenhouse gas emission of foods, daily diets and important food sources
Figure 1 shows the average GHGE of foods and its standard deviation by food group. Meat and cheese had the largest impact per kilogram of food. However, variation within food groups was sometimes large; for example, within the meats, beef had a much larger impact than chicken. Of the drinks (expressed per kilogram), production of dairy drinks involved the highest GHGE.
The habitual GHGE of a day’s consumption in the Netherlands was on average 3·2 kg CO2e for girls, 3·6 kg CO2e for boys, 3·7 kg CO2e for women and 4·8 kg CO2e for men (see Table 1, columns on the right). Age- and gender-specific tertile cut-offs (percentile 33 and 66 based on two recall days) classified diets into low, intermediate and high environmental load (see Table 1, columns on the left). According to habitual intake calculations, percentile 33 was slightly higher than that based on calculations from two recall days; percentile 66 was similar.
Table 1 GHGE (in kg CO2e/d) for a day’s consumption for Dutch girls, boys, women and men

GHGE, greenhouse gas emissions; CO2e, CO2-equivalents; P, percentile.
† Used to define low (below or equal to P33), intermediate (P33–P66) and high (higher than P66) environmental load diets.
‡ Correction for within-person variability and weighted for sociodemographic factors, season and day of the week.
Figure 2 depicts major foods contributing to the GHGE of daily diets. About 40 % of the GHGE of daily diets stemmed from meat and cheese, with a similar percentage in girls, boys, women and men. For all age and gender groups, the contribution of drinks to daily GHGE was approximately 20 %. For children about half of this stemmed from dairy drinks; for adults this was about a third. Other major contributing drinks were soft drinks in girls and boys (about 0·30 kg CO2e), brewed coffee and tea and soft drinks in adults (0·40 kg CO2e for women and 0·45 kg CO2e for men) and alcoholic beverages in men (0·25 kg CO2e). Potatoes, vegetables and fruits contributed approximately 9 % to the GHGE of daily diets.
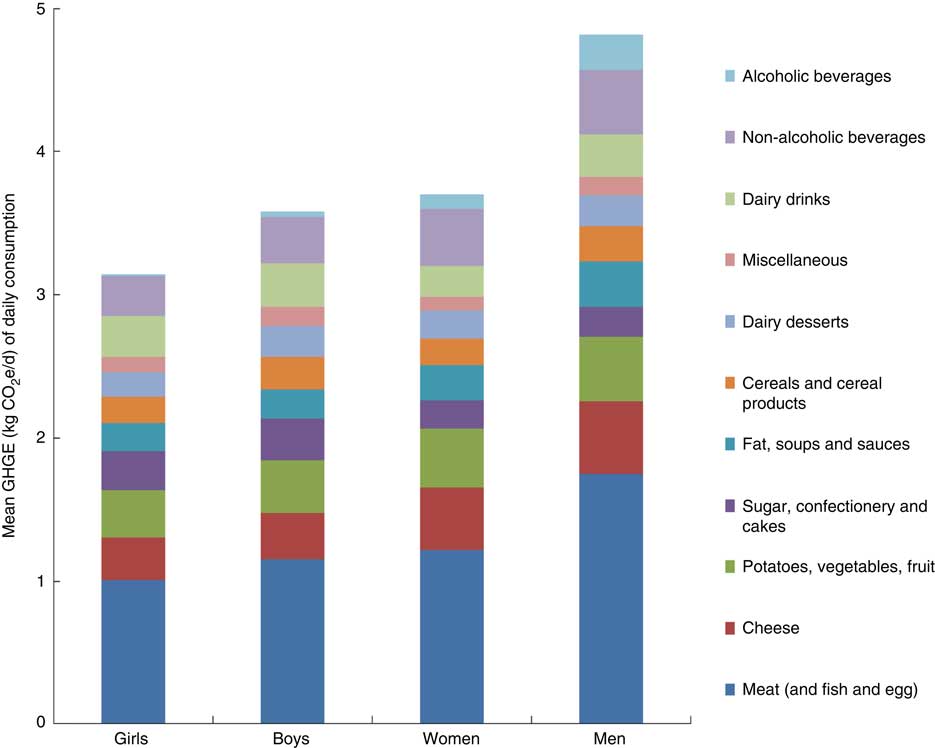
Fig. 2 (colour online) Mean greenhouse gas emissions (GHGE) for a day’s consumption (in kg CO2-equivalents (CO2e)/d) for Dutch girls, women, boys and men, and major contributing sources
Characteristics of the population
Tables 2 and 3 show the characteristics of girls and boys, women and men on average and for persons with diets of low, intermediate and high environmental load. Among girls, boys and women, the average person’s age was higher in the high environmental load groups (the difference is 1 year for girls, 3 years for boys and women). However, for adult men ages were similar across environmental load groups. In further statistical analyses, age was included as a covariate. Environmental loads of diets were not significantly associated with (parents’) education or urbanization grade of the living environment of the person.
Table 2 Characteristics of Dutch girls and boys (7–18 years) with diets of low, intermediate and high environmental load based on habitual GHGE for a day’s consumption
GHGE, greenhouse gas emissions; PA, physical activity; MET, metabolic equivalent of task.
*P<0·05, **P<0·01, ***P<0·001.
† Model to evaluate associations per age and gender group, model adjusted for age.
‡ Education: low=primary education, lower vocational education and advanced elementary education; middle=intermediate vocational education and higher general secondary education; high=higher vocational education and university.
§ Urbanization: high, ≥1500 addresses/km2; moderate, 1000–<1500 addresses/km2; low, <1000 addresses/km2.
Table 3 Characteristics of Dutch women and men (>18 years) with diets of low, intermediate and high environmental load based on habitual GHGE for a day’s consumption
GHGE, greenhouse gas emissions; PA, physical activity; MET, metabolic equivalent of task.
*P<0·05, **P<0·01, ***P<0·001.
† Model to evaluate associations per age and gender group, model adjusted for age.
‡ Education: low=primary education, lower vocational education and advanced elementary education; middle=intermediate vocational education and higher general secondary education; high=higher vocational education and university.
§ Urbanization: high, ≥1500 addresses/km2; moderate, 1000–<1500 addresses/km2; low, <1000 addresses/km2.
Girls, boys and women with diets of higher as compared with lower environmental load were not significantly more active as measured by the physical activity level (in MET×h/week), but men were. Men with higher-environmental-load diets were significantly more active (P=0·0014) than men with low-environmental-load diets. BMI and BMR were higher (+1·6 kg/m2 in girls and +2·7 kg/m2 in boys for BMI; +0·6 MJ/d in girls and +1·4 MJ/d in boys for BMR) in children with high- compared with low-environmental-load diets (P<0·001), after adjustments for differences in age. In adult women and men, BMI and BMR were similar within the different groups of diet environmental load.
Total food and energy intakes
The average total quantity of foods and drinks consumed was 2·2 (sd 0·6) kg/d, 2·5 (sd 0·8) kg/d, 3·1 (sd 0·9) kg/d and 3·4 (sd 1·0) kg/d for girls, boys, women and men, respectively. Of this, 0·9–1·1 kg/d was from foods and the remaining weight was from drinks.
Regarding within-group comparisons (see Tables 4 and 5), girls and women in the high environmental load group consumed about 0·5 kg (300 g of food and 200 g of drinks) more daily than their counterparts in the low environmental load group. Boys and men in the high environmental load group consumed about 1 kg (400–500 g of food and 500–600 g drinks) more daily than their counterparts in the low environmental load group. Total daily energy intake was higher in the high- v. the low-environmental-load diets: for girls and women this difference was approximately 2600 kJ; for boys and men this difference was about 4400 kJ (about +50 %). Higher GHGE of diets was associated with a higher EI:BMR in all groups. GHGE of diets was associated with EI:PAL in girls and women; for boys and men the association was not significant.
Table 4 Total food intake, EI and ratios with BMR and PAL of Dutch girls and boys (7–18 years) with diets of low, intermediate and high environmental load based on habitual GHGE for a day’s consumption
EI, energy intake; PAL, physical activity level; GHGE, greenhouse gas emissions; MET, metabolic equivalent of task.
*P<0·05, **P<0·01, ***P<0·001.
† Model to evaluate associations per age and gender group, model adjusted for age.
Table 5 Total food intake, EI and ratios with BMR and PAL of Dutch women and men (>18 years) with diets of low, intermediate and high environmental load based on habitual GHGE for a day’s consumption
EI, energy intake; PAL, physical activity level; GHGE, greenhouse gas emissions; MET, metabolic equivalent of task.
*P<0·05, **P<0·01, ***P<0·001.
† Model to evaluate associations per age and gender group, model adjusted for age.
Types of foods and drinks
Figure 3(a) depicts the types of food and drinks (calculated from the two dietary recall days) consumed, comparing the high with the low dietary environmental load group. Higher intakes were from all types of foods; from animal-based food groups (meat, dairy, fish and egg) and plant-based food groups (potatoes, vegetables, legumes, fruits, cereal products), as well as drinks. The average intake of meat (and fish and eggs) was 70 g/d, 77 g/d, 84 g/d and 117 g/d, respectively, in girls, boys, women and men in the low GHGE group and was almost twice as high in the high GHGE group. Men in the high environmental load group consumed 220 g/d and a larger share was from beef. Cheese consumption was almost twice as high comparing the high with the low environmental load group. Dairy drink and dessert consumption was about 60 % higher in the high environmental load compared with the low environmental load group. Consumption of potatoes, vegetables and fruits was 30–40 % higher in the high compared with the low environmental load group.
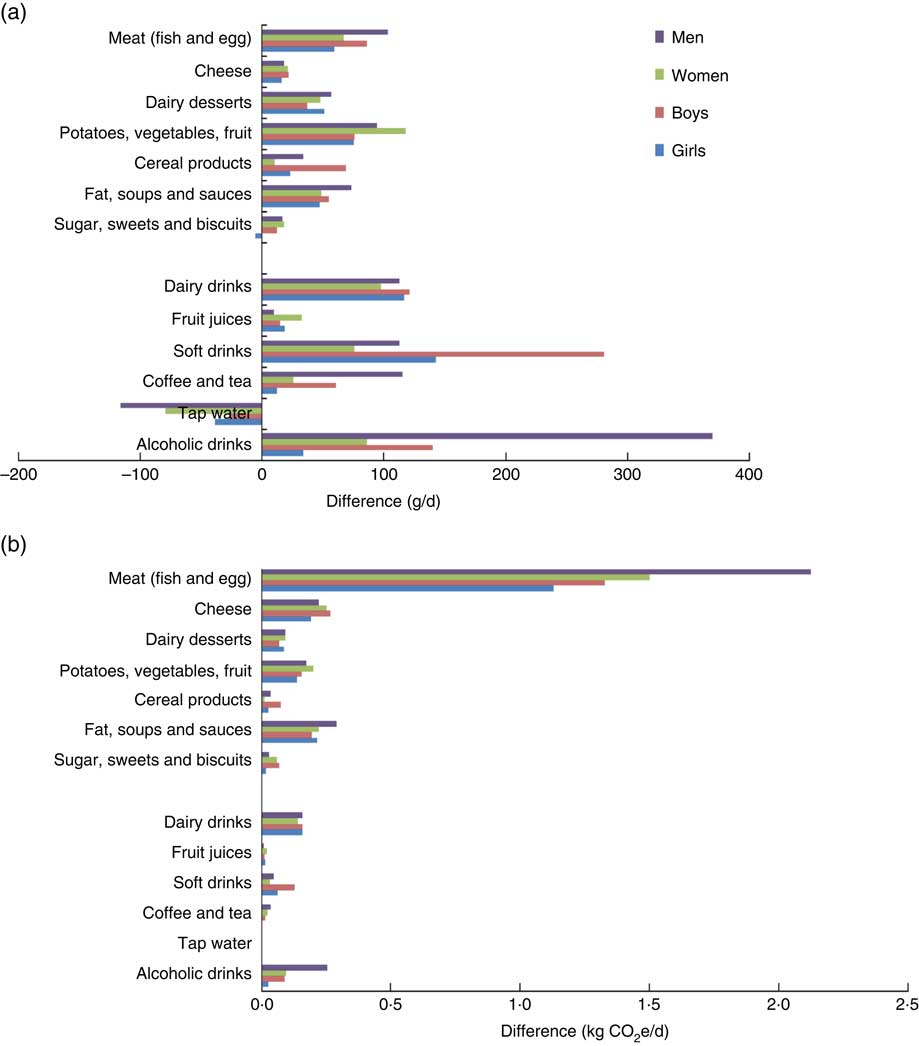
Fig. 3 (colour online) Differences in (a) consumed quantities (in g/d or ml/d) and (b) greenhouse gas emissions (GHGE) of consumed diets (in kg CO2-equivalents (CO2e)/d) within groups of Dutch girls, boys, women and men, when comparing diets with a high and a low environmental load
Notable differences existed in the drinks category. Within all groups, consumption of dairy drinks was higher (about +110 g/d) in the high compared with the low environmental load group. Boys in the high compared with the low environmental load group drank more soft drinks (+281 ml/d). Men in the high GHGE group drank more alcoholic drinks (+370 ml/d), coffee and tea, and soft drinks (combined +100 ml/d) than those in the low GHGE group. Tap water consumption was, in all groups, lower in the high environmental load group compared with the low environmental load group.
Differences in the consumption of animal foods (especially (type of) meat; on average +79 g/d more in the high than in the low environmental load group) determined most of the differences in environmental load of the participants’ diets (see Fig. 3(b)). Differences in soft drink consumption did not translate into a large difference in environmental load; differences in alcoholic drinks did to a certain extent, particularly in men.
Macronutrient intakes
Tables 6 and 7 show the average daily intakes of fibre (per MJ) and macronutrients (as a percentage of total energy intake (E%)) per tertile of dietary GHGE. Figure 4 shows the differences within groups with diets of high as compared with low environmental load. Intakes of total fat, saturated fat, animal-based protein and alcohol were significantly higher, by 2–3 E%, in the high- compared with the low-environmental-load diets. On the other hand, the contribution of vegetable protein (−1 E%) and carbohydrate (mono- and disaccharides as well as polysaccharides) to total energy intake was −4 E%. In addition, fibre intake was lower in the high compared with the low environmental load group (Tables 6 and 7).
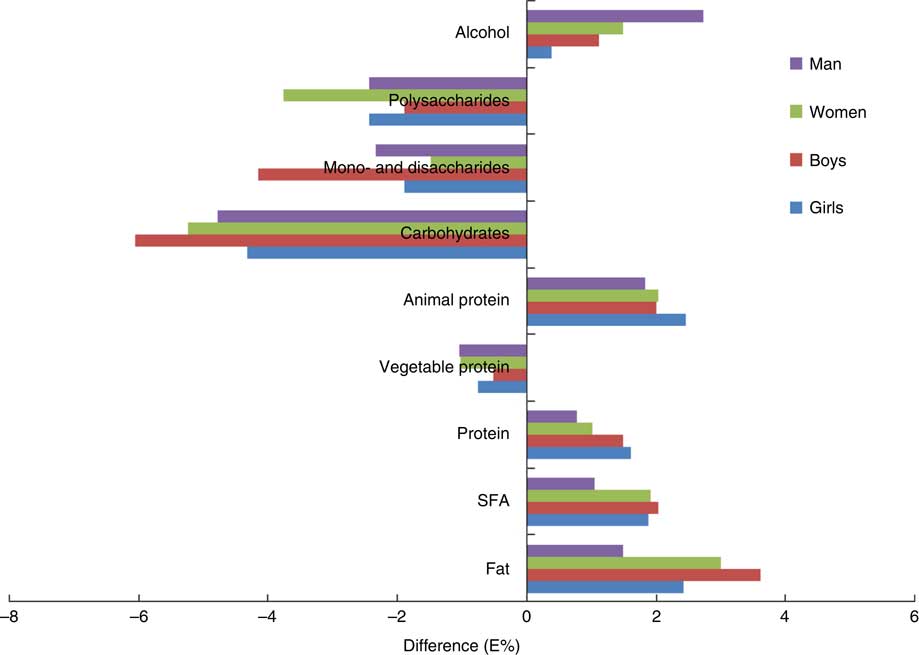
Fig. 4 (colour online) Differences in macronutrient intakes (in percentage of total energy intake (E%)) within groups of Dutch girls, boys, women and men, when comparing diets with a high and a low environmental load
Table 6 Daily intakes of fibre and macronutrients of Dutch girls and boys (7–18 years) with diets of low, intermediate and high environmental load based on habitual GHGE for a day’s consumption
GHGE, greenhouse gas emissions; E%, percentage of energy.
*P<0·05, **P<0·01, ***P<0·001, ****P<0·0001.
† Model to evaluate associations per age and gender group, model adjusted for age.
Table 7 Daily intakes of fibre and macronutrients of Dutch women and men (>18 years) with diets of low, intermediate and high environmental load based on habitual GHGE for a day’s consumption
GHGE, greenhouse gas emissions; E%, percentage of energy.
*P<0·05, **P<0·01, ***P<0·001, ****P<0·0001.
† Model to evaluate associations per age and gender group, model adjusted for age.
Discussion
The present study evaluated the GHGE of diets in Dutch girls, women, boys and men separately and evaluated high- compared with low-environmental-load diets for differences in diet composition, total (food and energy) intake and macronutrient intakes. Meat and cheese contributed about 40 % and drinks (including milk and alcoholic drinks) 20 % to daily GHGE. This was similar in all age and gender groups. Considerable variation in environmental loads of diets existed within age and gender groups. Major differences between high- and low-GHGE diets were in meat, cheese and dairy consumption as well as in soft drinks (girls, boys and women) and alcoholic drinks (men). Of those, differences in (type of) meat consumption determined the differences in GHGE most. The significant association between GHGE of diets and EI:PAL in women suggested that energy intakes are balanced less with the level of physical activity in females with high-environmental-load compared with low-environmental-load diets. Independent of the total amount of energy, the high-environmental-load diets contain significantly more (saturated) fat, more animal protein and more alcohol (especially in men) and less vegetable protein, carbohydrates and fibre.
Recent studies have analysed GHGE of modelled diets( Reference Macdiarmid, Kyle and Horgan 20 ) or observed diets( Reference Vieux, Darmon and Touazi 12 , Reference Vieux, Soler and Touazi 21 ) and compared these with calculated nutritional intakes( Reference Macdiarmid, Kyle and Horgan 20 ) as well as with a combined diet score( Reference Vieux, Soler and Touazi 21 ). In a recent study by Vieux et al.( Reference Vieux, Soler and Touazi 21 ), higher diet-related GHGE was associated with higher fruit and vegetables as well as higher meat and fish consumption. Similarly, we found that higher GHGE of daily diets was associated with higher intakes of plant-based foods and even higher intakes of animal foods (see Fig. 3). In agreement with more animal foods in the diets, the high-GHGE diets contained more (saturated) fat, more animal protein, more alcohol, and less vegetable protein and carbohydrates. Vieux et al.( Reference Vieux, Soler and Touazi 21 ) by correcting for energy intake beforehand and available modelling studies( Reference Marinussen, Kramer and Pluimers 15 , Reference Macdiarmid, Kyle and Horgan 20 , Reference Vieux, Soler and Touazi 21 , Reference Wallén, Brandt and Wennersten 28 ) did not take into account the different levels of energy intake that are observed at the population level, especially in relation to physical activity levels. In a previous study however, Vieux and colleagues showed that when energy intakes were reduced to meet individual energy needs the diet-associated GHGE may be reduced up to 10 %( Reference Vieux, Darmon and Touazi 12 ). Efforts to balance energy intakes with energy requirements are the most efficient and feasible via animal-based foods and via sugar- and alcohol-containing drinks, especially in high-environmental-impact diets. For example, 418 kJ (100 kcal) is represented by 37 g of pig meat, 27 g of cheese, 161 g of apple, 370 g of broccoli, 243 g of sugar-containing beverage or 217 g of beer. Lower intake of animal foods will also decrease GHGE by 0·3 kg CO2e (for 37 g lower intake of pig meat or 27 g less cheese). Not drinking or replacing sugar- or alcohol-containing drinks by tap water will decrease GHGE by on average 0·3 kg CO2e for children and up to 0·7 kg CO2e for men. In most dietary guidelines around the world, balancing energy intake with requirement is the most prominent message given( 29 ). An unfavourable dietary composition additionally leads to considerable health loss, especially via the high intakes of saturated and trans fatty acids and low intakes of fish, fruit and vegetables( Reference van Kreijl, Knaap and van Raaij 30 ). However, consumption of meat, cheese, sugar- and alcohol-containing drinks is rooted in the current Dutch eating culture. Lowering their consumption, therefore, will not be easy and has implications for other determinants such as taste, cultural acceptability, the position of foods in meals and price, as well as nutritional consequences.
It is a challenge to identify diets with less environmental impact without compromising the nutritional quality of the diet, especially in risk groups for inadequate intakes in the Netherlands. In currently observed diets in the Netherlands, meat products contribute more than 15 % to intakes of Fe, P, Se, Zn, retinol, thiamin and vitamins B6, B12 and D, as well as EPA and DHA( Reference Van Rossum, Fransen and Verkaik-Kloosterman 22 ). Dairy products contribute more than 15 % to intakes of Ca, Mg, P, K, Zn, retinol, riboflavin and vitamin B12 Reference Van Rossum, Fransen and Verkaik-Kloosterman (22 ). On the other hand, meat and dairy products contribute to unfavourably high intakes of SFA and trans-fatty acids. Average SFA intake currently exceeds the recommended maximum of 10 E%( Reference Van Rossum, Fransen and Verkaik-Kloosterman 22 ). This is similar in other European countries( Reference Mozaffarian and Capewell 31 ). A recent European evaluation suggests low intakes of minerals and vitamin D in specific age groups( Reference Mensink, Fletcher and Gurinovic 32 ). So, probably a more targeted group and/or even an individual approach is needed to advise how a more environmentally friendly and healthy food consumption can be reached. Such advice should start with energy intakes v. requirements and take into account the environmental load as well as the nutrient composition of currently consumed foods and possible replacement foods. In a previous modelling study, we showed( Reference Temme, van der Voet and Thissen 33 ) that with carefully chosen currently available replacement foods it is possible to lower the environmental load of diets while maintaining current total Fe levels and reducing SFA levels for young Dutch females (19–30 years). However, other nutrients were not assessed( Reference Temme, van der Voet and Thissen 33 ). Further research on the effects of replacement or reduction scenarios on vitamin and mineral intakes is needed. Identifying ranges including upper levels of recommended intakes of meat, cheese and dairy may help consumers towards diets with lower GHGE.
Studies in the field of sustainable diets( Reference Macdiarmid, Kyle and Horgan 20 , Reference Vieux, Soler and Touazi 21 , Reference Wallén, Brandt and Wennersten 28 ) as well as food-based dietary guidelines focus mainly on solid foods. Yet, our study shows that one-fifth of the daily load is attributable to drinks. While the load per kilogram is relatively low, consumption is high and large differences in consumed amounts exist within age and gender groups. On average, non-alcoholic drinks contributed 17 % to daily GHGE and alcoholic drinks another 3 % in women and 5 % in men. Dutch children drank more soft drinks (girls +143 g/d and boys +280 g/d) and men more alcoholic drinks (+370 g/d), but less tap water, in the high- compared with the low-environmental-load diet. Drinking less sugar- and alcohol-containing drinks would reduce both the GHGE of daily diets as well as energy intake. Previous studies showed that the consumption of sugar-containing beverages is associated with overweight in a longitudinal trial( Reference Ludwig, Peterson and Gortmaker 34 ) as well as with higher body weight in a randomized trial( Reference de Ruyter, Olthof and Seidell 35 ). Our cross-sectional analyses indicated about 2 kg/m2 higher BMI in children with diets with high compared with low environmental loads. On the other hand, GHGE of diets was not associated with physical activity levels in girls and weakly associated in boys.
The strength of the present study is the new type of research question that combines the disciplines of environmental impact assessment and public health nutrition. For the first time, the diets of children have been analysed for environmental loads. The study identifies associations of food as well as drink consumption with environmental load and identifies opportunities to reduce the environmental load, starting from observed consumption patterns. In the current paper, we relied on the environmental indicator GHGE as a proxy for environmental impact. While this indicator is generally in line with other indicators such as land use and use of fossil energy, emissions may not always indicate an absence of other environmental impacts. For example, while a certain crop such as tomatoes produced in Spain may not be GHGE intensive, the reliance on irrigation may exacerbate water stress in countries that experience water scarcity( Reference van Oel, Mekonnen and Hoekstra 36 ).
Understanding the quality of data underlying these analyses as well as the uncertainties involved is of major importance. Data on GHGE may vary because of farming methods, animal feed, use of side products, transport and growing conditions( Reference Garnett 1 ). In our case, we have tried to be as representative as possible for the Dutch situation by taking into account all steps between primary production and preparation by the consumer, and by including waste treatment. In most cases, the GHGE estimates of foods are determined largely by the primary production phase. For the impacts of drinks, the share of packaging was more important and for brewed coffee and tea the boiling of water was the most dominant part. GHGE estimations were available for the most frequently consumed foods. Extrapolations were made for all other foods consumed except for spices, herbs and meal replacers. The uncertainty in the environmental indicators is due to known uncertainties in shares and amounts of fertilizers and variability in the energy inputs during processing steps. A similar method was used in a previous publication( Reference Vieux, Soler and Touazi 21 ), although sometimes based on fewer data and without including the retail and consumer phases and waste treatment( Reference Macdiarmid 3 ).
In addition, quality aspects of the food consumption survey and its food composition data are of importance for the interpretation of the study results. The average response rate in the food consumption survey was high (69 %). It was concluded that the study population adequately represented the Dutch population as a whole and was representative with regard to age and sex within each age group, region, degree of urbanization and education( Reference Van Rossum, Fransen and Verkaik-Kloosterman 22 ). This means that results may be generalized to the Dutch population. In the dietary assessment, however, there may have been a tendency for under-reporting( Reference Van Rossum, Fransen and Verkaik-Kloosterman 22 , Reference Freisling, van Bakel and Biessy 37 ). Calculations of EI:BMR confirmed this suggestion, especially for adults. On average, energy intake was underestimated by about 15 %( Reference Van Rossum, Fransen and Verkaik-Kloosterman 22 ). It is therefore likely that GHGE was underestimated in a similar order of magnitude. The results comparing high and low GHGE groups must be interpreted with caution, especially in adults, since more under-reporting occurred in the low GHGE group. However, the energy percentage of animal protein and saturated fat were still lower in the low GHGE group compared with the high GHGE group, indicating that dietary differences between GHGE groups cannot be entirely explained by under-reporting. Moreover, some calculations were based on averages from the two recall days. Compared with calculations using corrections for within-person variability, the distribution based on two recall days was somewhat skewed with a left tail. This shows that GHGE in the lowest tertile was an underestimation of habitual GHGE of the diet. The calculations based on two recalls may also have resulted in some misclassification of participants with regard to their usual diet. For associations with personal characteristics this is expected to lead to attenuated relationships. For associations with dietary characteristics, associations within a daily menu might have partly driven the results. For the measures of physical activity levels, it should be realized that MET scores were based on questionnaires and were not the focus of the food consumption survey. We do not think that the above limitations lead to major flaws in the results. Caution, however, is needed when results are extrapolated to other populations.
The findings in the present paper may provide input for future food-based dietary guidelines as well as intervention strategies to lower the environmental load of diets of Dutch girls, boys, women and men. The GHGE of daily diets is on average 3·2 kg CO2e for girls, 3·6 kg CO2e for boys, 3·7 kg CO2e for women and 4·8 kg CO2e for men in the Netherlands. Meat, cheese and drinks contribute more than half of daily GHGE. Considerable differences in environmental loads of diets exist within age and gender groups. A lower intake of animal-based foods (especially meat and cheese) and/or replacement by plant-based foods is associated with a reduced environmental load, as well as a lower SFA intake and a higher fibre intake, in children and adults. Reduced consumption and/or replacement of sugar-and/or alcohol-containing drinks may additionally lower environmental impact as well as energy intake.
Acknowledgements
Acknowledgements: The authors thank Marja Beukers for performing the calculations of habitual environmental impact of diets. Financial support: The present study was funded by the Ministry of Economic Affairs. The Ministry of Economic Affairs had no role in the design, analysis or writing of this article. Conflict of interest: None. Authorship: E.H.M.T. initiated the study. E.H.M.T., I.B.T., G.F.H.K., M.C.C.B. and J.M.M.D. were involved in data collection and data analysis. M.C.C.B., E.H.M.T. and I.B.T. prepared the first draft of the manuscript, which was critically evaluated and refined by G.F.H.K., J.M.M.D., M.T. and M.C.O. E.H.M.T. prepared the final draft of the manuscript. All authors participated intellectually in the development of the paper. Ethics of human subject participation: Ethical approval was not required.


