


INTRODUCTION
Non-typhoidal Salmonella is estimated to cause 1 million domestically acquired foodborne illnesses in the United States annually, with more than 19 000 hospitalizations and at least 378 deaths, more than any other bacterial pathogen [Reference Scallan1]. Salmonella Enteritidis (SE) has long been among the top three serovars causing human salmonellosis, accounting for 13–19% of Salmonella isolates and 26–34% of Salmonella outbreaks reported annually [2–Reference Braden4]. In the mid-1970s, the incidence of laboratory-confirmed SE infections and the number of foodborne SE outbreaks started to increase sharply and, by 1994, SE was the most common Salmonella serovar reported [Reference Braden4, Reference Patrick5]. Eggs were first linked to SE infection in the United States in 1988 when an analysis of SE outbreaks identified commercial grade A shell eggs as the most important source; subsequent efforts focused on control of SE in shell eggs [Reference Patrick5–7].
An estimated 67 billion shell eggs are produced each year in the United States, and each US citizen consumes an estimated 234 eggs per year [8]. Interventions targeting SE in eggs have included elimination of SE from grandparent flocks of egg-layer hens, egg refrigeration requirements, egg traceback programmes targeting sources of SE outbreaks, safe handling labels on shell egg products at retail, restrictions on shell egg use in retail establishments and nursing homes [8–Reference Hogue14], and state-based egg quality assurance programmes to reduce SE contamination on egg-laying farms [Reference Mason13–Reference Mumma15]. Several of these intervention strategies also have set specific public health targets to decrease the incidence of SE illnesses attributable to shell eggs. Nonetheless, the incidence of SE infections in the Foodborne Diseases Active Surveillance Network (FoodNet) increased by 44% from 1996 to 2009 [Reference Chai16, 17]. The reasons for the increase in SE incidence are unclear, but the importance of different sources of SE has likely changed since the 1980s as interventions designed to lower the risk associated with specific food reservoirs were implemented.
We analysed foodborne SE outbreaks reported from 1973 to 2009 to explore the possible effect of interventions related to shell egg production, distribution, and handling during food preparation before the US Food and Drug Administration (FDA) implemented the Egg Safety Final Rule in 2010 [8].
METHODS
Data
We obtained data from CDC's Foodborne Disease Outbreak Surveillance System (FDOSS) on SE outbreaks occurring during 1973–2009. CDC defines a foodborne disease outbreak as the occurrence of ⩾2 similar illnesses resulting from the ingestion of a common food. State, local, and territorial health departments voluntarily submit reports of investigated outbreaks to FDOSS using a standard form [Reference Gould3]. We included variables for year the outbreak occurred; state where the outbreak occurred; estimated number of illnesses, hospitalizations, and deaths; implicated food(s) and contaminated ingredients; and the setting of food preparation.
Outbreaks with implicated foods or contaminated ingredients were grouped into one of five categories for analyses related to foods: ‘simple egg’ (egg was the contaminated food or ingredient), ‘complex egg’ (food contained more than one ingredient, including egg, but contaminated ingredient was not reported), ‘simple chicken’, ‘complex chicken’, and ‘other’ (food did not contain either chicken or egg). We excluded from food-related analyses outbreaks with multiple foods implicated or foods that contained both chicken and eggs implicated. The data fields in the form were modified as FDOSS changed from a paper-based data collection system (1973–1998) to an electronic system (1998–2008) and again when the electronic data collection system was expanded to include non-foodborne outbreaks (2009). The form for reports submitted before 1998 did not have the ‘contaminated ingredient’ variable, so we considered the implicated food to be ‘simple egg’ if the food consisted of egg only (e.g. scrambled eggs, or boiled eggs) or if ‘made with raw egg’ or ‘with egg’ was specifically listed in the implicated food field. For some analyses, we aggregated outbreaks with implicated foods in the ‘simple egg’ and ‘complex egg’ food categories to an ‘egg-containing’ group and outbreaks in the ‘simple chicken’ and ‘complex chicken’ categories to a ‘chicken-containing’ group. Outbreaks with no implicated food and those with multiple foods reported were aggregated to an ‘unknown’ group.
We categorized the settings of food preparation into six groups; healthcare (e.g. hospital, nursing home, drug rehabilitation facility), institutional (e.g. college, university, daycare, county jail), social (e.g. hotel, wedding, country club, office party), retail food (e.g. restaurant, mobile food vendor, delicatessen, caterer), private home, and other. We assigned SE outbreaks with a single food preparation setting to one of these categories.
We also used population data from the U.S. Census Bureau [18] to determine population-based annual state reporting rates of SE outbreaks by implicated food category and food preparation setting and to assign states to US census regions: Northeast, Midwest, South, and West. We assumed complete reporting of SE outbreaks, and calculated the annual rate of SE outbreaks by dividing the annual number reported by a state by the estimated population of the state that year. For statistical analysis, we calculated the average rate of SE outbreaks for the study period, for each year of analysis, and for each census region during each of four periods (1973–1981, 1982–1990, 1991–1999, 2000–2009).
Statistical analysis
We conducted descriptive analyses to summarize the number of illnesses, hospitalizations, and deaths associated with SE outbreaks, the number of outbreaks overall and stratified by implicated food category and food preparation setting, and the annual average rate of change in the number of reported SE outbreaks. We examined changes over time in the number of foodborne outbreaks, and in the 3-year simple moving average, overall and stratified by food category, as well as changes in the average rate of foodborne outbreaks overall and stratified by census region.
We used Joinpoint regression software [19] to identify specific years when a change occurred in the trajectory of the trend in the average rate of SE outbreaks overall, of outbreaks linked to foods containing eggs or chicken, and in the proportion of SE outbreaks attributed to foods containing eggs or chicken. We also used permutation tests to compare the regression functions of models with different numbers of years (i.e. joinpoints) in the study period possibly corresponding to a significant change in the slope of the annual trend line. We evaluated six possible regression models, starting with a minimum model consisting of no joinpoints (i.e. no change in trend), and increasing the number to a maximum of five (i.e. six possible trends during the study period).
In addition, we used Poisson regression to assess whether there were significant changes during the four periods in the average rates of SE outbreaks attributed to egg- or chicken-containing foods in different food preparation settings after adjusting for differences in the different US census regions. Regression analyses compared the average rate of SE outbreaks in each setting by US census region during each of the four periods.
RESULTS
Overall, 1328 SE outbreaks (38% of foodborne outbreaks caused by non-typhoidal Salmonella) were reported to CDC from 1973 to 2009, resulting in 40 767 estimated illnesses, 4325 hospitalizations, and 104 deaths. The annual number of SE outbreaks and outbreak-associated illnesses began to increase in the 1980s, with the number of illnesses peaking in 1987 (2670 illnesses) and outbreaks peaking in 1990 (84 outbreaks) (Fig. 1). Following these peaks, the numbers of SE outbreaks and associated illnesses decreased fairly consistently for the next 5 years, then became fairly stable until 2002 when it decreased and became stable again. Joinpoint regression showed a significant change in the trajectory of the average rate in 1990, from an average annual increase of 0·4% per year before then to an average decrease of 0·4% per year afterwards. We used 1990 to define a period of increase, subdivided into ‘early increase’ (1973–1981) and a ‘late increase’ (1982–1990) periods, and a period of decrease, subdivided into ‘early decrease’ (1991–1999) and ‘late decrease’ (2000–2009) periods.
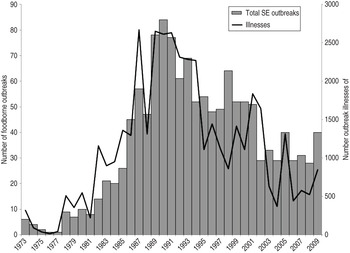
Fig. 1. Number of foodborne Salmonella enterica serovar Enteritidis (SE) outbreaks and associated illnesses in the United States, 1973–2009
The geographical distribution of SE outbreaks changed over the 37-year study period (Fig. 2a–d ). Throughout the study period, they were most common in the Northeast (n = 616, 46% of SE outbreaks). However, between 1990 and 1999, as outbreaks declined in the Northeast (from 270 in 1982–1990 to 226 in 1991–1999), they increased in the West (from 19 to 132), Midwest (from 23 to 77), and South (from 74 to 86). The average rate of SE outbreaks per 100 000 population was highest in the Northeast during all time periods except 2000–2009, when it was highest in the West (0·18/100 000 vs. 0·21/100 000, respectively).
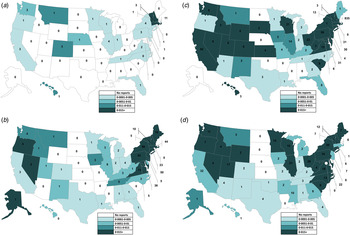
Fig. 2. Number of foodborne Salmonella enterica serovar Enteritidis outbreaks and average annual reporting rate per 100 000 population by state. (a) 1973–1981 (n = 48), (b) 1982–1990 (n = 392, excludes one multistate outbreak), (c) 1991–1999 (n = 526, excludes one multistate outbreak), (d) 2000–2009 (n = 362, excludes eight multistate outbreaks).
Of SE outbreaks with a single food preparation setting (n = 1089), most were associated with retail food preparation settings (n = 607, 59%). The number of outbreaks with retail food preparation settings remained stable during the latter two periods while the total number of SE outbreaks declined, resulting in an increasing percentage of outbreaks associated with this setting, from 50% (192/382 outbreaks) during 1982–1990 to 56% (192/343 outbreaks) during 1991–1999 and 66% (204/308) during 2000–2009. Outbreaks associated with food prepared in private homes followed; more occurred during 1991–1999 (n = 83, 24% of outbreaks during that period) and 2000–2009 (n = 65, 21%) than during 1982–1990 (n = 35, 9%). By contrast, the number and percentage of outbreaks associated with food prepared in a healthcare setting declined steadily after the peak of 58 (15% of SE outbreaks) in 1982–1990 to 11 (4%) in 2000–2009. Although the number of outbreaks associated with social settings declined from a peak of 37 in 1982–1990 to 11 in 2000–2009, the percentage was stable (9%) over time. The role of institutional settings in SE outbreaks was variable; institutions were the second most common setting associated with outbreaks (16%) in 1982–1990 but accounted for no more than 6% of outbreaks in later periods.
At least one food was implicated in 774 (58%) SE outbreaks. In 636 (48% of all SE outbreaks), a single food or contaminated ingredient was implicated. These outbreaks were classified into six categories as follows; simple egg (n = 253 outbreaks, 37%), complex egg (n = 197, 29%), simple chicken (n = 33, 5%), complex chicken (n = 17, 3%), other single food category (n = 63, 5%), and other complex food (n = 73, 5%). Although egg-containing foods were most commonly implicated in all four periods (Fig. 3), the number was highest during the 1991–1999 period (n = 216, 41% of SE outbreaks). By contrast, the number of outbreaks attributed to chicken-containing foods increased steadily over the study period, from six (2%) during 1982–1990 to 23 (6%) during 2000–2009. The number attributed to ‘other’ foods also increased over that period, from 45 (11%) to 64 (18%). Of those outbreaks attributed to other single food categories, beef was most common (n = 13, 21%), followed by turkey (n = 9, 14%) and pork (n = 7, 11%).
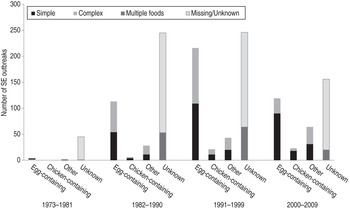
Fig. 3. Number of foodborne Salmonella enterica serovar Enteritidis (SE) outbreaks associated with selected food categories in four time periods (n = 1328), 1973–2009. [Egg-containing foods include simple foods (in which eggs were the implicated ingredient) and complex foods (in which eggs were an ingredient, but were not specifically implicated)]. The same is true for chicken-containing foods.
The 3-year simple moving average number of outbreaks attributed to egg-containing foods exhibited two peaks: one in 1991 and a second in 1998 (Fig. 4). Following the peak in 1998, the 3-year average number of outbreaks implicating egg-containing foods steadily declined. By contrast, the 3-year average number of outbreaks implicating foods that did not contain eggs steadily increased until 1999, then also began to steadily decline. The results of joinpoint regression showed the rate of SE outbreaks attributed to egg-containing foods changed in 1990 from an average annual increase of 0·2% per year to an average decrease of 0·1% per year. In addition, the proportion of SE outbreaks where egg-containing foods were implicated changed in 1997 from an average increase of 2% per year to an average decrease of 2% per year. No joinpoints were identified in the analyses of SE outbreaks attributed to chicken-containing foods.
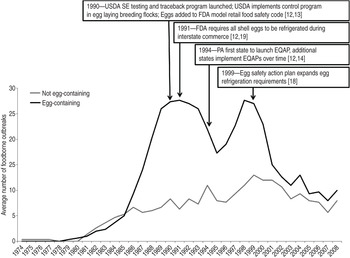
Fig. 4. Three-year simple moving average number of foodborne Salmonella enterica serovar Enteritidis (SE) outbreaks reported to the Foodborne Disease Outbreak Surveillance System implicating foods either not containing eggs or containing eggs, 1973–2009 (n = 681). [Does not include outbreaks where implicated food information was missing or unknown (n = 554), or multiple foods were implicated (n = 138).]
The Poisson regression analysis showed that, accounting for differences in census regions, the average rates of SE outbreaks attributed to egg-containing foods varied markedly by time period (Table 1). Compared to the ‘early increase’ period of 1973–1981, rate ratios (RR) were significantly elevated for all subsequent time periods; the highest RR occurred during the ‘early decrease’ period of 1991–1999 (RR 21·9, P < 0·001) and then dropped in 2000–2009 (RR 9·9, P < 0·05). The RRs by geographical regions and retail food preparation settings were smaller but were consistent with the patterns described for foodborne SE outbreaks overall. Compared to the Western region, the RRs for SE outbreaks attributed to egg-containing foods were significantly higher in the Northeast (RR 1·5, P < 0·001) region. Compared to all other food preparation settings where egg-containing foods were implicated, the RR of outbreaks with a retail food preparation setting was significantly higher (RR 1·9, P < 0·001). The average rates of SE outbreaks where a chicken-containing food was implicated were too low for multivariable Poisson regression analyses.
Table 1. Poisson regression analysis of factors related to population-based state reporting rates of foodborne Salmonella enterica serovar Enteritidis outbreaks associated with egg-containing foods, 1973–2009
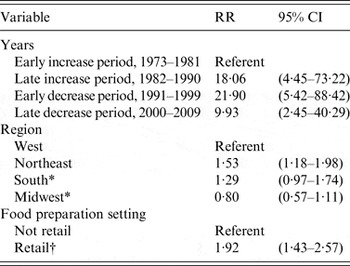
RR, Rate ratio; CI, confidence interval.
* Non-significant result.
† Includes food service preparation settings, such as restaurants, mobile food vendors, and delicatessens.
DISCUSSION
Our study suggests that implementation of multiple interventions to decrease exposure to shell eggs contaminated with SE coincided with a significant decline in foodborne SE outbreaks overall as well as significant declines in the rate and proportion of outbreaks attributed to egg-containing foods. These results suggest that the geographical distribution and food preparation settings of foodborne SE outbreaks during the study period were mostly driven by the epidemiology of outbreaks attributed to egg-containing foods in particular. Multiple national and state interventions implemented after 1989 are summarized in Figure 4 and include such programmes as the introduction of farm traceback programmes and control programmes requiring offspring of egg-laying breeding flocks to originate from SE-free grandparent flocks [US Department of Agriculture (USDA), 1990] [Reference Policicchio10, Reference Hogue14], the addition of eggs to the list of potentially hazardous foods in the Model Retail Food Safety Code (FDA, 1990) [Reference Policicchio10], refrigeration requirements for all shell eggs in interstate commerce (FDA, 1991) and in retail establishments (FDA, 1999), and adoption of state Egg Quality Assurance Programs (EQAPs) [Reference Policicchio10, Reference Mason13, Reference Hogue14]. Implementation of these programmes coincide with the change in trajectory of the population-based rate of SE outbreaks overall, and those attributed to egg-containing foods in particular, from a steady increase before 1990 to a fairly steady decrease afterward. Nonetheless, during this period of overall decline, foodborne SE outbreaks continued to expand from an initial focus in the Northeast to other regions of the country, and the proportion of outbreaks attributed to egg-containing foods continued to increase. Similarly, after a steady decline between 1991 and 1995, the 3-year average number of outbreaks attributed to egg-containing foods increased again from 1996 to 1998 before steadily decreasing again.
These temporal and geographical patterns in SE outbreaks may have occurred because state-based interventions, such as EQAPs and the FDA Model Food Code, were first implemented in the Northeast, where human foodborne outbreaks had been traced to SE-infected flocks, and SE prevalences in egg-laying flocks and in unpasteurized liquid eggs were highest [Reference Mason13, Reference Hogue14]. However, subsequent surveys found SE infection continued to increase in poultry flocks, particularly in the Northeast, Central, and Southeast regions of the country, while the adoption of interventions by states occurred gradually over time [12–Reference Mumma15]. The data is consistent with a premise that as the number of states adopting interventions in the egg-producing and food service industries increased during the 1990s, the 3-year average number and proportion of SE outbreaks attributed to egg-containing foods significantly changed, beginning to decrease notably after 1997.
During 1973–2009, retail food service establishments accounted for more SE outbreaks than any other food preparation setting. This category was the only setting significantly associated in Poisson regression with higher rates of outbreaks attributed to egg-containing foods. The number of outbreaks associated with retail settings remained stable during the study period, resulting in an increasing proportion of outbreaks in these settings over the study period. This finding may reflect to some extent a surveillance bias, as outbreaks associated with retail food establishments are more likely to be detected, investigated, and reported by public health departments than outbreaks in other settings [Reference Green20, Reference Murphree21]. However, the association between SE outbreaks and retail food preparation settings is also supported by a 1996 case-control study that found an association between SE infection and a larger number of meals prepared outside the home [Reference Kimura22], as well as a 2002 study that found that high-risk egg preparation practices were common in restaurants [Reference Lee23]. The FDA Model Food Code provides a model for food safety regulation of food service establishments, such as restaurants and nursing homes, with evidence-based requirements for safe food preparation. As of August 2013, only 32 of the 56 states and territories reported adoption of one of the two most recent editions of the Food Code [12].
The decline since 1990 in SE outbreaks associated with food prepared in healthcare settings suggests that national efforts to increase awareness of egg safety by those serving vulnerable populations may have contributed to improved food safety in these settings. In particular, in 1992, CDC, FDA, and the Health Care Financing Administration launched a national educational campaign as an intervention to improve food safety in healthcare settings. Of the educational materials provided to facilities during this effort was information about risks of SE infection associated with egg-containing foods, and guidance for safe egg handling. By contrast, the higher number and proportion of SE outbreaks associated with food prepared in the private home since 1991 suggests that consumer preferences and food preparation practices in the home have not improved over time. A 2010 consumer behaviour study led by FDA found that 44% of respondents reported consuming undercooked or runny eggs in the previous 12 months, representing an increase from the previous survey in 2006 [Reference Fein24]. Likewise, studies of vulnerable populations, such as pregnant women and organ transplant recipients, indicate little difference in risky consumption practices; nearly one-third of respondents in these vulnerable populations report consuming undercooked eggs or foods containing raw eggs [Reference Trepka25, Reference Kosa26].
The number of reported foodborne SE outbreaks was relatively stable from 2002 to 2009. During this time, the estimated US incidence of SE illnesses began to increase after steadily declining throughout the 1990s [Reference Chai16]. Although the 3-year average number of outbreaks attributed to both egg-containing and non-egg-containing foods continued to decline, the relative number of outbreaks with no food reported increased. It is possible that the observed declines in outbreaks attributed to egg-containing and non-egg-containing foods are the result of a surveillance artifact and simply reflect smaller numbers of outbreak investigations implicating a single food or ingredient. However, in the early 2000s new foods, such as raw sprouts and nuts, were recognized as causes of SE outbreaks, and beef, pork, chicken, and turkey were more frequently attributed to outbreaks. These differences in the foods attributed to SE outbreaks suggest that the sources of SE illnesses may have become more diverse during this time, possibly increasing the difficulty of implicating a single food or ingredient during outbreak investigations and contributing to the increasing incidence of SE.
In the early 2000s, as SE outbreaks attributed to egg-containing foods declined, the number and proportion of outbreaks attributed to chicken-containing foods increased slightly. An increasing role of chicken as a source of SE outbreaks during this time is supported by data from the USDA Food Safety and Inspection Service (FSIS) that demonstrated a significant increase in the percentage of broiler chicken rinseates that yielded SE between 2000 and 2005, from 0·2% in 2000 to 1·5% in 2005 [Reference Altekruse27]. In addition, a summary of findings from the USDA Economic Research Service food availability data system indicated annual chicken consumption increased from 54 pounds per capita in 2000 to 56 pounds in 2009, with peak consumption in 2006 (61 pounds) [28, 29]. As consumption of chicken increased, the incidence of sporadic SE infections (not outbreak associated) in the United States also increased [Reference Chai16]. Although we did not detect a significant change in the rate or proportion of outbreaks attributed to chicken-containing foods, this may be because relative to eggs, a smaller number of foods contain chicken as an ingredient, and fewer servings can be contaminated by a single chicken, resulting in a relatively lower probability that chicken will cause detectable outbreaks. The role of chicken as a frequent cause of SE infection is supported by a case-control study that found consumption of chicken outside the home was associated with a slightly higher risk of infection than consumption of eggs inside the home [Reference Marcus30].
Outbreak data have several limitations beyond those mentioned above. First, nearly half of the reported outbreak investigations did not implicate a specific food and so could not be included in this analysis. It is possible that numerous SE outbreaks with no implicated food reported were caused by contaminated eggs or chicken. On the other hand, enhanced efforts to detect and report SE outbreaks and trace them back to an egg source using advanced molecular characterization and isolate-based surveillance in PulseNet during the 1990s and early 2000s may have contributed to disproportionately higher numbers of outbreaks attributed to egg-containing foods being reported during this time. Improved outbreak detection resulting from PulseNet surveillance likely contributed to the slight increase in the number of reported outbreaks in 1998 [Reference Hedberg and Besser31], and this enhanced surveillance strengthens our conclusion that the trend in SE outbreaks attributed to egg-containing foods was truly declining after 1997. Finally, the contaminated ingredient in complex foods containing eggs or chicken may have been an ingredient other than egg or chicken.
Our study results are similar to those of other countries demonstrating the importance of eggs in the epidemiology of SE infections [Reference Lane32–Reference De Knegt, Pires and Hald35] and the effect of interventions targeting eggs [Reference Cogan and Humphrey36, Reference Korsgaard37]. However, SE infection from eggs, chicken, and other sources continues to threaten public health in the United States. In 2010, an egg-associated multistate outbreak of SE infections associated with on-farm failures in Salmonella control in a single poultry complex caused more than 1800 laboratory-confirmed illnesses and resulted in the recall of more than half a billion shell eggs [38]. The continuing occurrence of outbreaks such as this one suggests that additional measures to control SE in egg-laying flocks may be helpful to prevent illnesses. On 9 July 2010, FDA implemented the Egg Safety Final Rule [8], requiring producers who maintain more than 50 000 egg-laying hens to routinely test flocks for SE and to take other prevention measures, such as refrigerating eggs on the farm. Interventions aimed to reduce SE contamination in other reservoirs, such as chicken, are also needed. Beginning in 2011, USDA FSIS reduced the allowable limit for Salmonella on whole broiler chickens from 20% positive to 7·5% of samples; in 2013, only 4·2% of samples yielded Salmonella [39, 40]. However, most chicken available at retail is chicken parts [29]; USDA FSIS has estimated a 26% prevalence of Salmonella in a survey of pooled samples of different types of chicken parts and plans to develop performance standards for poultry parts [41, 42]. As these control measures are implemented, more sensitive methods than measuring changes in human SE infection incidence and foodborne disease outbreak rates are needed to assess their impact on foodborne illness; our power to detect changes is significantly reduced as interventions successfully decrease the number of reported outbreaks. Consequently, mathematical models that estimate the proportion of total SE illnesses in the population attributed to specific food sources are needed to explain observed trends and determine changes in sources of illness over time.
ACKNOWLEDGEMENTS
The authors thank Karen Herman, Mike Hoekstra, and Patricia Griffin for their assistance and guidance in the management and interpretation of the data.
DECLARATION OF INTEREST
None.


