


Women constitute about 50 % of the total population in India and comprise one-third of the labour force. About 70 % of India’s population is residing in rural India( 1 ). Women in the reproductive age group (15–49 years) are the most vulnerable as they are at higher risk of undernutrition, anaemia and ill health and these are exacerbated by childbearing and hard physical labour( 2 ). A study by Rao et al.( Reference Mallikharjuna Rao, Balakrishna and Arlappa 3 ) revealed inadequate dietary intakes during pregnancy and lactation among women in India. The National Nutrition Monitoring Bureau (NNMB) survey in 2003 reported a high prevalence of anaemia among pregnant and lactating women in India( 4 ). The nutritional status of a woman before and during pregnancy is important for a healthy pregnancy outcome, as the nutritional status of the offspring mostly depends on nutritional status of the mother. Women with poor health and improper nutrition are more likely give birth to a low-birth-weight child( Reference Kramer 5 ). Finally, a woman’s health affects the household’s economic well-being, as a woman with poor health will be less productive in the labour force( Reference Velkoff and Adlakha 6 ).
Consequences of undernutrition are well known. Undernutrition during intra-uterine and early childhood periods leads to the development of chronic degenerative diseases such as hypertension, diabetes and CVD in later life among the offspring( Reference Barker, Winter and Osmond 7 ).
With changes in lifestyles and food habits even among rural populations, overweight and obesity is rapidly becoming a major public health problem in many parts of the developing world, including India. Recent studies have also reported increasing prevalence of overweight/obesity in India, which may be due to mechanization of field work, decreased physical activity, high intakes of fat and energy-dense foods, and sedentary lifestyles( 8 , Reference Popkin 9 ). The high prevalence of overweight/obesity is an important risk factor for several non-communicable diseases including CVD.
India is undergoing a demographic, food and socio-economic transition, but malnutrition (undernutrition as well as overnutrition, i.e. the double burden of disease) continues to be an important health problem among the Indian population.
The NNMB has been carrying out surveys since 1972 in the states of Kerala, Tamil Nadu, Karnataka, Andhra Pradesh, Maharashtra, Gujarat, Madhya Pradesh, Orissa, West Bengal and Uttar Pradesh, covering about 70 % of the total population in India. The NNMB since its inception has been carrying out surveys regularly on diet and nutritional status of the population in rural as well as tribal areas, and repeat surveys every 8–10 years. The NNMB covers almost all regions in India except north-eastern states. The survey includes Kerala, Karnataka, Tamil Nadu and Andhra Pradesh from the southern region; West Bengal and Orissa from the eastern region; Uttar Pradesh from the northern region; Maharashtra and Gujarat from the western region; and Madhya Pradesh from the central region( 10 ). These regions are distinct in their language, culture, food and living habits. Southern states such as Kerala, Tamil Nadu and Karnataka are more developed states in India, with high literacy and low mortality rates, while central and eastern regions are the least developed with high rates of illiteracy and mortality. Maharashtra and Gujarat from the western region are also in the stage of development with high literacy and declining mortality.
A baseline survey was carried out during 1975–79 covering 918 villages from seven states( 11 ); the first repeat survey during 1988–90, covering 882 villages in eight states( 12 ); the second repeat survey during 1996–97, covering 713 villages from seven states( 13 ); and the third repeat survey was carried out in 2011–12, covering 1200 villages in ten states among the rural population in India. The objective of the present paper is to assess trends in nutritional status and nutrient intakes among rural, non-pregnant and non-lactating women aged ≥18–60 years over the period and to test associations of sociodemographic characteristics with overweight/obesity from the current survey (2011–12). Data for the first repeat survey (1988–90) are not available for comparison, hence not included in trend analysis.
Methods
Study design and setting
All of the studies were community-based cross-sectional studies carried out by adopting a multistage random sampling procedure in ten states of India (Andhra Pradesh, Karnataka, Kerala, Gujarat, Maharashtra, Madhya Pradesh, Orissa, Tamil Nadu, Uttar Pradesh and West Bengal). However, trends in nutritional status and nutrient intakes are available for seven states except Madhya Pradesh, Uttar Pradesh and West Bengal. In these surveys, villages form the primary sampling units, while households form the secondary sampling units.
Selection of villages
For the current survey (2011–12), a total of 120 villages were covered from each NNMB state. Of these, 75 % of the villages were selected from those covered in the baseline (1975–79)( 11 ), first repeat (1988–90)( 12 ) and second repeat surveys (1996–97)( 13 ) and the remaining thirty villages were randomly selected afresh from the list of villages obtained from the census of India 2001( 1 ). The same procedure was adopted during previous surveys for selection of 120 villages. During 1975–79, a total of ninety villages were covered.
Selection of households and participants
A total of twenty households were covered in each selected village. For this purpose, the village was divided into five natural geographical areas based on streets/mohallas, etc., of which households belonging to the scheduled caste (SC) and scheduled tribes (ST) communities formed one group. The first household was selected randomly in each area and four consecutive households were covered, thus a total of twenty households were covered in each village. During 1975–79, a total of 18 360 households, in 1996–97, 14 260 households and in 2011–12, 24 000 households were covered. A total of 15 614 and 2386 non-pregnant and non-lactating women aged ≥18–60 years were covered for anthropometry and the diet survey, respectively, during 1975–79; while the corresponding numbers were 12 376 and 2952 during 1996–97. For the current survey (2011–12), 23 233 non-pregnant and non-lactating women were covered for anthropometric measurements out of 25 100 enumerated, with a response rate of 93 %, and 13 373 women were covered for diet surveys. All non-pregnant and non-lactating women aged ≥18–60 years were included in the analysis.
Data collection
Information was collected by a team of four trained investigators on socio-economic and demographic particulars, such as age, sex, occupation, annual family income, family size, type of family, literacy status, possession of agricultural land, etc. from the participant; and anthropometric measurements such as height, weight and waist circumference were carried out on all women available at the time of survey using standard equipment and procedures( Reference Jelliffee and Jelliffee 14 , 15 ). A one-day 24 h recall method of diet survey was carried out on a sub-sample of households covered for anthropometry to assess the food and nutrient intakes of the women( Reference Thimmayamma and Rao 16 ). In this method the housewife, or the member of the household who cooks the food, was asked about the types of food prepared for breakfast, lunch, evening tea and dinner during the previous day. An account of the raw ingredients actually used in the household for each food preparation was obtained and weighed using a Grocer’s weighing balance (manufactured in Hyderabad, India) with standard weights. The mean daily household consumption of various foods was expressed in grams per consumption unit (g/CU), which is defined as the energy requirement for a reference man, aged 20–29 years, weight 60 kg and free from any disease or illness. Food composition tables providing information on quantities of different nutrients per 100 g of edible portion of food were used for the calculation of individual nutrient intakes( Reference Gopalan, Rama Sastri and Balasubrsmanian 17 ).
Definitions and checks
A ‘pucca’ house is one which has walls made of cement and bricks or stones and with a reinforced concrete roof, while a ‘semi pucca’ house is one that has brick or stone walls and a tiled or asbestos roof. A ‘kutcha’ house means mud or thatched walls and thatched or tiled/asbestos roof.
All investigators, i.e. medical officers, nutritionists, social workers and technicians, of the ten NNMB states were re-oriented and standardized at the National Institute of Nutrition, Hyderabad before initiation of the survey in all techniques of the investigations and anthropometric measurements. To ensure the quality of data collected by the investigators on anthropometry and clinical examination, surprise checks were carried out on a sub-sample of women in the field by the staff of the Central Research Laboratory.
Statistical analysis
Data analysis was done using the statistical software package IBM SPSS Statistics for Windows version 17·0. Data scrutiny and consistency checks were carried out before entering data into the computer. Significance was tested at P<0·05. Mean and standard deviation, median and interquartile range for daily intakes of foodstuffs and nutrients were calculated using a computer program. Mean intakes of foodstuffs were compared with recommended dietary intakes (RDI)( 18 ) and median intakes of nutrients were compared with the RDA for Indians recommended by the Indian Council of Medical Research( 19 ). Nutritional status over the period was tested using χ 2 trends. Median intakes of nutrients over the period were assessed by a non-parametric test such as the Kruskal–Wallis test, because the data followed a skewed distribution. States-wise prevalence of undernutrition was tested using a complex sample procedure considering age as weightage. Associations between explanatory variables such as age, religion, community, type of house, education, etc. and dependent variables such as chronic energy deficiency (CED), overweight/obesity and abdominal obesity were tested using a complex sample procedure that included all sample design, stratification, clusters and weights. Associations were tested only for recent data (2011–12) as they were mostly similar for all surveys.
BMI was calculated as [weight (kg)]/[height (m)]2. Individuals with BMI<18·5 kg/m2 were categorized as ‘CED’, those with BMI=18·5–22·99 kg/m2 as ‘normal’, those with BMI=23·0–27·49 kg/m2 as ‘overweight’ and individuals with BMI ≥27·50 kg/m2 were categorized as ‘obese’( 20 ). Women with waist circumference ≥80 cm were considered to have abdominal obesity( 21 ).
Results
Trends in nutrient intakes and nutritional status of rural, non-pregnant and non-lactating women aged ≥18–60 years
There was a significant (P<0·01) decline in the prevalence of CED from 52 % during 1975–79 to 34 % in 2010–12, while the prevalence of overweight/obesity (BMI≥23·0 kg/m2) increased from 7 % to 24 % during the same period (Fig. 1). Median intakes of all nutrients increased among the women over the period except for energy, Ca and Fe. The intake of total fat increased from 19·7 g/d in 1975–79 to 25·2 g/d during 2011–12. There were significant (P<0·05) differences in the intakes of all nutrients, except riboflavin, over the period (Table 1, Fig. 2).
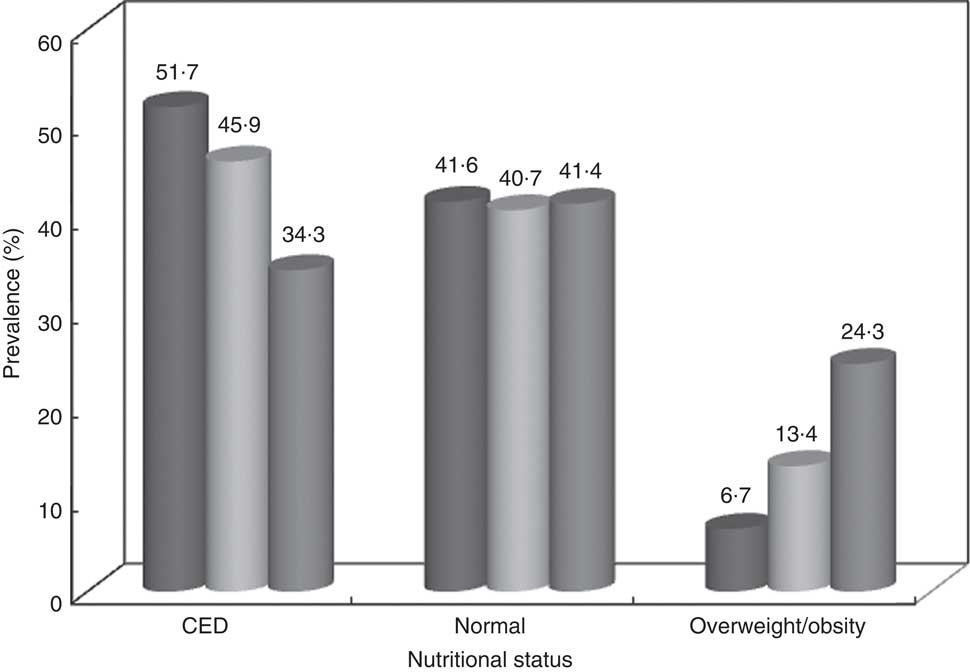
Fig. 1 Trends in the nutritional status of rural, non-pregnant and non-lactating women aged ≥18–60 years (CED, chronic energy deficiency). Data from community-based cross-sectional studies carried out by the National Nutrition Monitoring Bureau (NNMB) in ten Indian states in 1975–79 ((![]() ), 1996–97 ((
), 1996–97 ((![]() ) and 2011–12 ((
) and 2011–12 ((![]() )
)
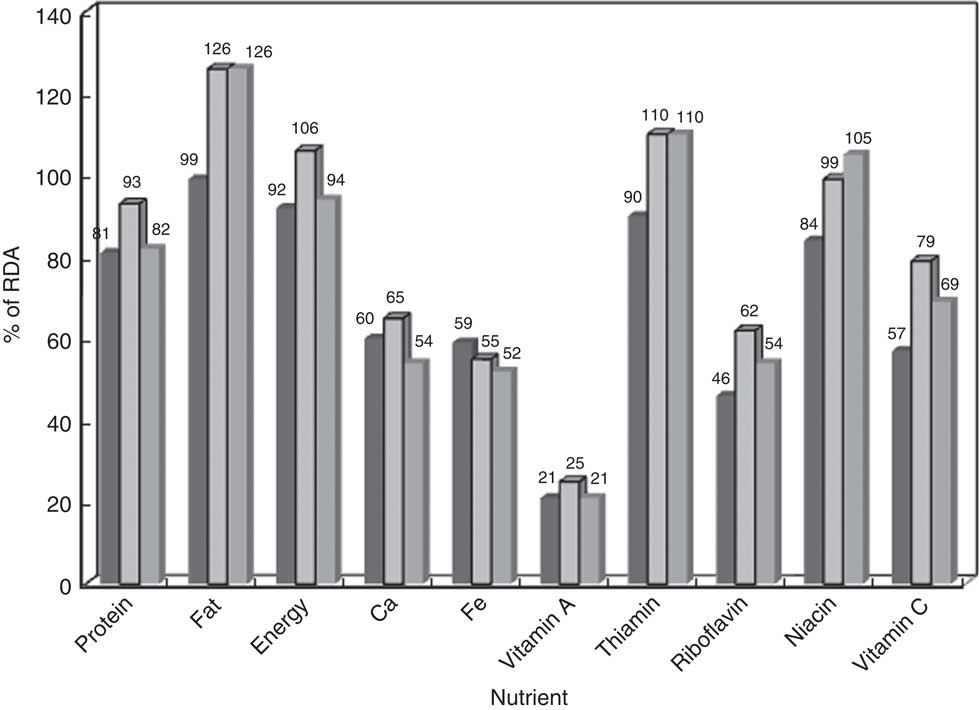
Fig. 2 Trends in nutrient intakes as a percentage of the RDA(
19
) among rural, non-pregnant and non-lactating women aged ≥18–60 years. Data from community-based cross-sectional studies carried out by the National Nutrition Monitoring Bureau (NNMB) in ten Indian states in 1975–79 ((![]() ), 1996–97 ((
), 1996–97 ((![]() ) and 2011–12 ((
) and 2011–12 ((![]() )
)
Table 1 Trends in median daily nutrient intakes among rural, non-pregnant and non-lactating women aged ≥18–60 years from 1975–79 to 2011–12. Data from community-based cross-sectional studies carried out by the National Nutrition Monitoring Bureau (NNMB) in seven Indian states
a,b,cMean values within a column with unlike superscript letters were significantly different (P<0·05).
Food and nutrient intakes among rural, non-pregnant and non-lactating women aged ≥18–60 years: 2011–12 survey
Mean daily intakes of most of the foodstuffs, except roots and tubers, were below recommended levels. The intakes were grossly inadequate for green leafy vegetables (17·2 g/CU v. RDI of 50 g) and milk and milk products (84·5 ml/CU v. RDI of 150 ml).
Median intakes of most of the nutrients except fat, thiamin and niacin were below recommended levels (RDA). The median energy intake was 7318 kJ/d (1749 kcal/d) v. RDA of 7950 kJ (1900 kcal/d); protein intake was 45·9 g/d v. RDA of 55 g; while fat intake was 23·8 g/d, which is higher than the RDA of 20 g. The intakes were grossly deficient for Ca, Fe, vitamin A and folic acid (47–80 % deficit; Table 2).
Table 2 Daily intakes of foodstuffs and nutrients among rural, non-pregnant and non-lactating women aged ≥18–60 years. Data from a community-based cross-sectional study carried out by the National Nutrition Monitoring Bureau (NNMB) in ten Indian states, 2011–12 (n 13 373)
CU, consumption unit; RDI, recommended dietary intake; IQR, interquartile range.
Nutritional status of rural, non-pregnant and non-lactating women aged ≥18–60 years: 2011–12 survey, overall and states-wise
The overall prevalence of CED was 32·5 %, while that of overweight/obesity was 26·4 % among rural non-pregnant and non-lactating women. The prevalence of CED was higher in the states of Gujarat (41·8 %) and Orissa (41·5 %), and was lowest in Kerala (14·7 %). On the other hand, the prevalence of overweight/obesity was higher in Kerala (51·5 %) and lower in Madhya Pradesh (14·4 %) and Orissa (16·4 %; Fig. 3). The prevalence of abdominal obesity was 24·4 %.
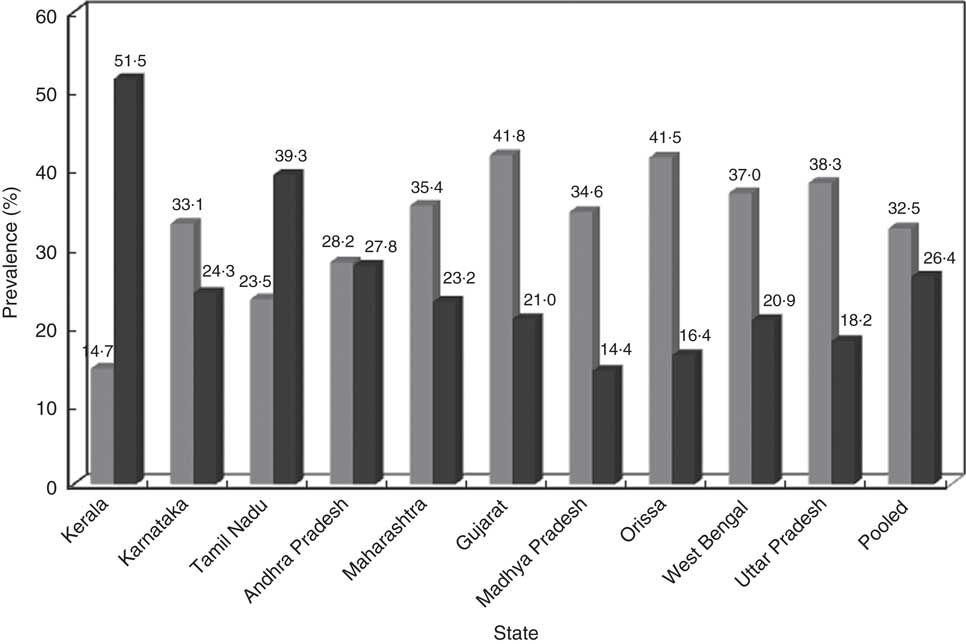
Fig. 3 States-wise distribution of nutritional status ((![]() , chronic energy deficiency; (
, chronic energy deficiency; (![]() , overweight/obesity) of rural, non-pregnant and non-lactating women aged ≥18–60 years. Data from a community-based cross-sectional study carried out by the National Nutrition Monitoring Bureau (NNMB) in ten Indian states, 2011–12
, overweight/obesity) of rural, non-pregnant and non-lactating women aged ≥18–60 years. Data from a community-based cross-sectional study carried out by the National Nutrition Monitoring Bureau (NNMB) in ten Indian states, 2011–12
Association of sociodemographic characteristics with chronic energy deficiency, overweight/obesity and abdominal obesity: 2011–12 survey
The prevalence of CED was significantly (P<0·01) higher (36·8 %) among younger women (18–39 years), women belonging to other religions (38·4 %), among women belonging to ST communities (47·5 %), women living in kutcha houses (39·3 %), households with family size of ≥8 members (34·3 %), among illiterate women (38·8 %), those engaged in occupations such as labour (38·1 %), those belonging to the lower socio-economic group (42·7 %) and among women belonging to landless households (31·6 %). In contrast, the prevalence of overweight/obesity (BMI≥23·0 kg/m2) was higher (30·9 %) among middle-aged women (40–60 years), Christians (48·5 %), women belonging to forward communities (34·5 %), women living in pucca houses (40·1 %), households with a family size of 1–4 members (28·8 %), among literate women (37·4 %), those engaged in service and business (36·7 %), among women belonging to the higher socio-economic group (38·9 %) and among those possessing 2·02 ha (>5 acres) of land (32·3 %; Table 3).
Table 3 Associations of CED, overweight/obesity and abdominal obesity with sociodemographic characteristics among rural, non-pregnant and non-lactating women aged ≥18–60 years. Data from a community-based cross-sectional study carried out by the National Nutrition Monitoring Bureau (NNMB) in ten Indian states, 2011–12
CED, chronic energy deficiency; SC, scheduled caste; ST, scheduled tribe; OBC, other backward caste.
† Asian cut-off; χ 2 was calculated for CED v. overweight/obesity.
‡ 1 acre=0·40 ha.
Similarly, the prevalence of abdominal obesity (waist circumference ≥80·0 cm) was higher among middle-aged women (30·7 %), among Christians (47·6 %), women belonging to forward communities (26·8 %), women living in pucca houses (36·6 %), households with family size of 1–4 members (27·3 %), among literate women (33·2 %), women engaged in service and business (32·2 %), women belonging to the higher socio-economic group (35·6 %) and among women belonging to landless households (25·7 %; Table 3).
Multiple logistic regression analyses of association between sociodemographic characteristics and overweight/obesity and abdominal obesity: 2011–12 survey
To identify important risk factors associated with overweight/obesity and abdominal obesity, multiple logistic regression analysis was carried out with sociodemographic characteristics such as age, religion, community, type of house, education, occupation, income and land holdings as independent variables and overweight/obesity and abdominal obesity as dependent variables. It was observed that the chance of overweight/obesity was almost two times higher among 40–60-year-old women (OR=1·93; 95 % CI 1·80, 2·08) as compared with 18–39-year-old women and those belonging to Christian religion (OR=1·82; 95 % CI 1·32, 2·54) as compared with women belonging to other religions. The chance of overweight/obesity was almost two times higher among women belonging to forward communities (OR=1·92; 95 % CI 1·67, 2·22) and women belonging to other backward communities (OR=1·77; 95 % CI 1·54, 2·03) as compared with women belonging to ST communities; and women living in pucca houses had almost double the chance (OR=2·03; 95 % CI 1·81, 2·28) of overweight/obesity as women living in kutcha houses. The chance of overweight/obesity was 1·6–2·0 times higher among literate as compared with illiterate women and 1·5 times higher among women engaged in service and business (OR=1·54; 95 % CI 1·30, 1·81) and housewives (OR=1·52; 95 % CI 1·39, 1·66) as compared with women whose occupation was labour. The chance of overweight/obesity was two times higher among women with higher per capita income (OR=2·02; 95 % CI 1·83, 2·22) compared with their low-income counterparts. Possession of <2·02 ha (<5 acres) of land was observed to be associated with a lower chance of overweight/obesity (Table 4).
Table 4 Multiple logistic regression analysis of the associations of overweight/obesity and abdominal obesity with sociodemographic characteristics among rural, non-pregnant and non-lactating women aged ≥18–60 years. Data from a community-based cross-sectional study carried out by the National Nutrition Monitoring Bureau (NNMB) in ten Indian states, 2011–12
SC, scheduled caste; ST, scheduled tribe; OBC, other backward caste; Ref., referent category.
*P<0·05, **P<0·01, ***P<0·001.
† Asian cut-off.
‡ 1 acre=0·40 ha.
Similarly, the chance of abdominal obesity was 2·5 times higher among 40–60-year-old (OR=2·53; 9 5% CI 2·39, 2·78) as compared with 18–39-year-olds and among women belonging to the Christian religion (OR=2·68; 95 % CI 1·87, 3·83) as compared with women of other religions; and 1·7 times higher among women belonging to forward communities (OR=1·67; CI 95 % 1·45, 1·92) as compared with women belonging to ST communities. The chance of abdominal obesity was 1·6 times higher among women living in pucca houses (OR=1·62; 95 % CI 1·45, 1·82), 2·0 times higher among literate women (OR=2·00; 95 % CI 1·80, 2·21), and more than 1·3 times higher among women engaged in service and business (OR=1·43; 95 % CI 1·31, 1·57) and among housewives (OR=1·33; 95 % CI 1·12, 1·57), compared with their respective counterparts. The chance of abdominal obesity was almost two times higher among women with higher per capita income (OR=1·91; 95 % CI 1·73, 2·11). Not possessing land or having <2·02 ha (<5 acres) of land was observed to be associated with a lower chance of abdominal obesity (Table 4).
Discussion
Adequate nutrition is a prerequisite for attaining optimal health, quality of life and national productivity. Adequate and proper nutrition can be achieved only through the availability, accessibility and affordability to all the people all the time of food which is safe and hygienic( Reference Thompson, Cohen and Meerman 22 – Reference Ruel and Alderman 24 ).
The present study reported a decline in the prevalence of CED from 52 % to 34 %, while overweight/obesity has increased from 7 % to 24 %, during 1975 to 2012. The prevalence of CED was higher in the states of Gujarat, Uttar Pradesh, West Bengal and Orissa, and was lowest in Kerala. On the other hand, the prevalence of overweight/obesity was higher in Kerala and low in Madhya Pradesh and Orissa. It was also observed that the median intakes of all nutrients except vitamin C, thiamin, niacin and fat were below the recommended levels, although nutrient intakes have increased over the period. Micronutrients such as Fe, Ca, vitamin A and vitamin C were below the RDA.
India is passing through a transition in lifestyle, food and socio-economic status, which is witnessed by increased food production, increased purchasing power and increased mechanization of work even in rural areas, resulting in sedentary work. All of these factors contributed to the decline in the prevalence of undernutrition and the increase in overweight and obesity among the population( Reference Yadav and Krishnan 25 ). The increase in the prevalence of overweight/obesity over the period may be attributed to the decrease in physical activity, increased intakes of fats and oils and other income-elastic foods, and the sedentary nature of work. Also, the societal constructs that determine the cultural perception towards weight and body image may be different from those in the West; thus, weight gain could be perceived as a sign of prosperity as opposed to the stigma that exists in some developed societies( Reference Prentice 26 ). The increase in prevalence of overweight/obesity is associated with high risks of hypertension, diabetes and CVD among the population in India.
The National Sample Survey Organisation( 27 ) in its 61st round reported declines in nutrient intakes over the period, while intake of fat has increased, which is similar to the present study.
Balarajan and Villamor (2009)( Reference Balarajan and Villamor 28 ) reported a decline in the prevalence of CED among women (aged 15–45 years), with increased overweight/obesity over the period, in India. Villamor et al. (2004)( Reference Villamor, Msamanga and Urassa 29 ) also reported a twofold increase in the prevalence of obesity during a 9-year period among women from urban Tanzania.
The National Family Health Survey (NFHS-3) in 2005–06 reported 41 % and 14 % prevalence of CED and overweight/obesity (WHO criteria, BMI≥25·0 kg/m2), respectively, among 15–49-year-old rural women( 30 ); while another study from Bangladesh reported 30 % prevalence of CED among women( 31 ), which is similar to our study.
Bindhu et al. (2014)( Reference Bindhu, RPVB and Beevi 32 ) reported 68 % and 51 % prevalence of overweight/obesity and abdominal obesity, respectively, among rural women in Kerala which is similar to the present study.
High prevalence of overweight/obesity among women from Kerala, southern India, may be attributed to high literacy (90·9 %), low mortality, along with high consumption of fats and oils. Physical inactivity and sedentary lifestyle among both sexes is very common in India. Moreover, physical activity is mostly related to occupation in rural areas, with hardly any reported leisure-time activity( Reference Jose, Manojan and Augustine 33 ).
Higher prevalence of undernutrition among women from eastern and central regions may be attributed to the higher rates of illiteracy and socio-economic backwardness in these regions.
Deficiencies of micronutrients such as Fe are the important reason for the high prevalence of anaemia among rural women in India. A study carried out by Khader et al. (2006) in coastal areas of southern states reported a similar finding among fisherwomen( Reference Khader, Kumar and Lakshmi 34 ).
The present study observed significant associations between sociodemographic characteristics and overweight/obesity and abdominal obesity. Similar findings were also reported by Balrajan and Villamor( Reference Balarajan and Villamor 28 ) and Subramanian et al.( Reference Subramanian, Kawachi and Smith 35 ).
Relevance of the study findings are that India is passing through a sociodemographic, lifestyle and dietary transition which is reflected by the double burden of disease (undernutrition as well as overweight/obesity). Increased prevalence of overweight/obesity among the population may be the important reason for the increased burden of chronic non-communicable diseases such as hypertension, diabetes and cancer in India, as reported by recent studies.
Study strengths and limitations
The strength of the present study lies in its large sample size and being carried out by staff trained in the study methodology and standardized in different parameters at one time by the same scientists. A 24 h diet recall was carried out by measuring all the available raw ingredients consumed during the previous day.
Regarding study limitations, the 24 h recall diet survey carried out in the present study is not considered to be representative of habitual diet at an individual level and also not able to capture data on the consumption of food outside the home by individuals. Also in the 24 h diet survey, individuals may not report their food consumption accurately for various reasons related to knowledge, memory and the interview situation. However, in rural areas, diet is mostly similar on most of days of the week as was observed in our previous studies.
Conclusion
In conclusion, the double burden of disease still exists among rural Indian women. The increase in overweight/obesity may be attributed to increased consumption of fat, increased sedentary lifestyle and improved socio-economic status. There is a need to educate the population about the importance of regular physical activity and a healthy diet, along with universal women’s education, preferential treatment for minority groups, redistribution of resources (through welfare systems or cash transfers) and microcredit for women( 36 ).
Acknowledgements
Acknowledgements: The authors acknowledge the financial support by the Indian Council of Medical Research (ICMR), New Delhi. They are also thankful to their Director, Dr Sesikeran, for his valuable support and guidance during the survey. The authors thank all Central Research Laboratory staff for scrutiny of data; Mr R. Raghunadh Babu (technician) and Ms G. Madhavi, Ms Sarala and Ms Sarita (data entry operators) for their help; all field staff in the ten states and NNMB units; and also the participants for their involvement in the study. Financial support: The study was funded by ICMR, New Delhi. The ICMR, New Delhi had no role in the design, analysis or writing of this article. Conflict of interests: None. Authorship: All authors were involved in study design and protocol development. I.I.M. drafted the manuscript and all other authors critically reviewed it. N.B. and G.M. analysed the data. A.L. gave final approval to publish the manuscript. Ethics of human subject participation: The study was approved by the Institutional Ethical Committee and also by the Scientific Advisory Committee of the National Institute of Nutrition.


