


Traditionally, nutrition research has been focused on the detailed examination of the role of single nutrients and dietary components. However, the effects of individual foods and nutrients on health are difficult to estimate as they can be small( Reference Kant 1 ). Moreover, nutrients and foods are consumed in combination and their combined effects may be interactive or synergistic( Reference Hu, Rimm and Stampfer 2 ). Therefore, nutritional research has expanded to consider the overall diet in addition to individual nutrients and foods.
Traditional dietary cultures and patterns of the Japanese have long been of interest worldwide because of, for example, the low prevalence of CHD and the long-life expectancy in Japan( Reference Nakaji, MacAuley and O'Neill 3 – Reference Yoshinaga and Une 5 ). The Japanese dietary pattern has several characteristics seldom observed in those of Western populations, including high intakes of rice, soyabean products, fish, seaweeds and green tea, and low intakes of animal fat and soft drinks( 6 ), and typically lower energy density( Reference Murakami, Sasaki and Takahashi 7 ). The Japanese Food Guide Spinning Top (Fig. 1) was developed in 2005 by the Japanese Ministry of Health, Labour and Welfare and the Ministry of Agriculture, Forestry and Fisheries, based on the food-based Dietary Guidelines for Japanese, which was formulated in 2000 by the former Ministry of Education, the former Ministry of Health and Welfare, and the Ministry of Agriculture, Forestry and Fisheries( Reference Yoshiike, Hayashi and Takemi 8 ). The aim of the Japanese Food Guide Spinning Top is to provide recommendations on food selection and quantities for a healthful diet that can be easily adopted by the Japanese public, while taking account of the typical style of Japanese meal (e.g. a combination of rice, miso soup, a main dish, and side dishes)( Reference Yoshiike, Hayashi and Takemi 8 ). As the guide presents a quantitative reference for the daily diet in a simple, straightforward fashion, it may also be easily put into practice in daily life, attract people with little interest in diet, and be easily utilised by the food industry( Reference Yoshiike, Hayashi and Takemi 8 ). Although the guide was developed to promote the consumption of healthful diets for Japanese people, the nutritional and health benefits of following this guide are largely unknown( Reference Oba, Nagata and Nakamura 9 ). While in a prospective study, higher adherence to the food-based Japanese dietary guidelines was associated with lower future mortality in middle-aged women (but not in men)( Reference Oba, Nagata and Nakamura 9 ), associations with metabolic risk factors have not been examined. Also, evidence in younger populations is lacking. Therefore, the aim of the present cross-sectional study was to examine whether higher adherence to the food-based Japanese dietary guidelines is associated with favourable profiles of metabolic risk factors in a group of young Japanese women.
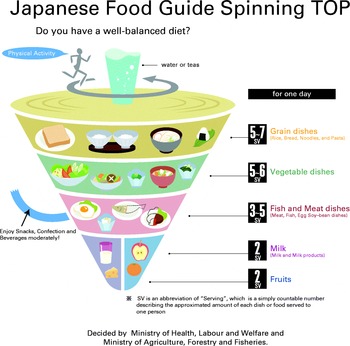
Fig. 1 Graphical presentation of the Japanese Food Guide Spinning Top developed by the Japanese Ministry of Health, Labour and Welfare and the Ministry of Agriculture, Forestry and Fisheries (available online at http://www.mhlw.go.jp/bunya/kenkou/pdf/eiyou-syokuji5.pdf). (A colour version of this figure can be found online at http://www.journals.cambridge.org/bjn).
Subjects and methods
Study population
The present cross-sectional study was based on a survey conducted from February to March 2006 and from January to March 2007 among female dietetic students from fifteen higher education institutions in Japan. Details of the study design and survey procedure have been described elsewhere( Reference Murakami, Sasaki and Takahashi 7 , Reference Murakami, Sasaki and Takahashi 10 ). In total, 1176 Japanese women took part (response rate 56 %). For analysis, women aged 18–22 years were selected (n 1154). We then excluded women not completing the survey questionnaires (n 1), those with extremely low or high reported energy intakes ( < 2092 or >16 736 kJ/d, n 3), those currently receiving dietary counselling from a doctor or dietitian (n 13), those with previously diagnosed diabetes, hypertension or CVD (n 1), and those with missing information on the variables of interest (n 53). The final sample size was 1083.
The present study was conducted according to the guidelines laid down in the Declaration of Helsinki, and all procedures involving human subjects were approved by the ethics committee of the National Institute of Health and Nutrition, Japan. Written informed consent was obtained from each subject and also from a parent/guardian for subjects < 20 years old.
Dietary assessment
Dietary habits during the preceding month were self-reported using a comprehensive self-administered diet history questionnaire (DHQ)( Reference Sasaki, Yanagibori and Amano 11 – Reference Kobayashi, Murakami and Sasaki 13 ). Responses to the DHQ, as well as to a lifestyle questionnaire, were checked at least twice for completeness. When necessary, forms were reviewed with the subject to ensure the clarity of answers. Details of the DHQ's structure, calculation method of dietary intake, and relative validity for commonly studied nutritional factors have been published elsewhere( Reference Sasaki, Yanagibori and Amano 11 – Reference Kobayashi, Murakami and Sasaki 13 ). Briefly, the DHQ is a structured sixteen-page questionnaire that asks about the consumption frequency and portion size of selected foods commonly consumed in Japan, as well as general dietary behaviour and usual cooking methods. Estimates of daily intake for foods (150 items in total), energy and selected nutrients were calculated using a custom-designed computer algorithm for the DHQ based on the Standard Tables of Food Composition in Japan( 14 ). Dietary energy density was calculated by dividing energy intake (kJ/d) by weight of foods consumed (g/d), based on foods only (excluding all beverages)( Reference Murakami, Sasaki and Takahashi 7 ). To minimise the influence of dietary misreporting( Reference Livingstone and Black 15 , Reference Murakami, Sasaki and Uenishi 16 ), energy-adjusted values of dietary variables (except for energy density) were calculated based on the density method (i.e. percentage of energy for energy-providing nutrients and amount per 4184 kJ of energy for other nutrients and foods). Categorisation of food groups has been published elsewhere( Reference Kobayashi, Murakami and Sasaki 13 ).
Calculation of the score on adherence to the food-based Japanese dietary guidelines for a healthy diet
Using a procedure developed by Oba et al. ( Reference Oba, Nagata and Nakamura 9 ), which was based on the Japanese Food Guide Spinning Top( Reference Yoshiike, Hayashi and Takemi 8 ), we calculated a score for adherence to the food-based Japanese dietary guidelines. In this procedure, the following six categories were considered, each of which had the recommended number of servings or of energy, depending on sex, age and physical activity (we assumed low level of physical activity for all women because of the apparently predominantly sedentary lifestyle of our subjects, as described previously( Reference Murakami, Sasaki and Takahashi 7 )): grain dishes (rice, bread, noodles, etc.; recommended number for women with low level of physical activity: 4–5 servings/7531 kJ (1800 kcal)); vegetable dishes (vegetables, mushrooms, potatoes and seaweed; 5–6 servings/7531 kJ); fish and meat dishes (meat, fish, egg, soyabean, etc.; 3–4 servings/7531 kJ); milk (milk and milk products; 2 servings/7531 kJ); fruits (2 servings/7531 kJ); snacks and alcoholic beverages ( ≤ 837 kJ/7531 kJ ( ≤ 200 kcal/7531 kJ)). By definition, one serving of grain dishes provided 40 g carbohydrate; one serving of vegetable dishes was 70 g; one serving of fish and meat dishes provided 6 g protein; one serving of milk provided 100 mg Ca; and one serving of fruits was 100 g( Reference Yoshiike, Hayashi and Takemi 8 ).
Using information on intakes of foods and energy derived from the DHQ, we calculated servings of grain dishes, vegetable dishes, fish and meat dishes, milk and fruits, and energy intake from snacks and alcoholic beverages, as described in Table 1. These values were energy-adjusted using the density method to obtain the values per 7531 kJ of energy to enable comparison with the recommended values. A participant who consumed the recommended number (of servings or energy) for each of the six categories received a score of 10 for that category (see Table 1). For a participant who exceeded or fell short of the recommended number of servings or energy, the score was calculated proportionately between 0 and 10 (see Table 1). For example, if a participant consumed two of the recommended five to six servings of vegetable dishes, the score was calculated as (10 × 2/5 = 4). Likewise, if a participant consumed six servings of fish and meat dishes when the recommendation was three to four servings, the score was (10 − 10 × (6 − 4)/4 = 5). When the calculation produced a negative score because of excess servings or energy, the score was converted to 0. The six scores were then summed to provide the overall score on adherence to the food-based Japanese dietary guidelines, which ranged from 0 to 60.
Table 1 Category in the Japanese dietary guidelines for a healthy diet, food item derived from a diet history questionnaire, and scoring system
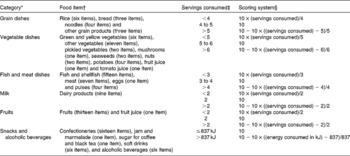
* By definition, one serving of grain dishes contained 40 g carbohydrate; one serving of vegetable dishes was 70 g; one serving of fish and meat dishes contained 6 g protein; one serving of milk contained 100 mg Ca; and one serving of fruits was 100 g.
† The following food items were not categorised and thus not used in the calculation described here: tea and coffee (three items); fats and oils (five items); seasonings (nine items); soups (four items); nutritional supplement bars (one item); artificial sweeteners (one item); drinking-water (one item).
‡ Per 7531 kJ of energy.
§ When the calculation produced a negative score because of excess servings or energy, the score was converted to 0.
Assessment of metabolic risk factors
Metabolic risk factors were measured 1–3 d after completion of the questionnaires. Detailed descriptions of the measurement of each component have been published elsewhere( Reference Murakami, Sasaki and Takahashi 7 , Reference Murakami, Sasaki and Takahashi 10 ). Briefly, body height (to the nearest 0·1 cm) and weight (to the nearest 0·1 kg) were measured while subjects were wearing lightweight indoor clothes only, without shoes. BMI (kg/m2) was calculated as weight (kg) divided by height (m) squared. Waist circumference (WC) was measured at the level of the umbilicus (to the nearest 0·1 cm) at the end of a normal respiration while the subject was standing erect and with the arms at the side and the feet together. Systolic and diastolic blood pressure was measured on the left arm with an automatic device (Omron model HEM-770A; Omron Health Care) after the subject had been sitting quietly for ≥ 3 min. A second measurement was carried out about 1 min after the first, and the mean value of the two measurements was used. A peripheral blood sample was obtained from each participant after an overnight fast. Blood was collected in evacuated tubes containing no additives, allowed to clot, and centrifuged at 3000 g for 10 min at room temperature to separate the serum. Blood samples for glycated Hb measurements were also collected in evacuated tubes containing no additives. In accordance with the survey protocol, blood samples were transported at − 20°C by car or airplane to ensure delivery to a laboratory in Tokyo, Japan (SRL, Inc. in 2006 and Mitsubishi Kagaku Bio-Clinical Laboratories, Inc. in 2007). The biochemical variables listed below were assayed at the laboratory within 1–2 d of collection to avoid significant degradation. Serum total, LDL- and HDL-cholesterol, TAG, and glucose concentrations were measured by enzymatic assay methods. Serum insulin concentration was measured by immunoradiometric assay. Glycated Hb concentration was measured by latex agglutination–turbidimetric immunoassay. In-house quality-control procedures for all assays were conducted at the respective laboratory.
Assessment of other variables
Based on the reported home address, each subject was grouped into one of three regions (north (Kanto, Hokkaido and Tohoku), central (Tokai, Hokuriku and Kinki) or south (Kyushu and Chugoku)) and into one of three municipality levels (ward (i.e. metropolitan area), city, or town and village). Current smoking (yes or no) and rate of eating (three qualitative categories of ‘slow’, ‘medium’ or ‘fast’) were also self-reported. Physical activity was computed as the average metabolic equivalents-h score per d on the basis of the self-reported frequency and duration of five different activities (sleeping, high- and moderate-intensity activities, walking and sedentary activities) over the preceding month( Reference Murakami, Sasaki and Takahashi 7 ). The ratio of reported energy intake to estimated energy expenditure was calculated to assess the extent of bias in energy intake reporting. The BMR was estimated using measured body weight according to the FAO/WHO/UNU equation for women aged 18–30 years( 17 ). Energy expenditure was then estimated as BMR multiplied by physical activity level value for light activity (1·56)( 17 ). This was due to the absence of an accurate and comprehensive measurement of physical activity level as well as the apparently predominantly sedentary lifestyle of our subjects, as described previously; in our sample, self-reported time spent on sedentary activities was predominant compared with that spent on high- and moderate-intensity activities, and walking (mean 16·46, 0·06, 0·24 and 0·44 h/d, respectively)( Reference Murakami, Sasaki and Takahashi 7 ).
Statistical analysis
All statistical analyses were performed using SAS statistical software (version 9.3; SAS Institute, Inc.). For analyses, subjects were categorised into quintiles according to their score on adherence to the food-based Japanese dietary guidelines. Using the PROC GLM procedure, multivariate-adjusted means (with their standard errors) of metabolic risk factors were calculated according to quintiles of the adherence score. We tested for linear trends with increasing levels of the adherence score by assigning each subject the median value for the category and modelling this value as a continuous variable. Potential confounding factors considered were region, municipality level, survey year, current smoking, rate of eating, physical activity, and the ratio of reported energy intake to estimated energy expenditure. We considered region and municipality level as potential confounding factors not only because of the nesting structure of the survey, but also because of the possibility of the presence of unknown confounding factors associated with residential area. We also considered survey year as a potential confounding factor because of the different laboratories with different kits used for blood analyses for the 2006 and 2007 surveys, even though there were no differences in the assay methods. BMI was added as a confounding factor in all analyses except for that for BMI itself. WC was also added as a confounding factor in the analyses except for those for BMI and WC. Because the inclusion of adiposity measures (BMI, WC or both) as confounding factors did not influence the results materially, we present the full-adjustment models only. All reported P values were two-tailed, and P< 0·05 was considered statistically significant.
Results
The basic characteristics of the subjects are summarised in Table 2. The mean values of BMI and WC were 21·4 (sd 2·7) kg/m2 and 72·9 (sd 7·1) cm, respectively. The mean value of LDL-cholesterol was 2·77 (sd 0·70) mmol/l. The mean value of the score on adherence to the food-based Japanese dietary guidelines for a healthy diet was 35·6 (sd 7·1). Servings of grain dishes (67 % of subjects), vegetable dishes (78 % of subjects), milk (64 % of subjects) and fruits (94 % of subjects) were likely to be below the recommended intakes, while servings of fish and meat dishes (67 % of subjects) and snacks and alcoholic beverages (78 % of subjects) were likely to exceed the recommended intakes. The mean value of the ratio of reported energy intake to estimated energy expenditure was 0·88 (sd 0·23).
Table 2 Basic characteristics of the study subjects (n 1083) (Mean values and standard deviations or percentages)
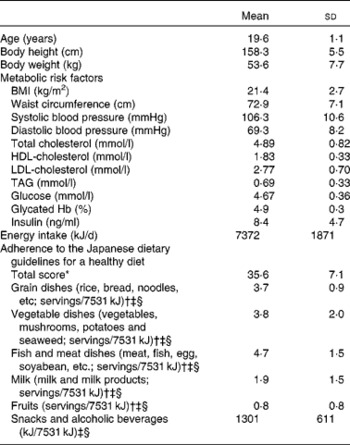
* Possible score ranging from 0 to 60.
† By definition, one serving of grain dishes contained 40 g carbohydrate; one serving of vegetable dishes was 70 g; one serving of fish and meat dishes contained 6 g protein; one serving of milk contained 100 mg Ca; and one serving of fruits was 100 g.
‡ Using information on intakes of foods and energy derived from a comprehensive self-administered diet history questionnaire, we calculated servings of grain dishes (rice (six items), bread (three items), noodles (four items) and other grain products (three items)), vegetable dishes (green and yellow vegetables (six items), other vegetables (eleven items), pickled vegetables (two items), mushrooms (one item), seaweeds (two items), nuts (two items), potatoes (four items), fruit juice (one item) and tomato juice (one item)), fish and meat dishes (fish and shellfish (fifteen items), meat (seven items), eggs (one item), pulses (four items)), milk (dairy products (nine items)), fruits (fruits (thirteen items) and fruit juice (one item)), and energy intake from snacks and alcoholic beverages (confectioneries (sixteen items), jam and marmalade (one item), sugar for coffee and black tea (one item), soft drinks (six items), and alcoholic beverages (six items)). These values were energy-adjusted using the density method to obtain the values per 7531 kJ of energy so that we can compare them with the recommended values.
§ Recommended values are as follows: grain dishes, 4–5 servings/7531 kJ; vegetable dishes, 5–6 servings/7531 kJ; fish and meat dishes, 3–4 servings/7531 kJ; milk, 2 servings/7531 kJ; fruits, 2 servings/7531 kJ; and snacks and alcoholic beverages, ≤ 837 kJ/7531 kJ.
The potential confounding variables according to quintile of the dietary adherence score are presented in Table 3. The dietary adherence score was associated with current smoking and rate of eating. The higher quintile of the dietary adherence score included more non-smokers and more slow- and medium-rate eaters. There was also an inverse association between the dietary adherence score and the ratio of reported energy intake to estimated energy expenditure.
Table 3 Selected characteristics by quintile (Q) of the score on adherence to the food-based Japanese dietary guidelines for a healthy diet (n 1083) (Percentages or mean values and standard deviations)
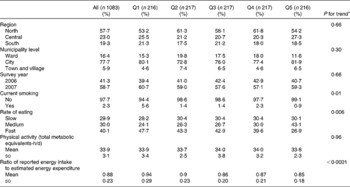
* For categorical variables, the Mantel–Haenszel χ2 test was used; for continuous variables, a linear trend test was used with the median value in each quintile category of the score on adherence to the food-based Japanese dietary guideline for a healthy diet (26·5, 31·8, 35·9, 39·5 and 44·6, respectively) as a continuous variable in linear regression.
Dietary intakes according to quintile of the score on adherence to the food-based Japanese dietary guidelines for a healthy diet are presented in Table 4. For food intake, the dietary adherence score showed positive associations with rice, vegetables, pulses and fruits, and inverse associations with bread, meat and confectioneries. For nutrient intake, the dietary adherence score was associated positively with protein, carbohydrate, dietary fibre, Na, K and vitamin C, and inversely with total and saturated fat. Additionally, a higher score on the dietary adherence was associated with the consumption of lower energy-dense diets.
Table 4 Dietary intake by quintile (Q) of the score on adherence to the food-based Japanese dietary guidelines for a healthy diet (n 1083) (Mean values and standard deviations)

* A linear trend test was used with the median value in each quintile category of the score on adherence to the food-based Japanese dietary guideline for a healthy diet (26·5, 31·8, 35·9, 39·5 and 44·6, respectively) as a continuous variable in linear regression.
Metabolic risk factors according to quintile of the score on adherence to the food-based Japanese dietary guidelines for a healthy diet are presented in Table 5. After adjustment for potential confounding factors, the dietary adherence score was inversely associated with WC. Mean values of WC for each quintile of the dietary adherence score were 73·5, 73·6, 72·7, 72·5 and 72·5 cm, respectively (P for trend = 0·002). Additionally, the dietary adherence score showed an inverse association with LDL-cholesterol concentrations. Mean values of LDL-cholesterol for each quintile of the dietary adherence score were 2·83, 2·80, 2·75, 2·76 and 2·70 mmol/l, respectively (P for trend = 0·04). There was no association with the other metabolic risk factors examined.
Table 5 Metabolic risk factors by quintile (Q) of the score on adherence to the food-based Japanese dietary guidelines for a healthy diet (n 1083) (Mean values with their standard errors)
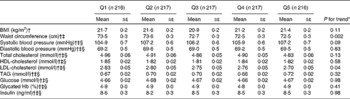
* A linear trend test was used with the median value in each quintile category of the score on adherence to the food-based Japanese dietary guideline for a healthy diet (26·5, 31·8, 35·9, 39·5, and 44·6, respectively) as a continuous variable in linear regression.
† Adjusted for region (north, central or south), municipality level (ward, city, or town and village), survey year (2006 or 2007), current smoking (yes or no), rate of eating (slow, medium or fast), physical activity (total metabolic equivalents-h/d, continuous), and ratio of reported energy intake to estimated energy expenditure (continuous).
‡ Additionally adjusted for BMI (kg/m2, continuous).
§ Additionally adjusted for waist circumference (cm, continuous).
Discussion
We found that higher adherence to the food-based Japanese dietary guidelines, which was characterised by favourable dietary intakes of foods and nutrients as well as lower energy density, was associated with lower WC and LDL-cholesterol concentrations in a group of young Japanese women. Conversely, dietary adherence was not associated with other metabolic risk factors examined, including BMI, systolic and diastolic blood pressure, total and HDL-cholesterol, TAG, glucose, glycated Hb, and insulin concentrations. To our knowledge, this is the first study to evaluate the nutritional and health effects of following the Japanese dietary guidelines in young Japanese women.
In the present study, higher adherence to the food-based Japanese dietary guidelines was associated with favourable nutrient intake patterns, such as higher intakes of micronutrients and dietary fibre, lower intakes of saturated fat, and lower energy-dense diets. Nevertheless, dietary adherence was positively associated with Na intake, although the difference between the extreme quintiles of the adherence score was small (4 %). A higher intake of Na might be due to higher intakes of vegetables, meat, fish and shellfish, and pulses, because in Japan, these foods are usually accompanied by seasonings of salty taste, such as salt, soya sauce, miso and seasonings. In a previous study in middle-aged Japanese, higher adherence to the food-based Japanese dietary guidelines was similarly associated with favourable dietary intake patterns, except for higher intakes of saturated fat and Na( Reference Oba, Nagata and Nakamura 9 ).
We found that after adjustment for potential confounding factors, higher adherence to the food-based Japanese dietary guidelines was associated with lower WC, but not BMI. Given that a prospective study in five European countries had reported that diets with lower energy density were associated with reductions in WC but not body weight( Reference Du, van der A and Ginder 18 ), we decided to adjust for dietary energy density. Following this additional adjustment, the inverse association between dietary adherence and WC was no longer statistically significant; mean values of WC for each quintile of the dietary adherence score were 73·2 (se 0·3), 73·4 (se 0·3), 72·6 (se 0·3), 72·7 (se 0·3) and 72·8 (se 0·3) cm, respectively (P for trend = 0·20). Thus, the inverse association between dietary adherence and WC that we observed may be due to the consumption of lower energy density associated with higher dietary adherence. Additionally, several previous studies have supported the favourable effects of healthy dietary patterns, including a high intake of dietary fibre( Reference Newby, Muller and Hallfrisch 19 – Reference Liese, Schulz and Fang 22 ) and a low intake of dietary fat( Reference Newby, Muller and Hallfrisch 19 , Reference Newby, Muller and Hallfrisch 20 ), on WC, which concurs with our findings. The exact mechanism involved is unknown; however, it may be due to lowering energy intake, increased satiety sensation, or reduced fat storage mainly caused by lowering dietary energy density( Reference Du, van der A and Ginder 18 , Reference Vergnaud, Estaquio and Czernichow 23 ). The inverse association observed between dietary adherence and LDL-cholesterol concentrations may be due to lower saturated fat intake associated with higher dietary adherence( Reference Mensink, Zock and Kester 24 ), given that saturated fats are recognised as the single dietary factor that has the greatest negative effect on LDL-cholesterol concentrations, decreasing LDL receptor activity, protein and mRNA abundance( Reference Fernandez and West 25 ). Health benefits of following the food-based Japanese dietary guidelines, which we found in a group of young women at least in terms of WC and LDL-cholesterol, have also been shown in a previous prospective study, where higher adherence to the guidelines was associated with lower future mortality in middle-aged women (but not in men)( Reference Oba, Nagata and Nakamura 9 ).
Several limitations of the present study should be acknowledged. First, our subjects were selected female dietetics students, not a random sample of Japanese women, producing recruitment bias. However, our population was on average comparable with a representative sample of Japanese women of similar age range (20–29 years), at least with regard to intakes of energy (mean 7117 kJ/d), fat (28·6 % of energy), carbohydrate (56·2 % of energy), BMI (20·9 kg/m2), systolic blood pressure (108·8 mmHg), diastolic blood pressure (67·0 mmHg), total cholesterol (4·67 mmol/l), HDL-cholesterol (1·78 mmol/l) and glycated Hb (4·9 %) (data not available for other variables)( 6 , Reference Murakami, Sasaki and Takahashi 7 , Reference Murakami, Sasaki and Takahashi 10 ). Nevertheless, the present results cannot be extrapolated to the general Japanese female population. Furthermore, because of the small effect size, particularly for WC, the clinical relevance of our findings remains unclear. Nevertheless, the present results suggest that more research should be done to explore the health impact of following dietary guidelines over time. Such research could help inform the development of future health promotion strategies in Japan. Second, because this was a cross-sectional study, reverse causation may have occurred. However, it is unlikely that subjects with a higher WC and a higher LDL-cholesterol concentration would intentionally change their diet in an unhealthful direction as a result of an increase in WC and LDL-cholesterol concentration. In any case, only a prospective study would provide better understanding of the relationship between dietary intake and metabolic risk factors. Third, although the DHQ that we used has shown the satisfactory relative validity for a wide range of nutrients and foods( Reference Sasaki, Yanagibori and Amano 11 – Reference Kobayashi, Murakami and Sasaki 13 ), all dietary assessment methods suffer from measurement error. More importantly, our DHQ was not designed specifically to measure the adherence to the food-based Japanese dietary guidelines. Actually, while dietary guidelines are available in many countries, there are unfortunately few tools specifically designed for assessing dietary adherence. In such a situation, assumptions have to be made, which may be different among researchers, possibly producing different results. Thus, it may be important to develop specific tools that could be used in epidemiological studies. In any case, it is still worthwhile to try to understand how patterns of food intake might affect health, and our findings should provide valuable insights into this poorly explored research issue. Fourth, misreporting of food intake, particularly by overweight persons, is a serious problem in self-reported dietary assessment methods( Reference Livingstone and Black 15 , Reference Murakami, Sasaki and Uenishi 16 ). To minimise possible influence of dietary misreporting, we included the ratio of reported energy intake to estimated energy expenditure as a confounding factor in the models, as well as the use of energy-adjusted values. Consistent misreporting across all types of foods probably has little influence on energy-adjusted dietary intake values( Reference Livingstone and Black 15 , Reference Murakami, Sasaki and Uenishi 16 ); however, studies have indicated that overweight individuals may selectively under-report their intakes of unhealthy foods( Reference Heitmann and Lissner 26 , Reference Heitmann, Lissner and Osler 27 ), which could cause dietary adherence estimations to be higher than actual values. In the present study, the potential shared error created by under-reporting of dietary measures by subjects with a high BMI (and WC) would probably have weakened the associations of dietary adherence with adiposity measures and could possibly have led to a null finding; this possibility may at least partly explain the lack of association with BMI. Nonetheless, we did find a significant inverse association with WC. Furthermore, a repeated analysis (n 806) after excluding 225 under-reporters and fifty-two over-reporters (assessed by the ratio of reported energy intake to estimated energy expenditure < 0·70 and >1·30, respectively( Reference Murakami, Sasaki and Uenishi 16 )) showed that dietary adherence was inversely associated with BMI (mean values for each quintile: 21·7 (se 0·2), 21·3 (se 0·2), 20·8 (se 0·2), 21·0 (se 0·2) and 21·0 (se 0·2) kg/m2, respectively; P for trend = 0·008) as well as with WC (mean values for each quintile: 73·3 (se 0·3), 73·4 (se 0·3), 71·7 (se 0·3), 72·3 (se 0·3) and 72·0 (se 0·3) cm, respectively; P for trend = 0·0009); the results regarding the other metabolic factors were similar to those obtained in the whole sample (data not shown). Fifth, a single assessment of blood metabolites may represent short-term status only and introduce random errors. This kind of error would tend to bias towards attenuating rather than enhancing the relationship, which may at least partly explain null findings on many blood markers; nevertheless, we did find a significant association for LDL-cholesterol. Finally, although we attempted to adjust for a wide range of potential confounding variables, we could not rule out residual confounding. For example, only approximate measures of physical activity were made.
In conclusion, the present cross-sectional study showed that higher adherence to the food-based Japanese dietary guidelines, which was characterised by favourable dietary intakes of foods and nutrients as well as lower energy-dense diets, was associated with lower WC and LDL-cholesterol concentrations in a group of young Japanese women. Conversely, dietary adherence was not associated with the other metabolic risk factors examined, including BMI, systolic and diastolic blood pressure, total and HDL-cholesterol, TAG, glucose, glycated Hb, and insulin concentrations. Further research among diverse Japanese populations is needed to accumulate scientific evidence on the nutritional and health effects of the Japanese diet. The present study has also highlighted that continuous research is required to establish whether dietary guidelines are, in fact, fit-for-purpose and have their intended consequences, or otherwise, not only in the Japanese context but also in the wider context.
Acknowledgements
The authors thank Chihiro Marusumi, Akari Masamura and Tomomi Taniguchi (Department of Nutrition, School of Human Cultures, University of Shiga Prefecture) for manuscript preparation.
The members of the Japan Dietetic Students' Study for Nutrition and Biomarkers Group (in addition to the authors) are as follows (affiliation at the time of data collection in parentheses): Mitsuyo Yamasaki, Yuko Hisatomi, Junko Soezima and Kazumi Takedomi (Nishikyushu University); Toshiyuki Kohri and Naoko Kaba (Kinki University); Etsuko Uneoka (Otemae College of Nutrition); Hitomi Hayabuchi and Yoko Umeki (Fukuoka Women's University); Keiko Baba and Maiko Suzuki (Mie Chukyo University Junior College); Reiko Watanabe and Kanako Muramatsu (Niigata Women's College); Kazuko Ohki, Seigo Shiga, Hidemichi Ebisawa and Masako Fuwa (Showa Women's University); Tomoko Watanabe, Ayuho Suzuki and Fumiyo Kudo (Chiba College of Health Science); Katsumi Shibata, Tsutomu Fukuwatari and Junko Hirose (University of Shiga Prefecture); Toru Takahashi and Masako Kato (Mimasaka University); Toshinao Goda and Yoko Ichikawa (University of Shizuoka); Junko Suzuki, Yoko Niida, Satomi Morohashi, Chiaki Shimizu and Naomi Takeuchi (Hokkaido Bunkyo University); Jun Oka and Tomoko Ide (Tokyo Kasei University); Yoshiko Sugiyama and Mika Furuki (Minamikyushu University).
The present study was supported in part by grants from the Ministry of Health, Labour and Welfare of Japan (S. S., grant no. 200400526A, 200500555A, 200624013A and 200624013B). The Ministry of Health, Labour and Welfare of Japan had no role in the design and analysis of the study or in the writing of this article.
The authors' contributions are as follows: T. N. contributed to the hypothesis formulation, conducted the statistical analysis, and prepared the first draft of the manuscript; K. M. contributed to the concept and design of the survey, coordination of the fieldwork, data collection and management, hypothesis formulation, and statistical analysis and provided input into the final draft of the manuscript; M. B. E. L. provided input into the final draft of the manuscript; S. S. contributed to the concept and design of the survey and data collection and provided input into the final draft of the manuscript; K. U. contributed to the concept and design of the survey and data collection. All authors read and approved the final manuscript.
There are no conflicts of interest.


