


Dietary fat plays a central role in human diet. As the most energy-dense macronutrient, it has a marked effect on the energy content of our diet; however, it also controls postprandial metabolism and appetite-related signalling mechanisms( Reference Westerterp-Plantenga 1 , Reference Maljaars, Peters and Mela 2 ). Dietary fat is often incorporated into foods in the form of protein-stabilised lipid emulsions, which, in turn, comprise a major part of many processed food formulations( Reference McClements, Decker and Park 3 , Reference Singh and Sarkar 4 ).
Besides providing nutritional advantages to food products, dietary proteins are also excellent emulsifiers. Various protein types are frequently used as stabilising agents in emulsions to control food form, texture, structure and even lipid bioavailability, i.e. the digestion and absorption kinetics of nutrients during the postprandial phase( Reference McClements, Decker and Park 3 , Reference Mackie and Macierzanka 5 ). In addition, lipid bioavailability from emulsions can be either increased or decreased by modifying the interfacial properties of stabilising proteins either physico-chemically or enzymatically( Reference McClements, Decker and Park 3 , Reference Mackie and Macierzanka 5 ).
Enzymatic cross-linking of food biopolymers, including proteins, is an attractive and feasible modification option due to the specificity of enzymes and the requirement of mild reaction conditions( Reference Buchert, Ercili Cura and Ma 6 ). Modification with cross-linking enzymes such as transglutaminase (TG) has been extensively used to change the functionality of proteins and thereby to improve the textural quality, stability and function of protein-based food products( Reference Buchert, Ercili Cura and Ma 6 – Reference Juvonen, Lille and Laaksonen 8 ). Ultimately, the way the stabilising proteins are modified plays a key role in the digestion and absorption kinetics of lipids, and thereby determines the effects on the critical factors affecting postprandial metabolic and appetite responses( Reference McClements, Decker and Park 3 , Reference Mackie and Macierzanka 5 ). Nevertheless, several previous investigations have focused primarily on the lipolysis of emulsified fats/oils( Reference Mun, Decker and McClements 9 – Reference Hur, Decker and McClements 11 ), despite the fact that proteolysis, i.e. the breakdown of the stabilising protein, precedes lipolysis in systems if exposed to physiological conditions prevailing in the human gastrointestinal tract.
Several recent studies( Reference Marciani, Wickham and Hills 12 – Reference Foltz, Maljaars and Schuring 17 ) have demonstrated that the physico-chemical properties of emulsions as well as modification of factors affecting lipid behaviour in the gastrointestinal tract have marked effects on postprandial physiology and appetite sensations. For example, Marciani et al. ( Reference Marciani, Wickham and Singh 14 ) demonstrated that acid-instable fat emulsions in the stomach lead to rapid layering of fat in the gastric lumen with accelerated gastric emptying (GE), lower cholecystokinin (CCK) levels, reduced gall bladder contraction, and increased postprandial appetite compared with acid-stable fat emulsions. Furthermore, Seimon et al. ( Reference Seimon, Wooster and Otto 16 ) showed that increased droplet size of lipid emulsion not only affected postprandial physiological functions, e.g. diminished suppression of antroduodenal motility, but was also associated with attenuation of the stimulation of serum TAG, CCK and peptide YY as well as with reductions in the suppression of hunger and energy intake. However, many of the previous studies have used non-protein-based stabilisers, and, currently, very limited knowledge is available regarding the postprandial digestibility and effects of emulsions stabilised with enzymatically modified proteins in humans.
Therefore, to improve the still limited understanding of the effects of physico-chemical properties of food emulsions in the human digestion process, we investigated the effects of sodium caseinate-stabilised emulsion structured with TG on postprandial metabolic, hormonal and appetite responses in healthy young individuals. We hypothesised that cross-linking of sodium caseinate would decrease the breakdown of the TG-cross-linked emulsion, and thereby delay the rate of protein and lipid digestion. This would subsequently result in delayed postprandial serum TAG responses, increased CCK, glucagon-like peptide 1 (GLP-1) and satiety responses, and potentially increased GE rates.
Participants and methods
We conducted two postprandial studies: (1) a metabolic study in which appetite, metabolic and hormonal responses were assessed, and (2) a complementary gastric retention study in which GE rate was determined. Both studies used a single-blind, randomised, cross-over design.
These studies were conducted according to the guidelines laid down in the Declaration of Helsinki, and all procedures involving human participants were approved by the Ethical Committee of the Northern Savo Hospital District (Finland) (metabolic study) and the Essex 1 Research Ethics Committee (UK) (MRI study). Written informed consent was obtained from all participants.
Metabolic study
Participants
A total of fifteen healthy, normal-weight individuals (fourteen female and one male) participated in the metabolic study at the Department of Clinical Nutrition at the University of Eastern Finland (Table 1). Volunteers were recruited via Intranet announcements and newspaper advertisements in the Kuopio city area.
Table 1 Characteristics of the study participants in the metabolic study (Mean values with their standard errors; n 15*)
* Female, n 14; male, n 1.
Before participating in the study, volunteers were interviewed about their medical history, dietary habits and physical activity. Exclusion criteria were as follows: any food allergies or intolerances; breakfast skipping; marked changes in diet or exercise routine during the past year to lose weight; medication (except oral contraceptives); smoking. The Three-Factor Eating Questionnaire( Reference Stunkard and Messick 18 ) was used to screen volunteers with abnormal eating behaviour. During the screening visit, study procedure and measurements were individually explained to the volunteers to familiarise them with the study protocol and reduce potential misunderstanding.
Study design
All participants tested the two emulsions in consecutive weeks, with more than 3 d between the individual study days. Participants were instructed to maintain their habitual diet and exercise routines as constant as possible, refrain from heavy exercise on the day before the study visit, and avoid alcohol consumption for 2 d before each test day. Participants were requested to arrive the same way (e.g. walking, cycling, car or bus) for every laboratory visit and to avoid extra physical stress before the beginning of the visit. At the beginning of the two study days, participants were weighed, and their alcohol consumption and physical activity during the previous day were checked by an interview.
All the study visits began in the morning after a 10–12 h fast. In the beginning of the study period, participants consumed one of the chilled test emulsions between 07.45 and 08.15 hours along with 100 ml tap water: an oil-in-water emulsion stabilised with either (1) sodium caseinate (Cas) or (2) transglutaminase-cross-linked sodium caseinate (Cas-TG) in a randomised order (Table 3).
Blood samples were drawn from the participants for the determination of plasma glucose, insulin, NEFA, CCK, GLP-1 and serum TAG responses using an indwelling cannula placed in the forearm 10 min before the baseline blood sampling. Venous samples were collected at baseline and at 15, 30, 45, 60, 90, 120, 180, 240, 300 and 360 min after the ingestion of the test emulsions. Appetite ratings were collected at concomitant time points immediately after the blood sampling. Participants were requested to avoid any extra physical activity and stay in a sitting position during the study period.
Gastric retention study
The MRI study conducted in Norwich, UK was designed to assess the differences in GE between the two test emulsions. The study included four male volunteers aged between 20 and 50 years with BMI between 19 and 30 kg/m2 (Table 2). Exclusion criteria were similar to those given in the metabolic study, and screening was performed in a similar way at the Human Nutrition Unit of Institute of Food Research, IFR (Table 3).
Table 2 Characteristics of the study participants in the gastric retention study (Mean values with their standard errors; n 4 male)
Table 3 Composition of the test emulsions used in the studies*
Cas, non-cross-linked sodium caseinate emulsion; Cas-TG, transglutaminase-cross-linked sodium caseinate emulsion; E%, percentage of energy.
* Ingested with 100 ml tap water.
† Percentage of total energy content.
Each volunteer visited the study centre on two occasions, at least 7 d apart, and consumed one of the test emulsions on each occasion. The order in which the emulsions were consumed was randomly allocated. All volunteers consumed all of the test emulsions within 5 min. On each study day, volunteers were asked to eat their breakfast at home (before 09.00 hours). They were allowed to drink as much water as they needed but only until 10.00 hours. After this time, no further consumption was allowed. MRI images of the upper abdomen of the volunteers were taken 10 min before consumption of the test products and at 5, 25, 45, 65, 85, 105, 125, 145, 165 and 185 min after ingestion. The gastric content of the volunteers was determined using a conventional 1·5 T MRI scanner (Siemens Avanto 1·5T). Imaging used a TRUFISP (true fast imaging with steady-state precession) protocol developed to scan the stomach in a breath-hold of the order of 15–25 s depending on the fullness of the stomach (repetition time/echo time 3·5/1·5 ms, field of view 24 × 32 cm, matrix 154 × 256 and slice thickness 0·5 cm). This yields contiguous 5 mm axial slices through the stomach, enabling calculation of the total stomach volume. Both transverse and coronal images were acquired in order to ensure that the gastric volume could be accurately defined. Total volumes of gastric contents (excluding gas) and the volumes of layers formed as a result of sedimentation were determined at each time point using freehand tracings of the region of interest around the stomach contents/layers for each slice, and from this, the total stomach volume was calculated. Each scan took about 5 min, and between scans, the volunteers underwent minimal physical movement and remained seated close to the scanner.
Preparation of the test products
The preparation of the test emulsions used in these studies was done using a similar protocol in each study site. Sodium caseinate (Na-Cas) solution for the emulsions was prepared by dissolving 3·8 g of Na-Cas powder (85·5 % protein) into boiling tap water (total 250 g) to obtain a protein stock (c= 13 mg/g). For emulsion preparation, 207·7 g of the cooled protein stock and 54 g of rapeseed oil (Keiju Rapeseed Oil; Raisio plc) were added into a plastic mill cup and mixed with a high-speed blender (Kenwood BL450) under conditions that minimised the formation of protein-stabilised foam. The system was first sheared for 30 s at a low speed, and then stopped for 30 s and sheared again for 30 s at a high speed. After another 30 s break, shearing was repeated at a high speed for 30 s.
Immediately after mixing, 242·3 g of freshly prepared emulsion were transferred into a glass decanter, covered with parafilm and placed in an incubator (27·5°C, 50 rpm) for 10–15 min. In the case of TG (94 % maltodextrin+lactose, 5 % moisture and 1 % protein, TG powder, Activa MP; Ajinomoto Foods Europe SAS) cross-linked emulsion, 5 g of the TG stock (1:10 (w/w), microbial TG in tap water) were added into the emulsion and completed with 2·7 g of tap water to obtain a final weight of 250 g (final enzyme:protein ratio 500 nkat/g in emulsion). The emulsion stabilised with non-cross-linked Na-Cas was made up in a similar manner but with heat-inactivated (100°C, 30 min) TG stock. The emulsions were gently mixed for 10–20 s, covered and placed again in the incubator, where incubation was carried out for 3 h (27·5°C, 50 rpm). Afterwards, the emulsions were transferred to a fridge to continue incubation at 5°C for 14 h (static conditions). The final composition of the emulsions was 20 wt% rapeseed oil and 80 wt% aqueous phase containing Na-Cas (1 wt% Na-Cas in final emulsion).
Just before serving, the emulsions were gently stirred with a spoon for about 5–10 s to redisperse droplets from the cream layer.
Characterisation of the test products
The test products were characterised in terms of their oil droplet size distribution, the viscosity of the emulsion and the extent of protein cross-linking. Emulsion droplet size distribution was determined using an LS-230 laser diffraction particle sizer (Beckman Coulter Limited). The measurements were made for three replicate emulsions obtained under the same conditions. Viscosity of the emulsion samples was measured using an AR2000 rheometer (TA Instruments) equipped with the coaxial cylinder geometry (15 mm outer diameter, 12 mm inner diameter). The emulsion (13 ml) was introduced into the measuring cell of the rheometer, and a viscosity ramp test carried out at 23 ± 0·1°C for a shear rate being increased from 0·01 to 500 per s over 15 min. The extent of Na-Cas cross-linking was evaluated by SDS–PAGE. All chemicals and gels used for the SDS–PAGE analysis were purchased from Invitrogen Limited. Aliquots (8 μl) of emulsions taken after incubation with or without TG were mixed with 5 μl NuPAGE reducing agent, 12·5 μl NuPAGE LDS sample buffer (4 × ) and 35 μl phosphate buffer (used as a diluting agent). They were additionally mixed with 5 μl of 5 % (w/v) SDS solution (Sigma) in order to displace the protein from the surface of oil droplets( Reference Macierzanka, Bordron and Rigby 19 ). Subsequently, the samples were heated in a water-bath (70°C, 10 min) and loaded onto a 10 % polyacrylamide NuPAGE Novex Bis-Tris precast gel (10 μg protein per well). After the heating, they were centrifuged at 9000 g for 10 min, and the resulting subnatant used for the SDS–PAGE analysis. Gels were run for 35 min at 120 mA/gel and 200 V. A continuous buffer system was used, consisting of 50 ml of 20 × NuPAGE MES SDS running buffer and 950 ml of ultra-pure water. Afterwards, gels were stained using a colloidal Coomassie stain (SimplyBlue SafeStain). SeeBlue Plus2 (1 × ) prestained molecular-weight marker, comprising a mix of proteins ranging from a molecular weight of 3 to 188 kDa, was used. The emulsion characteristics are shown in Fig. 1.
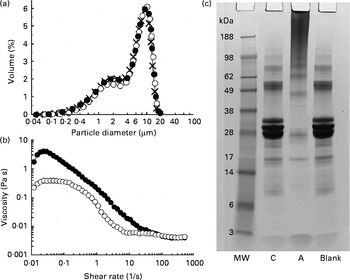
Fig. 1 (a) Droplet size distributions of sodium caseinate (Na-Cas)-stabilised emulsions: × , Freshly prepared emulsion; ●, emulsion after incubation with transglutaminase (TG); ○, emulsion after incubation with heat-inactivated TG. (b) Viscosity profiles of the emulsions as determined after incubation with TG (●) or heat-inactivated TG (○). (c) SDS–PAGE analysis (reducing conditions) of the protein patterns in the emulsions: C, control Na-Cas-stabilised emulsion after incubation with heat-inactivated TG; A, active sample where Na-Cas was cross-linked with TG; Blank, Na-Cas-stabilised emulsion after incubation without TG (see text for the incubation conditions); MW, molecular-weight standard.
Appetite measurements
Appetite ratings (hunger, satiety, desire to eat, fullness and thirst) and pleasantness of the test products were assessed using visual analogue scales. Each scale contained an unstructured 100 mm horizontal line with verbal anchors (in Finnish) at either end, expressing the weakest or strongest statement (i.e. ‘I am not hungry at all’ or ‘I have never been hungrier’). Participants were instructed to draw a vertical line on the horizontal axis corresponding to their sensations at the time of assessment. Visual analogue scale ratings were measured in mm, resulting in scores between 0 and 100 for statistical analyses.
Biochemical measurements
Plasma samples were collected in prechilled EDTA-containing tubes for insulin, CCK and GLP-1 analyses. Tubes containing fluoride citrate were used for plasma glucose samples. Plasma insulin, CCK and GLP-1 samples were centrifuged for 15 min at 1700 g and 4°C. Plasma glucose samples were centrifuged for 10 min at 2400 g and 4°C. All samples were immediately stored at ( − 70°C until analysed. Results were obtained from all the study participants, except for GLP-1 (n 14).
Plasma glucose sample was analysed using an enzymatic photometric assay (Konelab 20XTi Clinical Chemistry Analyzer; Thermo Electron Corporation) and plasma insulin using a luminometric immunoassay (ADVIA Centaur Immunoassay System; Siemens Medical Solutions Diagnostics). The intra-assay CV for plasma glucose was 2·7 % at 10·2 mmol/l, and the inter-assay CV was 4·1 % at 2·05 mmol/l and 1·8 % at 8·2 mmol/l. For plasma insulin, the intra-assay CV was 2·7 % at 667 pmol/l, and the inter-assay CV was 6·6 % at 41 pmol/l and 5·1 % at 444 pmol/l.
CCK RIA was performed using commercial RIA kits (EURIA CCK, catalogue no. RB 302; Euro Diagnostica). Plasma samples were extracted using solid-phase extraction cartridges (Sep-Pak® Vac/3cc (500 mg) C18 cartridges; Waters), as described previously( Reference Juvonen, Karhunen and Vuori 7 ). Assay was done according to the manufacturer's instructions. Results were calculated with GraphPad Prism 6 (GraphPad Software, Inc.). The lowest detected value was 0·23 nmol/l. The inter-assay CV of the EURIA CCK RB 302 kit was 13·7 % at 4·2 pmol/l and 4·1 % at 20·6 pmol/l, and the intra-assay CV was 5·5 % at 4·4 pmol/l and 2·0 % at 20·6 pmol/l.
A fluorometric enzyme immunoassay (ELISA; Linco Research, Inc.) was used to analyse plasma GLP-1 concentrations. The assay measures active GLP-1, i.e. GLP-17–36amide and GLP-17–37. The inter-assay CV of the total GLP-1 ELISA kit was 28 % at 2 pmol/l and 7·5 % at 42·1 pmol/l, and the intra-assay CV was 6·3 % at 3·0 pmol/l and 4·4 % at 13·3 pmol/l.
Serum TAG and plasma NEFA concentrations were analysed using enzymatic colorimetric tests (Konelab 20XTi Clinical Chemistry Analyzer; Thermo Fisher Scientific). The intra-assay CV for the TAG measurement was 4·1 %, and the inter-assay CV was 2·5 %. For the NEFA measurement, the corresponding variations were 3·4 and 2·9 %.
Statistical methods
The study was powered based on the AUC of the baseline-subtracted plasma insulin concentration. If we assume a standard deviation of 1·2 μmol × min/l in the AUC, then a power of 90 % is provided by fifteen participants.
SPSS for Windows software (version 19.0; SPSS, Inc.) was used to analyse the data. Results are expressed as means and standard errors of the mean, with P≤ 0·05 (two-sided) considered significant.
Linear mixed-effects modelling was used to compare the effects of the test emulsions on the profiles of postprandial metabolic, gastrointestinal hormone and appetite responses. In the analysis, the baseline value of each parameter was subtracted from the values of subsequent time points to take into account the possible effect of baseline differences on the analysis. In the analysis product, time and product × time was used as fixed factors and participant as a random factor. Linear mixed-effects modelling was also used to investigate the relationship between appetite and metabolic or hormonal responses. In the analysis, the test products and metabolic or hormonal responses were used as fixed factors and participant as a random factor. The AUC or the area above the curve was calculated using the trapezoidal rule to obtain the overall postprandial responses for the test products. Due to the skewed distribution of AUC and area above the curve variables, the differences between the test products were analysed using the non-parametric Wilcoxon test.
Results
Serum TAG and plasma NEFA responses
Postprandial serum TAG or plasma NEFA responses did not differ between the test emulsions (Fig. 2(a) and (b); Table 4), with a time to peak of 2–3 h for serum TAG concentration and of 4 h for plasma NEFA concentration.

Fig. 2 Changes in the concentration of (a) serum TAG, (b) plasma NEFA, (c) plasma cholecystokinin (CCK) and (d) plasma glucagon-like peptide 1 (GLP-1) during the 360 min postprandial period in healthy young individuals consuming emulsions stabilised with either sodium caseinate (Cas; –○–) or transglutaminase-cross-linked sodium caseinate (Cas-TG; –■–). Values are means (n 15), with their standard errors represented by vertical bars. * Mean value was significantly different from that of the Cas meal condition (P< 0·05; linear mixed-effects model).
Table 4 Appetite ratings and metabolic and gastrointestinal hormone responses, expressed as the area above the curve (AAC; satiety, fullness, TAG, NEFA, insulin, cholecystokinin (CCK) and glucagon-like peptide 1 (GLP-1)) or the AUC (hunger, desire to eat, thirst and glucose), with their peak/nadir values after the ingestion of the test emulsions (Mean values with their standard errors, n 15*)

Cas, non-cross-linked sodium caseinate emulsion; Cas-TG, transglutaminase-cross-linked sodium caseinate emulsion.
* Female, n 14; male, n 1.
† Wilcoxon signed-rank test.
Plasma cholecystokinin and glucagon-like peptide 1 responses
Postprandial plasma CCK concentrations for the Cas-TG meal condition peaked at 30 min and then returned towards the baseline, whereas CCK concentrations for the Cas meal condition peaked at 15 min and decreased gradually during the postprandial period (Fig. 2(c)), with no significant difference between the peak values (Table 4). The CCK profiles were significantly different between the test emulsions at 30 min (P< 0·05). The overall postprandial responses did not differ between the Cas-TG and Cas meal conditions (Table 4). GLP-1 responses did not differ significantly between the test emulsions (Fig. 2(d); Table 4).
Plasma glucose and insulin responses
After ingestion of both emulsions, postprandial plasma glucose concentrations decreased initially from the baseline concentration and reached a minimum after 45 min for the Cas meal condition and after 60 min for the Cas-TG meal condition, the nadir value being lower after the ingestion of Cas-TG than after the ingestion of Cas (P< 0·05, Table 4). Thereafter, the concentrations gradually increased before declining again after 240 min (Fig. 3(a)). Significant differences between the profiles were observed at 30, 45, 60 and 90 min, so that the glucose concentration was reduced more after the ingestion of Cas-TG than after the ingestion of Cas (P< 0·05).

Fig. 3 Changes in the concentration of plasma (a) glucose and (b) insulin during the 360 min postprandial period in healthy young individuals consuming emulsions stabilised with either sodium caseinate (Cas; –○–) or transglutaminase-cross-linked sodium caseinate (Cas-TG; –■–). Values are means (n 15), with their standard errors represented by vertical bars. * Mean value was significantly different from that of the Cas meal condition (P< 0·05; linear mixed-effects model).
After the ingestion of Cas, two post-meal insulin upsurges were detected. The first increase peaked at 30–45 min, after which the other peak was observed at about 180 min. After the ingestion of Cas-TG, insulin concentration peaked at 30 min and then gradually decreased throughout the study period (Fig. 3(b)). Significant differences between the test emulsions were observed at 45, 60, 120, 240 and 300 min, so that the insulin concentration increased more after the ingestion of Cas than after the ingestion of Cas-TG at the given time points (P< 0·05). The overall postprandial insulin responses did not differ between the Cas-TG and Cas meal conditions (Table 4).
Consumption of the test products and appetite ratings
The mean time for ingestion of the test products was comparable: 1·65 (sem 0·22) min for the Cas meal condition and 1·67 (sem 0·23) min for the Cas-TG meal condition. There were no significant differences between the test emulsions in relation to the ratings of palatability.
Profiles of appetite sensations varied significantly over the experimental period (P< 0·05; Fig. 4(a)–(e)). Hunger, desire to eat and thirst reached a minimum at 15–30 min after the ingestion of both emulsions and increased gradually thereafter. Feelings of fullness and satiety peaked at 15 min and declined progressively thereafter. The postprandial profiles for hunger, desire to eat and thirst differed significantly between the test emulsions; hunger was more reduced at 30 and 90 min, desire to eat at 15, 30, 60, 90 and 180 min, and thirst at 15, 30, 45, 60, 90, 120 and 180 min after the ingestion of Cas than after the ingestion of Cas-TG, respectively (P< 0·05). The overall postprandial responses were also significantly reduced after the ingestion of Cas than after the ingestion of Cas-TG, indicating a greater overall decrease in hunger, desire to eat and thirst between the two emulsions (P< 0·05; Table 4). For hunger and thirst, the nadir values were significantly lower after the Cas than after Cas-TG (P< 0·05, Table 4). Also, satiety profiles differed significantly between the test emulsions, so that satiety was more pronounced at 15, 30, 45, 60 and 90 min postprandially and peaked higher after the ingestion of Cas than after the ingestion of Cas-TG (P< 0·05; Table 4). Fullness ratings did not differ significantly between the test emulsions.

Fig. 4 Changes in visual analogue scale ratings for (a) hunger, (b) satiety, (c) desire to eat, (d) fullness and (e) thirst during the 360 min postprandial period in healthy young individuals consuming emulsions stabilised with either sodium caseinate (Cas; –○–) or transglutaminase-cross-linked sodium caseinate (Cas-TG; –■–). Values are means (n 15), with their standard errors represented by vertical bars. * Mean value was significantly different from that of the Cas meal condition (P< 0·05; linear mixed-effects model).
Relationship between appetite and metabolic/hormonal responses over time
To investigate the relationship between appetite and metabolic/hormonal responses over time, graphs demonstrating the relationship between the responses at the same time points for each test product were generated. When the relationships with hunger and satiety responses were analysed, the test product (P< 0·01) and plasma insulin (P< 0·001) and NEFA (P< 0·001) responses were significantly related to hunger (Fig. 5(a)–(d)), whereas plasma insulin (P< 0·001), NEFA (P< 0·001), CCK (P< 0·01) and test product (P< 0·01) responses were significantly associated with satiety (Fig. 6(a)–(f)).

Fig. 5 Hunger scores (visual analogue scales) synchronised with plasma (a, b) insulin and (c, d) NEFA concentrations in the Cas (non-cross-linked sodium caseinate emulsion) and Cas-TG (transglutaminase-cross-linked sodium caseinate emulsion) meal conditions. Values are means (n 15), with their standard errors represented by vertical bars.

Fig. 6 Satiety scores (visual analogue scales) synchronised with plasma (a, b) insulin, (c, d) NEFA and (e, f) cholecystokinin (CCK) concentrations in the Cas (non-cross-linked sodium caseinate emulsion) and Cas-TG (transglutaminase-cross-linked sodium caseinate emulsion) meal conditions. Values are means (n 15), with their standard errors represented by vertical bars.
Gastric emptying rate
The volume of gastric contents was measured both before and at ten time intervals after the ingestion of the test emulsions (Fig. 7). The measurements made at both 5 and 25 min after ingestion were very similar in both cases, suggesting that there was very little emptying from the gastric compartment in the first 25 min after consumption, regardless of the test emulsion. Subsequently, there was no significant difference in GE rates between the two test emulsions as both had T ½ values of 116 min based on the Elashoff equation( Reference Elashoff, Reedy and Meyer 20 ) (P>0·05). The formation of layers due to phase separation of the emulsions in the stomach also appears to have been very similar. The images shown in Fig. 8 were obtained from a single volunteer 5 and 60 min after ingestion of the two test emulsions. All the four images show a brighter, denser, higher water content region at the base of the stomach, caused by phase separation of the test emulsions.

Fig. 7 Volume of gastric contents during the 180 min postprandial period in individuals consuming emulsions stabilised with either sodium caseinate (Cas; –●–) or transglutaminase-cross-linked sodium caseinate (Cas-TG;–■–). Values are means (n 3), with their standard errors represented by vertical bars.

Fig. 8 MRI images of the abdomen of a recumbent volunteer at 5 min (a, b) or 60 min (c, d) after consuming emulsions stabilised with either sodium caseinate (a, c) or transglutaminase-cross-linked sodium caseinate (b, d). The stomach is shown on the right of the images.
Discussion
The present clinical study showed that the TG-induced microstructural modification of the interfacial layer of a fat emulsion did not have a significant effect on the GE rate or overall postprandial lipid digestion after the ingestion of the test emulsion. However, the structuring of the emulsion interface affected early postprandial metabolic, hormonal and appetite responses as reflected by the increased appetite and suppressed satiety responses, as well as by the different postprandial glucose, insulin and CCK profiles. This indicates that nutrient-sensing mechanisms are operative, and even a subtle interfacial protein modification is capable of modifying postprandial physiological and appetite responses.
In the present study, the GE rate was measured by MRI, and as in previous studies using this technique( Reference Marciani, Wickham and Bush 13 – Reference Marciani, Faulks and Wickham 15 ), the images showed signs of phase separation for the two emulsions occurring during the gastric phase, caused by the density difference between the oil and aqueous phases and accelerated by flocculation of the protein due to low pH. This is in agreement with previous studies showing that casein can be considered as a slow-release milk protein because of its sensitivity to acid coagulation( Reference Hall, Millward and Long 21 , Reference Veldhorst, Nieuwenhuizen and Hochstenbach-Waelen 22 ). A recent in vitro study using test emulsions of comparable composition and characteristics with the ones used in the present study demonstrated that TG-induced structuring of the emulsion interface increased resistance to proteolysis and thus enhanced emulsion stability under gastric conditions( Reference Macierzanka, Böttger and Rigby 23 ). This behaviour would make Cas-TG less prone to acid coagulation than Cas. The effect was shown to be due to strengthening of the casein interfacial layer at the oil/water interface including aggregation of the protein in the layer coating the oil droplets. The in vitro study also showed that the test emulsions were very similar, producing evenly sized oil droplets and similar digestion products, suggesting that the GE rate would not be significantly affected, although very different rates of proteolysis were observed. Furthermore, the in vivo MRI images obtained in the present study showed signs of comparable phase separation for the two emulsions during the gastric phase, which was probably the reason for the similar GE rates after the consumption of the test emulsions. Previously, it has been shown that inhibition of marked phase separation( Reference Marciani, Wickham and Singh 14 , Reference Marciani, Faulks and Wickham 15 ) and/or (lack of) subsequent duodenal feedback( Reference Keogh, Wooster and Golding 24 ) is needed to slow down the GE rate significantly, indicating that these factors are powerful enough to affect gastric motor function after the ingestion of emulsions with different characteristics.
The results on postprandial TAG responses suggest that the overall lipid digestion during the intestinal phase was not markedly affected by TG-induced interfacial structuring. Although the intestinal content (e.g. droplet size, lipolysis products, lipase and bile salt concentrations) was not sampled for further analysis in the present study, it is likely that the structuring of the interfacial layer did not affect markedly the functioning of these key factors known to affect lipid digestion( Reference McClements, Decker and Park 3 , Reference Seimon, Wooster and Otto 16 , Reference Armand, Pasquier and André 25 ). Therefore, it can be presumed that the rate of lipid digestion and absorption during the intestinal phase was equally efficient, and resulted in serum TAG responses with similar amplitudes after the ingestion of the two test emulsions. Thus, in contrast to our hypothesis, the TG-induced structuring of the interfacial layer was not strong enough to markedly delay the overall lipid digestion process.
As demonstrated previously, appetite sensations are affected by different emulsion properties( Reference Marciani, Wickham and Singh 14 – Reference Seimon, Wooster and Otto 16 , Reference Maljaars, van der Wal and Wiersma 26 ), of which phase separation tendency during the gastric phase( Reference Marciani, Wickham and Singh 14 , Reference Marciani, Faulks and Wickham 15 ) and droplet size( Reference Seimon, Wooster and Otto 16 , Reference Maljaars, van der Wal and Wiersma 26 ) have been shown to be influential. In these studies, the effects on appetite were probably due to the differences in the behaviour of emulsions during the gastric phase. In the present study, hunger and desire to eat were significantly less reduced and satiety less increased after the ingestion of Cas-TG compared with Cas. It is possible that if the protein digestion process was decreased in the early postprandial phase due to cross-linking, the alterations in protein and fat digestion may have been reflected by increased hunger/desire to eat and decreased satiety after the Cas-TG due to reduced or delayed satiety-stimulating mechanisms. The present results on less decreased appetite after the ingestion of Cas-TG are parallel to those from studies reporting that fat digestion was slower/delayed due to gastric phase separation( Reference Marciani, Faulks and Wickham 15 ) and increased droplet size( Reference Seimon, Wooster and Otto 16 , Reference Maljaars, van der Wal and Wiersma 26 ), or inhibited( Reference Feinle, Rades and Otto 27 – Reference Ellrichmann, Kapelle and Ritter 29 ), which was subsequently reflected by increased hunger or appetite responses.
Even though the test emulsions did not contain any carbohydrate, postprandial glucose and insulin profiles varied over the experimental period and differed between the test emulsions. The glucose and insulin profiles suggest that protein and lipid components were released from Cas-TG in a lower rate during the early postprandial phase when compared with Cas. Plasma glucose concentration decreased slightly but significantly more after the ingestion of Cas-TG than after the ingestion of Cas. At the same time, circulating insulin concentration was less stimulated after the ingestion of Cas-TG. As the GE rate was comparable between the test emulsions, the difference observed in the glucose and insulin profiles most probably resulted from the different release and/or absorption rates of the nutrients during the small intestinal phase due to the different initial digestion behaviours of the test emulsions. It is also possible that not only the protein released from the interfacial layer of the emulsified lipid droplets, but also the dispersed cross-linked and non-cross-linked protein in the continuous phase contributed to glucose and insulin responses. It is well known that amino acids and fatty acids release incretins( Reference Carr, Larsen and Winzell 30 ), and have a stimulating effect on insulin secretion( Reference Nolan, Madiraju and Delghingaro-Augusto 31 , Reference Gannon and Nuttall 32 ).
The postprandial secretion of CCK and GLP-1 was stimulated after the two emulsions, but only the CCK profile differed markedly between the emulsions, showing a stronger increase after the ingestion of Cas-TG than after the ingestion of Cas. However, since the overall postprandial CCK response did not differ between the emulsions, it could be that the single peak in the CCK profile after the ingestion of Cas-TG was too weak to stimulate stronger satiety sensation compared with Cas. It is also possible that we failed to detect the initial CCK peak after the ingestion of Cas ( < 15 min( Reference Foltz, Maljaars and Schuring 17 , Reference Liddle, Goldfine and Rosen 33 , Reference Ellrichmann, Ritter and Otte 34 )). If Cas peaked earlier than Cas-TG, it would also explain the more attenuated hunger responses after consuming Cas compared with Cas-TG. The postprandial GLP-1 response showed a trend towards higher levels for Cas-TG in the first 30 min, although the difference was not significant between the emulsions for the overall response. GLP-1 is secreted from the L cells in the distal intestine, and therefore it is probable that the difference in the initial digestion phase of the emulsions was not marked enough to stimulate differently the early postprandial GLP-1 secretion. Furthermore, the marked individual variation in postprandial GLP-1 secretion presumably resulted in non-significant differences between the GLP-1 responses after consuming Cas and Cas-TG. Thus, both CCK and GLP-1 responses indicate that protein and lipid components that were released from the emulsions stimulated subsequently the secretion of these hormones. Furthermore, it has been shown that hydrolysis of fat is a critical step for fat-induced stimulation of GLP-1 in humans, and the signal is mediated via CCK release( Reference Beglinger, Drewe and Schirra 35 ).
When analysing the relationships between appetite and metabolic or hormonal responses over time, plasma insulin and NEFA responses were strongly related to hunger and satiety. Insulin contributed to decreased hunger and increased satiety, especially during the initial postprandial phase. Instead, the relationship of NEFA with hunger and satiety was most evident during the later postprandial phase, and the relationship with hunger and satiety being the opposite with that of insulin. CCK and satiety responses were also positively related, in line with the well-known role of CCK as a satiety hormone( Reference Kissileff, Pi-Sunyer and Thornton 36 – Reference Beglinger, Degen and Matzinger 38 ). Thus, it could be argued that the different appetite responses observed in the present study were mediated by these metabolites and hormones, and therefore insulin and NEFA together with CCK could be considered important metabolic mediators of postprandial appetite, as suggested previously( Reference Lieverse, Jansen and Masclee 37 , Reference Tataranni, Gautier and Chen 39 ).
In conclusion, the present results suggest that even a subtle structural modification of the interfacial layer of a fat emulsion can alter the early postprandial profiles of glucose, insulin, CCK, appetite and satiety through decreased protein digestion without affecting significantly on GE or the overall digestion of lipids under physiological conditions in human subjects. These results emphasise the key role of the interfacial layer of emulsions in controlling postprandial physiological responses.
Acknowledgements
The authors acknowledge Eeva Lajunen, Taisa Venäläinen and Emma Kakkonen for their excellent technical and laboratory assistance throughout the study.
The present study was supported by the Academy of Finland (TEPESS consortium – grant no. 118281, 118191 and 216327), Academy Professorship (K. S. P., grant no. 131460), The Finnish Graduate School on Applied Bioscience: Bioengineering, Food Nutrition, Environment, and Kuopio University Hospital (EVO funding). The work at the IFR was supported by the BBSRC through research grant BB/J004545/1. The MRI was funded by the NNUH Radiology Department research budget. The funders had no role in the design and analysis of the study or in the writing of this article.
The authors' contributions are as follows: K. R. J., A. M., L. J. K., M. E. L., K.-H. H., D. E. L., L. K. N., H. M. M., A. R. M., C. E. N. M. and K. S. P. designed the research; K. R. J. conducted the research; A. M., M. E. L. and A. R. M. provided the ingredients and the protocol for preparing the test products; K. R. J. analysed the data and wrote the first version of the manuscript. All authors contributed to the writing of the final manuscript.
K. R. J., K.-H. H., A. M. and A. R. M. are participants in the FA1005 COST Action INFOGEST on food digestion.
There are no conflicts of interest.


