


Immune and metabolic response systems in humans are closely linked due to an evolution from common ancestral structures. However, what may have been beneficial in the past may be detrimental under the current Western lifestyle favouring overnutrition combined with malnutrition as well as low physical activity( Reference Hotamisligil 1 ). After food intake, inflammatory markers in the systemic circulation transiently increase as a reaction to the acute ingestion of nutrients. This effect, known as postprandial inflammation, is a normal metabolic response of the organism to regulate energy expenditure after the ingestion of food( Reference Ye and Keller 2 ) and to safeguard immunological homeostasis. However, postprandial inflammation has become an important factor for human health since people in industrialised countries are almost constantly in a postprandial state, and postprandial inflammation may thus turn into chronic low-grade inflammation( Reference Klop, Proctor and Mamo 3 ). Chronic low-grade inflammation is known to be associated with atherosclerosis and type 2 diabetes( Reference Margioris 4 , Reference Dandona, Ghanim and Chaudhuri 5 ). Metabolic disorders such as obesity, characterised by a chronic low-grade inflammation in the fasting state, increase the magnitude of postprandial inflammation( Reference Calder, Ahluwalia and Brouns 6 ).
Several nutrient-dependent factors influence the degree of postprandial inflammation induced by a meal: (1) its energy value; (2) the amount of carbohydrates and the glycaemic index; (3) the amount and composition of lipids( Reference Margioris 4 ). High-fat meals increase the postprandial concentrations of pro-inflammatory cytokines IL-6 and TNF-α, and augment the hepatic production of acute-phase proteins such as C-reactive protein (CRP)( Reference Nappo, Esposito and Cioffi 7 – Reference Aljada, Mohanty and Ghanim 9 ). Additionally, high-fat meals influence postprandial metabolism by increasing glucose, insulin and TAG concentrations( Reference Havel 10 , Reference Miller, Zhan and Georgopoulos 11 ). We previously demonstrated a dose–response for glucose, insulin, TAG and IL-6 concentrations after the consumption of three energy doses (2092, 4184 and 6276 kJ (500, 1000 and 1500 kcal)) of the same high-fat meal in normal-weight and obese men( Reference Schwander, Kopf-Bolanz and Buri 12 ).
Results of various studies indicate that foods rich in phytochemicals, such as orange juice and tomatoes, are able to reduce postprandial inflammation( Reference Ghanim, Sia and Upadhyay 13 , Reference Burton-Freeman, Talbot and Park 14 ). Furthermore, observational studies have suggested that a high intake of dairy products can be negatively associated with low-grade systemic inflammation( Reference Panagiotakos, Pitsavos and Zampelas 15 – Reference Bordoni, Danesi and Dardevet 18 ). In most Western countries, dairy products play an important role in the normal human diet. As these products have been associated with beneficial effects on weight and body fat( Reference Zemel, Donnelly and Smith 19 ), a positive influence on postprandial inflammation would be an additional asset. However, clinical studies evaluating the impact of dairy product consumption on systemic inflammation in overweight and obese men and women, with interventions between 4 and 48 weeks, have yielded differing results. For example, half of the studies suggested a beneficial effect of dairy product intake on systemic inflammation, and the other half found no effect( Reference Labonté, Couture and Richard 20 ). Only one study has investigated the impact of dairy products on postprandial inflammation: Nestel et al. ( Reference Nestel, Pally and MacIntosh 21 ) documented a significant drop in inflammatory markers in overweight participants 3 h after consumption of meals composed of cream, butter or low-fat milk, but not after consumption of cheese or yogurt. Most parameters returned to baseline concentrations at 6 h, and no differences between groups were observed.
The aim of the present study was to investigate the effect of full-fat milk and dairy products on postprandial inflammatory and metabolic responses in healthy men. In particular, two questions were addressed. (1) Does a high-fat meal composed of dairy products induce a lower postprandial inflammatory response than a comparable non-dairy high-fat meal? (2) Does the addition of milk reduce the inflammatory response of a non-dairy high-fat meal? IL-6 determined at 6 h after the meals was chosen as the primary endpoint of the present study.
Materials and methods
Study population
A total of twenty-one male volunteers were recruited by advertisements on the Internet and with flyers at the Division of Endocrinology, Diabetes and Clinical Nutrition, University Hospital of Bern, and at Agroscope between May and August 2013. Subjects had to meet the following inclusion criteria: male; aged 25–55 years; BMI ≥ 20 kg/m2; willingness to keep dietary habits and physical exercise constant during the study. Normal-weight as well as overweight and obese participants were included to reflect population composition in Switzerland. In addition, our previous study( Reference Schwander, Kopf-Bolanz and Buri 12 ) showed no differences between normal-weight and obese participants in the postprandial response of IL-6. The exclusion criteria were smoking, following a vegetarian or vegan diet, infectious disease, acute or chronic pharmaceutical intake, marked dyslipidaemia, food allergy or intolerance, diabetes, existing physical or mental disease, or simultaneous participation in another study. Body weight and height were assessed at inclusion, and written informed consent was obtained from all subjects. The present study was conducted according to the guidelines laid down in the Declaration of Helsinki, and was approved by the Cantonal Ethical Committee of Bern, Switzerland. The trial was registered at ClinicalTrials.gov (NCT01885416).
Study design and diet
In the present prospective, randomised cross-over study, participants were assigned to three different high-fat meals in random order. Meal intake was separated by washout periods of at least 1 week during which participants consumed their usual diet. Volunteers arrived at the University Hospital of Bern after an overnight fasting of at least 8 h, on the mornings of the study days. Baseline fasting blood samples were collected for the determination of the metabolic and inflammatory parameters described below. Participants were then requested to consume the assigned meals within 30 min. The meals were prepared ahead by the study investigators and consumed under their supervision. At time points 1, 2, 4 and 6 h after the end of the meal intake, blood samples were taken for the determination of blood parameters. Participants were not allowed to consume any food or beverages for 6 h after meal intake, except for 1 litre of still mineral water. Subjects consumed the following three meals: (1) HFC meal (high-fat non-dairy control meal; 4204 kJ (1005 kcal)); (2) HFD meal (isoenergetic high-fat dairy meal; 4184 kJ (1000 kcal)); (3) HFM meal (high-fat non-dairy meal supplemented with milk; 5343 kJ (1277 kcal)). The HFC meal consisted of bread (120 g), salami (100 g), palm fat (26 g), hard-boiled egg (50 g) and still mineral water (400 ml). The HFD meal contained bread (120 g), cheese (Tête de Moine; 110 g), butter (25 g), mozzarella cheese (32 g) and still mineral water (400 ml). The HFM meal was similar to the control meal, but whole-fat milk (400 ml) was given instead of still mineral water. All food except palm fat was bought at a local store of a Swiss supermarket chain. Palm fat was obtained from a local health food shop. The control meal was adopted from our previously conducted study investigating the impact of high-fat meals with the same macronutrient composition but different energy content on inflammatory and metabolic responses in obese and normal-weight subjects( Reference Schwander, Kopf-Bolanz and Buri 12 ). The nutrient composition of the three meals was calculated with Prodi® 5.8 (Nutri-Science GmbH), and is presented in Table 1. Due to the obvious differences between the three meals, it was not possible to blind the investigators or study participants.
Table 1 Nutrient composition of the meals used in the study
HFC meal, high-fat non-dairy control meal; HFD meal, high-fat dairy meal; HFM meal, high-fat non-dairy meal supplemented with milk; E%, percentage of energy.
Blood sampling and analyses
Blood samples were taken using an indwelling peripheral venous catheter (Vasofix® Safety; B. Braun Melsungen AG). Fasting blood samples were obtained before each meal to determine the concentrations of CRP, IL-6, TNF-α, endotoxin, insulin, glucose and lipids (total cholesterol, LDL-cholesterol, HDL-cholesterol and TAG). Non-fasting blood samples were collected 1, 2, 4 and 6 h after each meal. Lipid, insulin and glucose concentrations were determined at each time point, while IL-6, TNF-α and endotoxin concentrations were determined only at 6 h.
Blood samples for serum analyses were collected in serum-gel S-Monovette® (Sarstedt AG & Co.), and blood samples for plasma analyses were collected in plasma-gel S-Monovette® with lithium heparin (Sarstedt AG & Co.). Assays for insulin (serum), glucose, lipids and CRP (plasma) were immediately performed in the chemistry laboratory of the University Hospital Inselspital Bern. Insulin was measured by an electrochemiluminescence sandwich immunoassay (Modular E170; Roche), glucose by enzymatic determination with hexokinase (Modular P800; Roche), high-sensitivity CRP with an immune turbidimetric test enhanced with latex particles (Modular P800; Roche), TAG with the GPO-PAP method (Modular P800; Roche), cholesterol with the CHOD-PAP method (Modular P800; Roche), and HDL-cholesterol with an enzymatic test for direct quantitative determination (Modular P800; Roche). Plasma for IL-6, TNF-α and endotoxin determination was separated by centrifugation (2000 g for 10 min), split into Eppendorf tubes, frozen at − 20°C and stored at − 80°C until later analysis. IL-6 and TNF-α concentrations were measured with a high-sensitivity multiplex cytokine assay (Bio-Plex® System; Bio-Rad). The sensitivity of the kit, as provided by the manufacturer, was 0·2 pg/ml. The intra-assay CV was 5 %, and the inter-assay CV was 10 %. Endotoxin was measured with a commercially available QCL-1000 LAL EndPoint Assay (Lonza). This assay has previously been validated for human serum. It showed an intra-assay CV of 3·9 (sd 0·5) % and an inter-assay CV of 9·6 (sd 0·8) %. Recovery rate for spiked endotoxin was 82·0 (sd 3·3) %( Reference Creely, McTernan and Kusminski 22 ).
Statistical analyses
Statistical analyses were performed using Systat 13.0 (Systat Software, Inc.) and R version 2.15.2 (R Foundation for Statistical Computing)( 23 ) with the R package non-parametric longitudinal data (nparLD) and R package R Commander. Sample size was estimated with a power analysis for a 2 × 2 cross-over design( Reference Jones and Kenward 24 ) based on the data of a previous study with high-fat meals( Reference Schwander, Kopf-Bolanz and Buri 12 ). For a desired significance level of P≤ 0·05 and 80 % power to detect a within-subject difference of 1·265 pg/ml for IL-6 (primary endpoint), a sample size of eighteen was necessary.
Data are presented as means and standard deviations, unless otherwise indicated. The R package nparLD, function ld.f1, was applied to compare values at time points 1, 2, 4 and 6 h with baseline values. To evaluate the overall response of metabolic parameters during the 6 h postprandial period, the net incremental AUC (net iAUC) was calculated. The net iAUC subtracts the negative iAUC from the positive iAUC, which are the areas of excursion below and above the baseline values, respectively, by using the trapezoid method. To investigate whether there was an overall significant postprandial effect, the following null hypothesis was tested by Wilcoxon signed-rank test H 0: net iAUC = 0. The net iAUC was chosen to minimise biologically irrelevant deviations from the baseline values that would otherwise be taken into consideration by calculating only the positive iAUC( Reference Schwander, Kopf-Bolanz and Buri 12 ). Wilcoxon signed-rank tests were also used on the net iAUC values for the pairwise comparison of the three test meals. Changes in the concentrations of IL-6, TNF-α and endotoxin between baseline and 6 h were calculated by subtracting fasting concentrations from values at 6 h. The R package nparLD was applied to compare these values. Since previous investigations suggested differences in the postprandial metabolic and inflammatory response of subjects with higher and lower BMI, study participants were grouped by BMI ( ≤ 25 v. >25 kg/m2) for further statistical analyses. The robust non-parametric Kruskal–Wallis test was used to evaluate differences between the test meals and between the BMI subgroups for significance. Differences were considered statistically significant at P≤ 0·05.
Results
In total, twenty-one subjects were enrolled in the present study. Of these, one subject withdrew after the first study day because of scheduling conflicts, and one subject was retrospectively excluded due to hypercholesterolaemia; thus, a final sample of nineteen subjects were included in the analysis. Study participants were males with a mean age of 41·8 (sd 9·0) years and a mean BMI of 27·1 (sd 8·2) kg/m2. Fasting concentrations of blood parameters before each meal are presented in Table 2. There were no differences in these parameters between the test meals.
Table 2 Fasting concentrations of blood parameters before each meal* (Mean values and standard deviations)
HFC meal, high-fat non-dairy control meal; HFD meal, high-fat dairy meal; HFM meal, high-fat non-dairy meal supplemented with milk; CRP, C-reactive protein; EU, endotoxin units.
* There were no significant differences in baseline variables between the test meals.
† To convert insulin in mU/l to pmol/l, multiply by 6·945.
The subgroup with BMI ≤ 25 kg/m2 included eleven participants with a mean age of 39·7 (sd 10·5) and a mean BMI of 22·4 (sd 1·6) kg/m2. The subgroup with BMI >25 kg/m2 included eight participants with a mean age of 44·7 (sd 5·8) years and a mean BMI of 33·6 (sd 9·3) kg/m2.
Fig. 1 shows the mean changes in the metabolic parameters after consumption of the three meals, over 6 h. Detailed information can be found in online Supplementary Table S1. Insulin significantly increased at 1 h after intake of all the test meals and decreased to below baseline values at 6 h. Glucose showed the same pattern, but increases at 1 h were significant only after the intake of the HFD and HFM meals. Furthermore, TAG significantly increased in the 4 h period following ingestion of the three test meals. In contrast, LDL- and HDL-cholesterol significantly decreased in the same time period. The mean net iAUC of glucose, insulin, total cholesterol, LDL- and HDL-cholesterol, total cholesterol:HDL-cholesterol, LDL-cholesterol:HDL-cholesterol, TAG and CRP for each meal are presented in Table 3. A significantly lower net iAUC was shown for TAG, and a significantly higher net iAUC was shown for CRP, after ingestion of the HFD meal compared with the HFM meal (P= 0·02, for both). There were no other significant differences in metabolic parameters between the three meals. No meal effect on the net iAUC was detected within the two BMI subgroups for any metabolic parameter (data not shown).
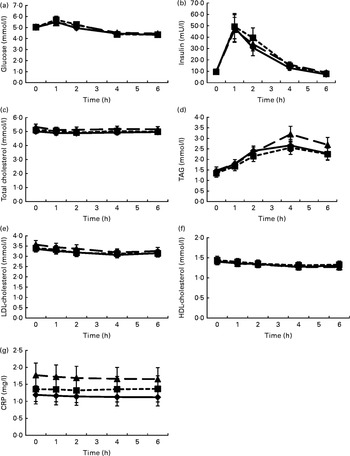
Fig. 1 Postprandial changes in the investigated metabolic parameters (glucose (a), insulin (b), total cholesterol (c), TAG (d), LDL-cholesterol (e), HDL-cholesterol (f) and C-reactive protein (CRP) (g)) after the three meals. Postprandial kinetics of healthy male subjects in response to the ingestion of a high-fat non-dairy control meal (–♦–), a high-fat dairy meal (- -■- -) and a high-fat non-dairy meal supplemented with milk (–▲–). Values are means, with their standard errors represented by vertical bars. To convert insulin in mU/l to pmol/l, multiply by 6·945.
Table 3 Postprandial effects of the three test meals on blood parameters expressed as net incremental AUC (Mean values and standard deviations)
HFC meal, high-fat non-dairy control meal; HFD meal, high-fat dairy meal; HFM meal, high-fat non-dairy meal supplemented with milk; CRP, C-reactive protein
a,bMean values within a row with unlike superscript letters were significantly different (P≤ 0·05).
Mean value was significantly different from zero: * P≤ 0·05, ** P≤ 0·01, *** P≤ 0·001.
† To convert insulin in mU/l to pmol/l, multiply by 6·945.
Mean changes in IL-6, TNF-α and endotoxin concentrations between baseline and 6 h for each meal are presented in Table 4. IL-6 increased at 6 h after ingestion of all the three test meals, although this increase was only significant after the HFC and HFD meals, not after the HFM meal. Also, alterations in IL-6 did not differ between the three test meals. TNF-α concentration decreased after ingestion of all the three test meals, but was only significantly lower in the HFD meal at 6 h compared with baseline values (see online Supplementary material). A significant reduction in TNF-α concentration after the HFD meal was observed in the subgroup of subjects with BMI ≤ 25 kg/m2. In this subgroup, a significant (P= 0·02) difference between the three meals was observed with a greater decrease in TNF-α concentration after the HFD meal ( − 0·68 pg/ml) compared with the other two meals (HFC meal: − 0·16 pg/ml, HFM meal: − 0·29 pg/ml). This effect was not found in the subgroup of subjects with BMI>25 kg/m2. Finally, endotoxin concentration significantly increased between baseline and 6 h after ingestion of all the three test meals; however, the magnitude of these increases did not differ between the three test meals.
Table 4 Effects of the three test meals on changes in blood parameters from baseline to 6 h (Mean values and standard deviations)
HFC meal, high-fat non-dairy control meal; HFD meal, high-fat dairy meal; HFM meal, high-fat non-dairy meal supplemented with milk; EU, endotoxin units.
Mean value was significantly different from zero: ** P≤ 0·01, *** P≤ 0·001.
Discussion
The aim of the present study was to investigate the effect of dairy products on metabolic and inflammatory responses to a high-fat meal. Specifically, we examined whether the HFD meal results in a lower postprandial inflammatory response than does the HFC meal, and whether the addition of milk to the HFC meal yields a lower inflammatory response than does the HFC meal alone. The differences identified between the three meals were inconsistent and of small magnitude. In the HFC meal, IL-6 was significantly increased, TNF-α did not show significant differences and CRP was significantly decreased at 6 h compared with baseline. In the HFD meal, IL-6 was significantly increased, TNF-α was significantly decreased and CRP was not different at 6 h compared with baseline. In the HFM meal, IL-6 and TNF-α did not show significant differences and CRP was significantly decreased at 6 h compared with baseline. In agreement with the low magnitude of these changes in pro-inflammatory markers, there were no statistically significant differences between the three test meals. Thus, we conclude that the HFD and HFM meals were comparable with the HFC meal in regard to postprandial inflammation. The two questions presented in the introduction (does a high-fat meal composed of dairy products induce a lower postprandial inflammatory response than a comparable non-dairy high-fat meal? and does the addition of milk reduce the inflammatory response of a non-dairy high-fat meal?) were thus not affirmed by the study.
Although no significant differences between the test meals were detected, the results within groups suggest that in contrast to cheese and butter, whole-fat milk may have a positive effect on postprandial inflammation induced by a high-fat meal because none of the three inflammatory cytokines was significantly increased after the HFM meal, although it had 30 % higher energy content compared with the HFC meal. Congruently, in the investigation by Nestel et al. ( Reference Nestel, Pally and MacIntosh 21 ), the intake of low-fat milk but not cheese in a high-fat meal with comparable energy resulted in significantly decreased IL-6 and TNF-α concentrations. In contrast, butter, which was also part of our HFD meal, also decreased IL-6, TNF-α and CRP concentrations in the study by Nestel et al. ( Reference Nestel, Pally and MacIntosh 21 ). However, a comparison of the findings is difficult because their results were documented at 3 h but not at 6 h after meal intake. The fasting IL-6 and TNF-α concentrations in overweight participants in the study by Nestel et al. ( Reference Nestel, Pally and MacIntosh 21 ) were much higher than those observed in the present study (online Supplementary Table S1). In that context, Schwander et al. ( Reference Schwander, Kopf-Bolanz and Buri 12 ) reported that, apart from insulin, an energy dose–response relationship was necessary to differentiate the postprandial metabolic response of obese subjects from that of normal-weight subjects. Studies aimed at quantitatively differentiating the acute response of human subjects to the ingestion of different foods should thus take several key factors into account, in particular the energy dose–response effects of the ingested meal and the detailed kinetics of the postprandial response.
Since several studies have suggested an anti-inflammatory effect of dairy products( Reference Labonté, Couture and Richard 20 ), it remains to be clarified why the HFD meal did not exert a positive effect in regard to the postprandial inflammatory response and why full-fat milk may yield deviating results. Dietary components such as Ca and dairy proteins have been suggested as causes of the anti-inflammation effect of dairy products. In a mouse study, high-Ca and milk diets suppressed the gene expression of inflammatory cytokines (IL-6 and TNF-α) in adipose tissue compared with a basal diet( Reference Zemel and Sun 25 ). However, in the present study, Ca intake (Table 1) did not correlate with inflammatory markers, as Ca intake was highest with the HFD meal. Furthermore, the milk protein lactoferrin has been shown to modulate the inflammatory process by influencing the recruitment and activation of cytokine-releasing immune cells( Reference Legrand 26 ). In an in vitro study with bovine lactoferrin and lactoferricin, the latter being a bactericidal pepsin-derived fragment of the former, both proteins suppressed the release of IL-6 by human monocytic cell lines stimulated with lipopolysaccharide. Lactoferricin was even more potent than lactoferrin, and the inhibition was stronger, when the suppressors were added before the stimulation with lipopolysaccharide( Reference Mattsby-Baltzer, Roseanu and Motas 27 ). Lactoferrin is found in milk but not in cheese because it is lost with the whey during the cheese production process. Therefore, lactoferrin and its fragments in milk may be responsible for mitigating the inflammatory response to the HFM meal compared with the HFD meal. A reason for the inflammatory response after the consumption of the HFD meal might be the choice of cheese. Subsequent analyses of Tête de Moine cheeses that were part of the HFD meal revealed, in most samples, rather high concentrations of biogenic amines (mean 891 (sd 194) mg/kg), especially histamine and tyramine. Histamine was found to enhance the secretion of various pro-inflammatory cytokines, including IL-6 and TNF-α, over the H4R receptor in human mast cells( Reference Jemima, Prema and Thangam 28 ). The first intolerance symptoms can occur with ingestion of 10–50 mg histamine( Reference Weiss 29 ). Since the HFD meal contained on average 58·5 mg histamine, this may have abolished the potential positive effects of other dairy constituents.
Endotoxin (bacterial lipopolysaccharide) in the circulation activates the immune system and is recognised as a main trigger for the inflammatory response. In animal and human studies, lipopolysaccharide concentrations correlated with fat consumption( Reference Schwander, Kopf-Bolanz and Buri 12 , Reference Harte, Varma and Tripathi 30 , Reference Moreira, Texeira and Ferreira 31 ). Therefore, the pro-inflammatory effect of high-fat meals may be linked to the translocation of endotoxin from the gut into the circulation. In the present study, significantly (P< 0·001) increased endotoxin concentrations were measured at 6 h after all the three high-fat meals with no difference between the meals (Table 4), although the HFM meal had a slightly higher fat content. The percentage of endotoxin increase over the baseline values in the present study is similar to the findings of previous studies of healthy males consuming 3766 kJ (900 kcal) of a high-fat meal( Reference Ghanim, Sia and Upadhyay 13 , Reference Erridge, Attina and Spickett 32 ).
High postprandial TAG values have been shown to induce higher numbers of circulating inflammatory cells, as well as to activate them, thus promoting a systemic pro-inflammatory status( Reference Klop, Proctor and Mamo 3 , Reference van Oostrom, Rabelink and Verseyden 33 ). Glucose increases the expression of inflammatory parameters such as TNF-α and IL-6, whereas insulin has anti-inflammatory effects( Reference Sun, Li and Gao 34 ). Therefore, the metabolic effects of meals are important components in postprandial inflammation. The metabolic response documented in the present study is comparable with other reports( Reference Schwander, Kopf-Bolanz and Buri 12 , Reference van Meijl and Mensink 35 , Reference Clemente, Mancini and Nazzaro 36 ). Insulin and glucose increased in the first hour after meal intake and then decreased to below baseline values at 6 h. TAG increased in the 4 h following the three test meals, whereas LDL- and HDL-cholesterol decreased in the same period. With the exception of TAG, the net iAUC of all metabolic parameters did not significantly differ between the meals, which is probably due to the matching macronutrient composition of the test meals. The net iAUC of TAG was significantly higher in the HFM meal than in the HFD meal, but not in the HFC meal. Since the amount of fat intake has an impact on postprandial TAG concentration( Reference Dubois, Beaumier and Juhel 37 , Reference Lopez-Miranda, Williams and Lairon 38 ), the elevated fat content of the HFM meal may be the reason for the significantly higher net iAUC. However, the net iAUC was only significantly different compared with the HFD meal, not with the HFC meal. Therefore, an additional factor may be involved. One reason might be that the high Ca content of a meal promotes faecal fat excretion through the binding of Ca to fatty acids in the intestine( Reference Zemel 39 , Reference Denke, Fox and Schulte 40 ). The HFD meal had the highest Ca concentration of the three test meals (HFD: 924 mg, HFC: 73 mg, HFM: 525 mg). In addition, the HFD meal contained dairy fat with substantial amounts of SCFA and medium-chain fatty acids that have a limited effect on postprandial TAG concentration( Reference Lopez-Miranda, Williams and Lairon 38 ). Both factors may explain the marginally lower net iAUC of TAG compared with the HFC meal, eventually adding up to a significant difference compared with the HFM meal.
Previous studies have reported a positive correlation between endotoxin and TAG levels after ingestion of high-fat meals( Reference Schwander, Kopf-Bolanz and Buri 12 , Reference Harte, Varma and Tripathi 30 , Reference Clemente-Postigo, Queipo-Ortuno and Murri 41 ) and a consequential elevation of inflammatory markers such as IL-6( Reference Moreira, Texeira and Ferreira 31 ). We have confirmed these observations in the present study, as the increase in plasma endotoxin concentration 6 h after consumption of the high-fat meals significantly and positively correlated (r 2 0·62) with the increase in TAG concentration over the same period of time (data not shown). However, despite a significantly higher postprandial net iAUC of TAG for the HFM meal than for the HFD meal, the inflammatory cytokine and endotoxin concentrations were not significantly increased by the co-ingestion of milk with the HFC meal. This fact supports the above-mentioned hypothesis: other factors, such as lactoferrin and lactoferricin, could suppress, or at least mitigate, the endotoxin-induced release of inflammatory markers such as IL-6.
Using an indwelling venous catheter for blood sampling may have influenced postprandial IL-6 results. Several studies have suggested that indwelling catheters may time-dependently cause increases in IL-6 concentrations due to local inflammatory response( Reference Dixon, Hurst and Talbot 42 – Reference Haack, Kraus and Schuld 45 ). However, Mohamed-Ali et al. ( Reference Mohamed-Ali, Goodrick and Rawesh 46 ) found no significant blood-sampling effect on IL-6 concentrations comparing indwelling catheter and repeated venepuncture, and another study found no postprandial increase in IL-6 concentrations despite the use of a catheter( Reference Hansen, Sickelmann and Pietrowsky 47 ). Additionally, Schwander et al. ( Reference Schwander, Kopf-Bolanz and Buri 12 ) demonstrated a dose–response of postprandial IL-6 on energy intake with high-fat meals using an indwelling venous catheter. Thus, there are more influencing factors on postprandial IL-6 concentrations than only local inflammation, and diet seems one of them. Although the postprandial IL-6 concentrations may have to be looked at with caution, comparing IL-6 response between meals should not be hampered.
The age range of the participants was quite wide (25–55 years). However, comparing the data of participants aged between 25 and 40 years with participants aged between 41 and 55 years did not show significant differences in metabolic and inflammatory responses, except for glucose levels that were overall higher in the older age group. Since the study was not laid out to investigate age-related differences between meals, subgroups were too small for further statistical evaluation.
To our knowledge, the present study is the first to compare the influence of high-fat dairy and non-dairy meals on postprandial inflammatory response. However, the study has some limitations that need to be addressed. First, postprandial blood sampling started at 1 h after test meals, which might be too late for observing certain metabolic reactions. For example, van Meijl & Mensink( Reference van Meijl and Mensink 35 ) documented maximally increased glucose concentrations at 15 and 30 min after different test meals. This early response was missed in the present study. However, glucose concentration was not our main parameter, and starting at 1 h or even 2 h postprandially is common( Reference Ghanim, Sia and Upadhyay 13 , Reference Clemente, Mancini and Nazzaro 36 , Reference Blackburn, Despres and Lamarche 48 ). Second, only male subjects were enrolled in the study, to avoid confounding effects of the female menstrual cycle. Third, IL-6, TNF-α and endotoxin concentrations were determined only at 0 and 6 h. However, Schwander et al. ( Reference Schwander, Kopf-Bolanz and Buri 12 ) did not find significant differences in the values between time points 2, 4 and 6 h for these parameters. The time point 6 h after meal should therefore adequately reflect the postprandial response. Fourth, the energy content of the test meals differed; however, this had the advantage that the dose–response effect documented in the previous study( Reference Schwander, Kopf-Bolanz and Buri 12 ) did not distort the results. Finally, Schwander et al. ( Reference Schwander, Kopf-Bolanz and Buri 12 ) reported that apart from insulin, an energy dose–response relationship was necessary to differentiate the postprandial metabolic responses of obese subjects from the responses of normal-weight subjects. Thus, we cannot exclude that an energy dose–response design would have allowed better differentiation of the metabolic and inflammatory responses of the subjects to the three high-fat meals investigated. Such complex designs remain, however, impracticable in cross-over studies, as the number of meals to be ingested by subjects under controlled conditions would dramatically increase. An alternative approach that we are currently taking is to broaden the scope of blood-derived markers that are measured postprandially, by implementing metabolomic and transcriptomic analytical strategies.
In conclusion, the present study indicates that the ingestion of dairy products does not have a positive impact on postprandial inflammation compared with an isoenergetic high-fat non-dairy meal and neither does the addition of full-fat milk to a high-fat meal.
Supplementary material
To view supplementary material for this article, please visit http://dx.doi.org/10.1017/S0007114515000677
Acknowledgements
The authors thank Marie-Jeanne Voirol (CHUV, Lausanne, Switzerland) for measuring TNF-α and IL-6 concentrations.
The present study was part of the NutriChip project, which was financially supported by the Swiss Federal Program NanoTera.ch. G. V. is a member of COST FA 1005 INFOGEST ‘Improving Health Properties of Food by Sharing our Knowledge on the Digestive Process’.
The authors' responsibilities were as follows: G. V. conceived the research programme with input from M. A. M. G.; A. S. designed the study with input from B. W., D. G., M. C., K. L. and G. V.; A. S., N. P., B. W. and D. G. planned and conducted the study, including the randomisation procedure, the enrolment of the subjects and their assignment to the interventions; K. L. provided the infrastructure for the intervention study; P. G. M. designed and conducted the endotoxin analyses; N. V. and F. P. P. designed and conducted the TNF-α and IL-6 analyses; W. L. and U. B. conducted the statistical analyses; A. S., U. B. and G. V. analysed the data and the statistical reports; A. S. wrote the paper. All authors read, commented and approved the final manuscript.
The authors declare that they have no conflict of interest.


 Open access