


Naringenin is the predominant flavanone found in citrus fruit and tomato, and an important compound in the human diet. Like other flavanones, it shows antioxidant, anti-inflammatory and anticarcinogenic activity, and the capacity to diminish blood lipids and cholesterol after oral administration( Reference Xu, Kulkarni and Singh 1 ). An inhibitory effect of naringenin on the hepatitis C virus has also been reported( Reference Yoshimura, Sano and Kamei 2 ). A growing awareness of these properties, together with its great abundance in our diet, has stimulated interest in naringenin. The benefits for human health attributed to polyphenols in general and to naringenin in particular depend on their oral bioavailability( Reference Felgines, Texier and Morand 3 , Reference Chabane, Al Ahmad and Peluso 4 ). However, the oral bioavailability of naringenin is very low, being less than 10 %( Reference Xu, Kulkarni and Singh 1 ). One of the major factors influencing bioavailability is the absorption/permeability of the compound through the gastrointestinal tract. If ingested in a solid state, its solubility in physiological fluids could be a limiting factor for the rate and extent of absorption( Reference Amidon, Lennernäs and Shah 5 ). Moreover, two products with the same intestinal permeability could present differences in absorption due to variable dissolution in vivo. In this respect, ethanol at high concentration (>30 % v/v) was shown to enhance the absorption of quercetin in rats( Reference Azuma, Ippoushi and Ito 6 ). Consequently, bioavailability essentially depends not only on the permeability of the compound through the gastrointestinal tract, but also on the elimination process by excretion and/or intestinal and hepatic metabolism, as well as the effect of microbial enzymes on these processes. An in-depth study of these processes could help to determine whether the benefits of naringenin for human health can be attributed to bioavailable naringenin or to its derived metabolites.
Flavonoids participate in both enteric and enterohepatic recycling: the former is enabled by enteric excretion of phase II conjugates, whereas the latter involves the hepatic excretion of the conjugates into the bile. Both recycling processes require efflux transporters such as multidrug resistance-associated protein 2 (MRP-2)( Reference Xu, Kulkarni and Singh 1 ) and bacterial enzymes that can hydrolyse the conjugates to regenerate the aglycons, which are then reabsorbed and recycled into the systemic circulation. In this context, the study of the influence of the microbiota on the disposition of naringenin is of great interest. Chabane et al. ( Reference Chabane, Al Ahmad and Peluso 4 ) elucidated the intestinal transport mechanism of naringenin and quercetin by means of an in vitro study (Caco-2 cells), but there is little information on the effect of intestinal metabolism on naringenin bioavailability. An attempt to shed light on this was made by Xu et al. ( Reference Xu, Kulkarni and Singh 1 ), whose study in rats was centred on the glucoronidation pathway, providing no information about sulfates. Moreover, according to Jeong et al. ( Reference Jeong, Jia and Hu 7 ), mice are more suitable animals for studying the disposition of naringenin, since the amounts of flavonoid sulfates (especially at lower concentrations) excreted by rats are insignificant, while in mice they are of the same order as in human plasma and urine. Thus, the mouse intestinal perfusion model for compounds excreted as sulfates and glucuronides, including flavonoids, has significant advantages over the rat model. Moreover, Escribano et al. ( Reference Escribano, García Sala and Salamanca 8 ) found a good correlation (R 0·9631) between the mouse permeability coefficient of five model drugs in mice and the fraction of oral dose absorbed in human subjects, showing the capacity of this model to predict human absorption.
Based on these considerations, and given that naringenin is a dietary compound that can be ingested from different sources and/or matrices (e.g. juice, tomato sauce and high-fat diet), allowing absorption to start in the stomach and continue throughout the intestinal tract, the aims of the present study were: (1) to determine the solubility of naringenin under physiological pH conditions and its effective permeability coefficient (Peff) through the gastrointestinal tract, using an in situ single-pass perfusion technique in mice. As a model drug, and according to the Biopharmaceutics Classification System (BCS)( Reference Amidon, Lennernäs and Shah 5 ), naproxen was assayed as a high-permeability reference compound; (2) to evaluate the intestinal and hepatic first-pass effect through the detection and quantification of metabolites in the lumen, bile and plasma; (3) to study the influence of antibiotic treatment on the colonic permeability of naringenin and intestinal metabolism.
Materials and methods
Reagents and materials
Naringenin, naproxen, phloroglucinol, 3-phenylpropionic acid, (4-hydroxyphenyl) acetic acid, hippuric acid, quinic acid, rifaximin, phenol red, casein from bovine milk, l-cystine hydrochloride monohydrate, d,l-methionine, choline chloride and dextrin from maize starch were provided by Sigma-Aldrich; naringenin-4-O-glucuronide (NAR-GLU) and naringenin-7-O-glucuronide (NAR-GLU) were from Cayman Chemical Company; 3-(4-hydroxyphenyl) propionic acid was from Extrasynthese; Hegsted salt mixture and Vitamin Diet Fortification Mixture were purchased from Group Taper; span 20 (Sorbitan monolaurate) and sodium carboxymethylcellulose from Fagron; and refined maize oil, saccharine and saccharose were purchased from a supermarket. Reagents, ZnCl2, NaCl, sodium monohydrogen phosphate dehydrate, anhydrous disodium hydrogen phosphate, orthophosphoric acid and NaOH for analysis were provided by Panreac Química; and ethanol, methanol, acetonitrile and formic acid were purchased from Scharlau Chemie, S.A.
Animals and diet
Male CD1 mice (Harlan Interfauna Ibérica) weighing 30–35 g were used in the study. Mice were fed with a polyphenol-free diet for 7 d before the experiment to assure that the metabolites found in biological samples corresponded to the absorbed naringenin. The diet, based on Lieber et al. ( Reference Lieber, Leo and Mak 9 ), was isoenergetic with a multi-nutrient composition. It had the same fat content as the average ‘normal’ US diet, an amount recommended as ‘healthy’ by the Institute of Medicine, and provided sufficient vitamins and salts to prevent deficiencies in mice. The formulation contained sodium carboxymethylcellulose, which gives a semi-solid consistency that facilitates the homogeneous distribution of the components. The drinking-water was supplemented with ZnCl2 (16·3 mg/l) to ensure healthy levels of this salt. Mice were housed in groups of six in cages located in temperature-controlled rooms (22°C), with a dark period from 20:00 to 08:00 hours, and free access to food and water. Body weight was recorded on a daily basis. Their diet (700 g) was prepared twice a week.
The diet was analysed by HPLC-MS/MS to confirm the lack of naringenin and its metabolites. Extraction of the polyphenol compounds from the diet was performed in triplicate following the procedure described by Vallverdú-Queralt et al. ( Reference Vallverdú-Queralt, De Alvarenga and Estruch 10 ) with some modifications. Samples of 0·3 g were homogenised by adding 3 ml of 80 % (v/v) ethanol in Milli-Q water acidified with 0·1 % (v/v) formic acid; after sonication for 5 min and centrifugation (1484·7 g at 4°C) for 20 min (Centrifuge 5415R), the supernatant was transferred into a flask and the extraction was repeated once following the same parameters. Both supernatants were combined and evaporated under N2 flow and, finally, the residue was reconstituted with Milli-Q water (0·1 % formic acid) up to 1·2 ml, and filtered using PTFE 0·44–45 μm filters (Waters).
Analytical methods
HPLC-ESI-MS/MS analysis
All perfusion, plasma and bile samples were analysed by high-performance liquid chromatography/electrospray ionisation tandem mass spectrometry (HPLC-ESI-MS/MS). The liquid chromatograph was an Agilent series 1100 (Agilent) equipped with a thermostated autosampler and a column oven set to 30°C. This was coupled to an API 3000 triple-quadruple mass spectrometer (PE Sciex) with a turbo ion spray source, which was used to identify and quantify the corresponding phenolic metabolites. Separation was achieved using a Luna C18 column (50 × 2·0 mm; 5 μm) from Phenomenex using the following parameters: the mobile phase was H2O (A) and acetonitrile (B), with 0·1 % formic acid in both solvents. An increasing linear gradient (v/v) of B was used (t (min), %B), as follows: (0, 5); (2, 25); (10, 90); (11, 100); (12, 100); (17,5); (20,5), at a constant flow rate of 0·6 ml/min, and the injection volume was 20 μl. The turbo ion spray source was in negative mode with the following settings: capillary voltage, − 4500 V; nebuliser gas (N2), 10 (arbitrary units); curtain gas (N2), 12 (arbitrary units); and drying gas (N2) heated to 400°C. The declustering potential, focusing potential, collision energy and entrance potential (Table 1) were optimised to detect phenolic compounds with the highest signals, following the method described by Martínez-Huélamo and colleagues( Reference Martínez-Huélamo, Tulipani and Torrado 11 ). The system was controlled by Analyst version 1.4.2 software supplied by Applied Biosystems.
Table 1 HPLC-MS/MS settings for the phenolic compounds
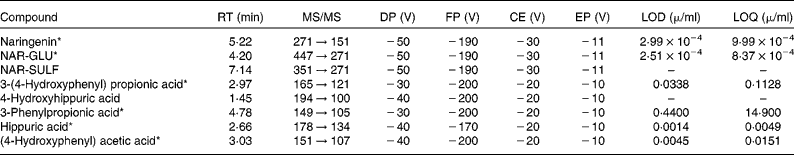
RT, retention time; DP, declustering potential; FP, focusing potential; CE, collision energy; EP, entrance potential; LOD, limit of detection; LOQ, limit of quantification; NAR-GLU, naringenin glucuronide; NAR-SULF, naringenin sulfate.
* Identified with standard.
Naringenin and the metabolites identified in the samples, together with their retention time, limit of detection and limit of quantification, are shown in Table 1.
The calibration curves for stability and perfusion samples were prepared in phosphate buffer (PBS) pH 2, 6·2 and/or 7·2, as appropriate for each experiment, and were linear over the concentration ranges 0·003–4 μg/ml (r>0·998) for naringenin and its metabolites by HPLC-ESI-MS/MS. For the plasma and bile samples, the standards were prepared in water containing 0·1 % (v/v) formic acid, as explained later. Metabolites were quantified by taking into account the limit of quantification. No commercial standards were available for 4-hydroxyhippuric acid and naringenin sulfate (NAR-SULF), so standards of similar structures were used for quantification: hippuric acid and unconjugated naringenin, respectively.
Isotonic phosphate buffers at pH 2, 6·2 and 7·2
The perfusion solutions (PBS) consisted of 9·2 g/l NaCl, 0·036 g/l NaH2PO4·2H2O and 0·058 g/l Na2HPO4. The buffer pH was adjusted to pH 2, 6·2 and/or 7·2 by adding orthophosphoric acid or NaOH. The PBS contained 3·5 μg/ml of naringenin and 0·1 mg/ml of phenol red( Reference Dahan, West and Amidon 12 ). The concentration of naringenin was chosen taking into account its concentration in raw tomato (5 mg/kg approximately) and the daily ingestion of tomatoes in a Mediterranean diet (0·5 kg in raw tomato, tomato juice and tomato sauce) for a 70-kg person. The dose was then downscaled for a mouse (30 g). However, the estimated concentration was then increased to 3·5 μg/ml, taking into account a potential decrease in concentration due to absorption and to be above the limit of quantification of the analytical method. The osmolality of the perfusion solutions was measured (Advanced® Model 3320 micro-osmometer; Advanced Instruments, Inc.).
Stability and solubility studies
The stability of naringenin in the PBS (pH 2, 6·2 and 7·2) was tested at 37°C. Six aliquots of the solutions were incubated at 37°C, and samples were taken at 0, 1, 2 and 3 h and stored at − 20°C until analysis.
The pH-solubility profile of naringenin was determined at 37 ± 1°C in aqueous media at pH values of 1, 2, 5·5, 6·2 and 7·2. An excess of solid product was placed in a 2·5-ml amber vial, 2 ml of medium was added, and the system was shaken at 37°C for 24 h. After confirming the presence of undissolved material, an aliquot was removed and filtered (0·45 μm) in a 37°C tempered vial. Then, 500 μl of the filtered solution was transferred to a new vial containing 50 μl of ethanol. Finally, the concentration of naringenin in each sample was measured by HPLC. Three replicate determinations of solubility were carried out at each pH.
Perfusion experiments
The studies were conducted following a protocol approved by the Animal Experimentation Ethics Committee of the University of Barcelona, Spain (trial no. CEEA 219/12).
Animals were monitored daily for body mass over a week to check that the diet was supplying enough nutrients and energy to maintain the growth curve( Reference Eisen 13 ).
Single-pass intestinal perfusion was performed in mice according to the method described by Escribano et al. ( Reference Escribano, García Sala and Salamanca 8 ), adapted for the stomach and colon. Six animals were used per biological segment (stomach, small intestine and colon), and in the case of the colon a separate group was also treated via gastric gavage with rifaximin (50 mg/kg per d for 5 d)( Reference Miglioli, Allerberger and Calabró 14 ). Rifaximin is a non-systemic antibiotic with a broad spectrum of antibacterial action used to reduce intestinal microbiota( Reference Scarpignato and Pelosini 15 ). In addition, in order to investigate whether naringenin is a flavonoid with high intestinal permeability, a further batch of animals was included in the study in which a solution of naproxen (2·15 μg/ml), as a model of a highly permeable compound, was also assayed in the small intestine.
Mice, fed with a polyphenol-free diet for 1 week, were fasted overnight with free access to water the day before the perfusion experiment. Anaesthesia was induced by a 100 mg/kg intraperitoneal injection of ketamine (Imalgene 1000; Merial Laboratories S.A.) and 10 mg/kg of xylazin (Rompun® 2 %, Bayer S.L.). Mice were placed on a homeothermic blanket to maintain their body temperature at 37°C. The abdomen was opened by a midline longitudinal incision, and the biliary duct was tied to avoid enterohepatic recycling. Then, the stomach (from the fundus to the pylorus), small intestine (starting from the duodenum, approximately 10–15 cm length) or the colon (approximately 2 cm length) were isolated. Two glass cannula (outer diameter 3 mm, inner diameter 2 mm; Duran®, Vidrafoc) were inserted at the proximal and distal ends of the segment. The segment was gently rinsed with PBS pH 2, 6·2 or 7·2 (respectively) to remove the contents until the outlet solution appeared clear. Amber latex tubing (inner diameter 3 mm) was then connected to the inlet cannula, and a perfusion pump (Minipuls3, M312 model; Gilson, Inc.) was placed between the perfusate reservoir and the inlet cannula. Saline was dripped onto the surgical area, which was then covered with gauze to avoid dehydration. The experiment started by delivering the perfusion solution containing naringenin and phenol red at a flow rate of 0·20 ml/min (0·16 ml/min for the stomach) to the tubes and intestinal segment. The outflow perfusate was collected in 1·5-ml amber eppendorfs at 10-min intervals for 60 min. The first sample was taken 5 min after the start of continuous outlet flow from the intestine and through the distal cannula. Samples were centrifuged (7516·3 g for 10 min at 4°C) (Centrifuge 5415R) and 650 μl aliquots of the supernatant were spiked with 50 μl of ethanol to avoid precipitation of naringenin at lower temperatures and were then stored frozen (–80°C) until analysis. At 60 min, a blood sample was obtained via cardiac puncture, the gallbladder was collected and the length of the intestinal segment was measured. Bile samples from four to six mice were pooled and stored with all samples at − 80°C until analysis by HPLC-MS/MS.
Solid-phase extraction of polyphenols from plasma and bile samples
On the day of analysis by HPLC-ESI-MS/MS, plasma and bile samples were defrosted and centrifuged (7516·3 g for 10 min at 4°C). An exact volume of supernatants was transferred into an amber eppendorf and diluted to 1 ml with water containing 0·1 % (v/v) formic acid. An Oasis® HLB 30-μm (30 mg) 96-well plate (Waters) was activated by consecutively adding 1 ml of methanol and 1 ml of 1·5 m formic acid in water. The samples were loaded onto the plate, and cleaned up by adding 1 ml of 1·5 m formic acid, followed by 1 ml methanol:water ratio (5:95). Phenolic metabolites were then eluted with 1 ml of methanol acidified with 0·1 % formic acid (v/v). The eluted fraction was evaporated to dryness (Techne) at room temperature under a stream of N2, and reconstituted with 100 μl of water containing 0·1 % (v/v) formic acid( Reference Tulipani, Martinez-Huelamo and Rotches Ribalta 16 ). All procedures were performed in a darkened room with a red safety light to avoid oxidation of the analytes.
Data analysis
Peff were calculated from the steady-state concentrations of naringenin in the collected perfusate, according to equation 1( Reference Varma and Panchagnula 17 ) after correcting the outlet concentration according to the phenol red method( Reference Zakeri-Milani, Valizadeh and Tajerzadeh 18 , Reference Sutton, Rinaldi and Vukovinsky 19 ) (equation 2).
 $$Peff = \frac { - \phi _{in}}{2 \pi RL } Ln \frac { C _{in}}{ C _{out.cor}} $$
where ϕin is the flow rate (0·20 and 0·16 ml/min for the stomach), C in and C out.cor are the respective inlet and corrected outlet steady-state concentrations (equation 2), R is the radius of the mouse gastrointestinal segment (0·1 cm for small intestine( Reference Japar, Wu and Hu 20 , Reference Incecayir, Tsume and Amidon 21 ), 0·14 cm for colon( Reference Masaoka, Tanaka and Kataoba 22 )); and in the case of the stomach, R was calculated assuming it to have the shape of a cylinder with a volume of 0·4 ml( Reference McConnell, Basit and Murdan 23 ), and according to equation 3, L is the length of gastrointestinal segment after completion of the perfusion experiment.
 $$ C _{out.cor} = C _{out}\times \frac {CPR_{in}}{CPR_{out}} $$
where C out is the concentration of naringenin in the perfusate at the specified time interval, CPRin is the phenol red concentration in the inlet buffer solution and CPRout is the phenol red concentration at the specific time interval.
 $$ R = \sqrt {\frac {0.4}{ \pi L }} $$
The Peff was determined in four to five mice at between four and six steady-state outlet concentrations, and expressed as means and standard deviations.
The percentage absorption (% abs) was calculated according to equation 4( Reference Komiya, Park and Kamani 24 ) and the results were expressed as means and standard deviations.
 $$\%\,abs = \left [1 - e ^{\frac {2 \pi RL }{ \phi _{in}}Peff}\right ]\times 100 $$
Naringenin and metabolites were analysed in the collected perfusate at 10-min intervals. For the main metabolites, a linear trapezoidal method was used to calculate the area under the lumen concentration curve AUC (normalised by the inlet perfusion concentration of naringenin) from time zero until the last sample, using the WinNonlin® software version 6.3 (2012 Certara, L.P.). AUC values were expressed in min.
In perfusate (60 min), plasma and bile samples, the percentage of each metabolite with respect to the inlet naringenin perfusion solution (C in) was calculated according to equation 5:
 $$\%\, C _{met} = ( C _{met}\times 100)/ C _{in} $$
where C met is the concentration of each metabolite in the sample.
Statistical analysis
The estimated concentrations at a range of times in the stability study were compared using a parametric statistical assay (ANOVA), followed by a Scheffe test, where appropriate.
The Peff and percentages of absorption in the small intestine and colon were compared by means of Student's t test after verifying their normal distribution (Kurtosis normality of residuals) and the homogeneity of variance (modified – Levene equal – variance test). The same test was applied to study the influence of antibiotic treatment on the absorption of naringenin in the colon (comparison made between the control group and the group treated with rifaximin) (Table 2).
Table 2 Naringenin effective permeability coefficients (Peff) and percentage of absorption in each gastrointestinal segment (Mean values and standard deviations)
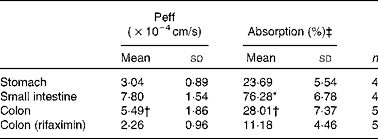
n, Number of replicates.
* Mean value was significantly different from that for colon segments (P< 0·05; Student's t test).
† Mean value was significantly different from that for rifaximin-treated colon segments (P< 0·05; Student's t test).
‡ Absorption for 10 cm in the small intestine and 2 cm in the colon.
The amount of NAR-GLU and NAR-SULF (expressed as AUC) in the lumen in each gastrointestinal segment, and their percentages (60 min) in the lumen, bile and plasma in the two groups were compared using the Mann–Whitney U test, after rejecting their normal distribution and the homogeneity of variance (Fig. 2 and Table 3, respectively).
Table 3 Percentage of naringenin sulfate (NAR-SULF) and naringenin glucuronide (NAR-GLU) in perfusate (60 min), bile and plasma in the three gastrointestinal segments (Mean values and standard deviations)
ND, not detected.
* Mean value was significantly different from that for small intestine segments (P< 0·05; Mann–Whitney U test).
† Mean value was significantly different from that for colon segments (P< 0·05; Mann–Whitney U test).
The mean AUC of the colonic metabolites in the control and rifaximin-treated groups (Table 4) was compared by the Kruskal–Wallis one-way ANOVA followed by the Kruskal–Wallis multiple-comparison Z test, after rejecting their normal distribution and the homogeneity of variance. Moreover, to determine differences in metabolites between the two groups (control and rifaximin-treated), the data were analysed using Student's t test.
Table 4 AUC of the metabolites in colonic lumen in control mice and in mice treated with rifaximin (Mean values and standard deviations)

NAR-GLU, naringenin glucuronide; NAR-SULF, naringenin sulfate.
* Mean value was significantly different from that for NAR-SULF (P< 0·05; Kruskal–Wallis Z test).
† Mean value was significantly different from that for NAR-GLU (P< 0·05; Kruskal–Wallis Z test).
‡ Mean value was significantly different from that of the control group (P< 0·05; Student's t test).
In all cases, the level of significance was 5 % (P< 0·05) and NCSS97 statistical software was used.
Results
Suitability of the diet
Three aliquots of the polyphenol-free diet were analysed by HPLC-ESI-MS/MS after polyphenol extraction, modifying the method used by Vallverdú-Queralt et al. ( Reference Vallverdú-Queralt, Regueiro and Martinez-Huelamo 25 ). The chromatograms showed the absence of naringenin, naringenin-metabolites and other polyphenols. The body weight of the animals on the polyphenol-free diet remained steady.
Stability and solubility studies
Fig. 1(a)–(c) shows the naringenin stability at the pH of the absorption studies. Naringenin was stable at pH 2 for 3 h at 37°C (P= 0·716), whereas at pH 6·2 and 7·2 it was only stable for 2 h.

Fig. 1 Mean concentrations of naringenin (C) in the perfusion buffers v. time in the stability assay at pH 2 (a), pH 6·2 (b) and pH 7·2 (c); and the pH-solubility profile of naringenin (d). Values are means and standard deviations represented by vertical bars. *Mean value is significantly different from that at time 0 (P< 0·05).
Fig. 1(d) shows the pH-solubility profile of naringenin in the pH range studied. The solubility increased with the pH according to the acidic nature of the compound, and ranged between 22·88 (sd 0·60) μg/ml at pH 1 and 46·86 (sd 0·38) μg/ml at pH 7·2.
In situ absorption studies of naringenin in the stomach, small intestine and colon
The Peff and the absorption percentage in mice using an in situ single-pass perfusion technique for each intestinal segment are shown in Table 2. Also included are the results of naringenin absorption in the colon after treatment with the antibiotic rifaximin.
The highest permeability was obtained in the small intestine (Peff = 7·80 (sd 1·54) × 10–4cm/s), followed by the large intestine (Peff = 5·49 (sd 1·86) × 10–4cm/s), while the lowest was in the stomach (Peff = 3·04 (sd 0·89) × 10–4cm/s).
The percentage of naringenin was highest in plasma samples from a small intestine perfusion assay (29·10 (sd 6·72) %), being lower in the colon samples (0·68 (sd 0·19) %), while none was found in the stomach samples. Naringenin was not excreted into the bile intact.
Regional differences in naringenin metabolism
The mean areas and standard deviations under the lumen concentration curve (AUC) from time zero until the last sample of the metabolites NAR-GLU and NAR-SULF are shown in Fig. 2. Results of the statistical analysis are also included. It should be noted that the units of the area are min (and the concentration units cancel out) due to the normalisation of the metabolite concentration by the inlet concentration of naringenin. The highest significant (P< 0·05) levels of metabolites were observed in the small intestine, followed by the colon. In both intestinal regions, the main metabolite was NAR-SULF. In the stomach, higher levels of NAR-GLU v. NAR-SULF were obtained.

Fig. 2 Area under the lumen concentration curve of naringenin glucuronide (NAR-GLU) and naringenin sulfate (NAR-SULF) in stomach, small intestine and colon (n 6, 4 and 6, respectively). Values are means and standard deviations represented by vertical bars. *Mean value is significantly different from that of colon (P< 0·05). †Mean value is significantly different from that of small intestine (P< 0·05).
In Table 3, the mean percentages and standard deviations of each phase II metabolite at 60 min in perfusate, bile and plasma are shown. In general, a higher percentage of NAR-GLU was observed in plasma v. perfusate for the three gastrointestinal segments. NAR-SULF was not detected in plasma, and neither metabolite was found in the bile.
Effects of the antibiotic treatment on the absorption and metabolism of naringenin
Effects of the antibiotic treatment on naringenin absorption are shown in Table 2. As can be observed, the pretreatment with rifaximin reduced (P< 0·05) the Peff of naringenin in the large intestine (5·49 (sd 1·86) × 10–4cm/s v. 2·26 (sd 0·96) × 10–4cm/s in control mice and pretreated animals, respectively). Table 4 shows the naringenin metabolites in the colonic lumen, and Table 5 includes the metabolites found in the bile and plasma.
Table 5 Percentage (%) of phase II and microbial metabolites in the bile (pooled sample) and plasma from colon perfusion experiments in control mice and in mice treated with rifaximin (Mean values and standard deviations; n 5–6)
NAR-GLU, naringenin glucuronide; ND, not detected; NAR-SULF, naringenin sulfate.
* Mean value was significantly different from that of the control group (P< 0·05; Mann–Whitney U test).
† Mean value was significantly different from that of the control group (P< 0·05; Student's t test).
In the colonic lumen, the predominant metabolite (expressed in terms of AUC) was NAR-SULF, followed by 4-hydroxyhippuric acid, hippuric acid and NAR-GLU, and when mice were pretreated with rifaximin, a significant decrease was only observed for 4-hydroxyhippuric acid (AUC 0·219 (sd 0·072) min v. 0·072 (sd 0·036) min, respectively).
The microbial metabolites 3-(4-hydroxyphenyl) propionic acid, 3-phenylpropionic acid and (4-hydroxyphenyl) acetic acid were found in the bile and plasma (Table 5) and no significant differences were observed between the two groups of mice, except in (4-hydroxyphenyl) acetic acid.
Discussion
Stability and solubility studies
Results showed that naringenin was more stable at acidic than at basic pH. However, in the perfusion buffers, it was stable at pH 2, 6·2 and 7·2 for the time required to perform the permeation experiments.
According to the BCS( Reference Amidon, Lennernäs and Shah 5 ), a compound is considered highly soluble when the highest dose strength is soluble in 250 ml or less of aqueous media over the pH range of 1–7·5. As naringenin is a dietary compound, it cannot be treated as a drug – in terms of dose strength – when testing for solubility. However, according to the values obtained ( < 0·0047 %), it can be considered as a compound with low solubility. Nonetheless, if we consider the lowest value of solubility at 37°C, which occurs under the most acidic conditions (22·88 (sd 0·60) μg/ml at pH 1), it is still higher than the concentration of naringenin in food sources. Therefore, the higher solubility of naringenin at physiological pH values is not expected to be a limiting factor in the absorption of naringenin after its oral ingestion.
In situ absorption studies of naringenin in the stomach, small intestine and colon
The Peff obtained in the three gastrointestinal regions showed that more naringenin was absorbed in the small intestine than in the stomach and colon (7·80 (sd 1·54) × 10–4cm/s v. 3·04 (sd 0·89) × 10–4cm/s and 5·49 (sd 1·86) × 10–4cm/s, respectively). However, this parameter did not differ significantly between the small and large intestines. In the present study, the permeability of naproxen, as a model of a highly permeable compound, was also assayed in the small intestine. The Peff obtained (6·39 (sd 1·23) × 10–4cm/s) was similar to that for naringenin (7·80 (sd 1·54) × 10–4cm/s), indicating that naringenin permeability was high and maintained throughout the small intestine and colon. Both compounds (naringenin and naproxen) have a low molecular weight and high lipophilicity (expressed as log P) (272·25 g/mol and log P= 2·84( 26 ) v. 230·26 g/mol and log P= 2·52( Reference Chabane, Al Ahmad and Peluso 4 ) for naringenin and naproxen, respectively), properties that favour intestinal absorption. Fagerholm and colleagues( Reference Fagerholm, Johansson and Lennernäs 27 ) and Masaoka et al. ( Reference Masaoka, Tanaka and Kataoba 22 ) found similar results for naproxen in rats: the decrease in Peff from the proximal to the distal intestine was less pronounced for the more lipophilic compounds, and the permeability was similar in the jejunum, ileum and colon. Based on these results, although naringenin has been described as a substrate of P-glycoprotein and MRP-2 (efflux proteins) and MRP-1 (influx) ATP-dependent transporters( Reference Chabane, Al Ahmad and Peluso 4 ), the main route of absorption for naringenin is by passive diffusion. However, this can lead to pharmacokinetic interactions with other drug/compound substrates of the same transporters, as described by Takanaga et al. ( Reference Takanaga, Ohnishi and Matsuo 28 ), Bailey et al. ( Reference Bailey, Malcolm and Arnold 29 ) and Le Goff et al. ( Reference Le Goff, Koffel and Vandenschrieck 30 , Reference Le Goff-Klein, Koffel and Jung 31 ). In this respect, naringenin is also an inhibitor of the isoform CYP3A4, which plays an important role in the metabolism of many drugs( Reference Hsiu, Huang and Hou 32 ).
Regarding permeability in the stomach, the Peff values were not comparable with those for the intestine because of the different flow rate used in the experiments (0·16 v. 0·2 ml/min, respectively). Komiya et al. ( Reference Komiya, Park and Kamani 24 ) demonstrated that the permeability and percentage absorbed could change due to differences in residence time in the organ caused by the flow rate. The fraction absorbed is expected to be higher with lower flow rates, because as residence time increases, the molecule has more opportunities to be absorbed. However, the results obtained for naringenin show that the Peff in the stomach was lower than in the small intestine and colon, although still significant.
As shown in Table 2, the absorption percentage did not always correspond to the Peff. For example, one could expect a higher absorption percentage in the colon according to the Peff. This variance can be attributed to the different length segments used in the experiments: 1·5–2 cm in the colon, 10–15 cm in the small intestine and 1·1–1·35 cm in the stomach (and in this case, assuming a cylindrical shape). Parameter L (equations 1 and 4) affects the percentage absorbed more than the Peff. These results are consistent with Komiya et al. ( Reference Komiya, Park and Kamani 24 ), who studied the fraction absorbed and the Peff of seven steroids in rats using different lengths of the intestine.
Regional differences in naringenin metabolism
With the aim of studying the intestinal first-pass metabolism, lumen samples, bile and blood (60 min) taken from the stomach, small intestine and colon assays were examined for the presence of metabolites. The main phase II metabolites found in the intestinal perfusion samples were mainly NAR-SULF, followed by NAR-GLU (P< 0·05).
The mean AUC values for these metabolites in each gastrointestinal segment are shown in Fig. 2. Considering the total conjugates excreted, their levels according to site were ranked: small intestine>colon>stomach. The AUC for NAR-SULF was 48·314 (sd 7·166) min, 2·616 (sd 1·347) min and 0·001 (sd 0·002) min, for the small intestine, colon and stomach, respectively. Chen et al. ( Reference Chen, Zhang and Jing 33 ) studied the distribution of human gastrointestinal sulfotransferases and demonstrated that the small intestine has higher sulfation activity than either the stomach or the colon, which is consistent with the present study results. Similar behaviour was observed for the uridine 5′-diphospho-glucoronosyltransferases (UDP glucuronosyltransferases), whose activity was also higher in the small intestine (AUC of NAR-GLU 4·072 (sd 2·948) min v. 0·079 (sd 0·027) min and 0·014 (sd 0·006) min, for the colon and stomach, respectively). Gregory et al. ( Reference Gregory, Lewinsky and Gardner-Stephen 34 ) and Xu et al. ( Reference Xu, Kulkarni and Singh 1 ) obtained similar results.
In the lumen, the main metabolites excreted were sulfates, as in human subjects( Reference Jeong, Jia and Hu 7 ). Sulfation is generally a higher-affinity, lower-capacity pathway than glucuronidation( Reference Chen, Zhang and Jing 33 ). In the present study, according to the low concentration assayed, higher sulfate production was expected. Both metabolites (sulfates and glucuronides) started to appear 5 min after starting the perfusion, but at different levels (Fig. 3). At 60 min, the mean percentage of NAR-SULF was 84·00 (sd 12·14) % in the small intestine, whereas for glucuronide it was 8·40 (sd 5·67) % (Table 3). In other words, the levels of NAR-SULF from 10 to 60 min (steady levels) were in the same order of magnitude as the parent compound, while those of NAR-GLU were lower (with a steady profile from approximately 30 min).

Fig. 3 Concentration of metabolites (Cmetabolite) naringenin glucuronide (![]() ) and naringenin sulfate (
) and naringenin sulfate (![]() ) normalised to the inlet concentration (CIN) of naringenin v. time in the small intestine (a) and colon (b). Values are means, with their standard errors represented by vertical bars.
) normalised to the inlet concentration (CIN) of naringenin v. time in the small intestine (a) and colon (b). Values are means, with their standard errors represented by vertical bars.
Only NAR-GLU (and not NAR-SULF) was found in the plasma and the highest percentage was obtained in the plasma of small intestine assays (22·86 (sd 8·38) %). Neither NAR-GLU nor NAR-SULF was detected in the bile. Contradictory results have been found by other authors: Fang et al. ( Reference Fang, Wang and Ma 35 ), who studied the bioavailability of naringenin and naringin after oral administration in rats, reported a far higher plasma profile of NAR-SULF than of NAR-GLU (5·4 times higher in terms of AUC), while Xu et al. ( Reference Xu, Kulkarni and Singh 1 ) found significant amounts of NAR-GLU in rat bile, more than double that of intestinal lumen samples, using a similar intestinal perfusion technique.
According to the present study results and the high levels of sulfates found in the lumen with respect to the plasma and bile, we suggest that naringenin sulfation in mice occurs mainly in the enterocytes rather than in the liver. Further research is required to study the sulfotransferases involved in the intestinal metabolism of naringenin. Regarding glucuronisation, the process seems to take place in both the intestinal cells and the liver, and the isoform UDP glucuronosyltransferases 1A localised in the endoplasmic reticulum of the enterocytes plays an important role in the first-pass metabolism of naringenin and other polyphenols( Reference Manach, Scalbert and Morand 36 ).
Effect of the antibiotic treatment on the absorption and metabolism of naringenin
The aim of this part of the work was to study the influence of the microbiota on the absorption and metabolism of naringenin.
As can be observed in Table 2, pretreatment with rifaximin reduced the permeability of naringenin in the large intestine (P< 0·05). This reduction in absorption is in accordance with the lower percentage of NAR-GLU observed in plasma (Table 5) of the rifaximin-treated mice compared to the control group (0·49 (sd 0·31) % v. 2·99 (sd 1·61) %, respectively) as well as a decrease in the percentage of naringenin in plasma (from 0·68 (sd 0·19) % to 0·37 (sd 0·09) % for treated mice). In contrast, plasma NAR-SULF increased in rifaximin-treated mice, although the percentage was quite low (0·7 (sd 0·2) %).
In the colonic perfusion samples (Table 4), the amounts of phase II metabolites (NAR-GLU and NAR-SULF) did not differ significantly (P>0·05) between the two groups. As they are mainly intestinal and hepatic metabolites, differences were not expected.
Regarding the microbial metabolites, naringenin can be metabolised to a wide range of low-molecular-weight aromatic acids such as phloroglucinol, 3-(4-hydroxyphenyl) propionic acid, (4-hydroxyphenyl) acetic acid, 3-phenylpropionic acid, 4-hydroxyhippuric acid and hippuric acid( Reference Rechner, Smith and Kuhnle 37 – Reference Boto-Ordóñez, Rothwell and Andres-Lacueva 39 ). Based on the present study results (Tables 4 and 5), a scheme of the colonic metabolic pathway of naringenin is proposed in Fig. 4. As shown, 3-phenylpropionic acid may be biotransformed to benzoic acid, absorbed (by the monocarboxylic acid transporter 1) and subjected to glycination and β-oxidation in the liver, yielding hippuric acid and 4-hydroxyhippuric acid( Reference Rechner, Smith and Kuhnle 37 , Reference Cong, Fong and Lee 40 – Reference Serra, Macià and Romero 43 ). This pathway justifies the presence of 4-hydroxyhippuric acid and hippuric acid in the bile and plasma. On the other hand, the presence of these metabolites in the colonic perfusates (Table 4) under our experimental conditions (bile duct tied) could be explained by intestinal secretion. Although hippuric acid can be derived from sources other than polyphenols, such as aromatic amino acids( Reference Manach, Scalbert and Morand 36 ), the relatively high levels obtained may be associated with the dose of naringenin administered. Phloroglucinol was not detected in the present study and is rarely recovered as a final metabolite, as it can be degraded into acetate, butyrate and CO2 ( Reference Possimiers, Bolca and Verstraete 38 ).

Fig. 4 Main metabolic pathway tentatively proposed for the colonic metabolism of naringenin( Reference Rechner, Smith and Kuhnle 37 – Reference Boto-Ordóñez, Rothwell and Andres-Lacueva 39 , Reference Aura 42 ).
There was a lack of hydroxyphenyl propionic acids and hydroxyphenyl acetic acids (intermediate metabolites) in the perfusate samples, although we detected and quantified 3-(4-hydroxyphenyl) propionic acid, 3-phenylpropionic acid and (4-hydroxyphenyl) acetic acid in the plasma and bile. This absence could be attributed to rapid intestinal absorption of the phenolic acids after their formation. Konishi & Kobayashi( Reference Konishi and Kobayashi 44 )reported the permeation of 3-(3,4-dihydroxyphenyl) propionic acid via the paracellular pathway and of 3-(3-hydroxyphenyl) propionic acid by the monocarboxylic acid transporter. No significant differences in 3-(4-hydroxyphenyl) propionic acid in the plasma and bile were found between the two experimental groups (control and treated with rifaximin), in contrast with the derived metabolites (3-phenylpropionic acid and (4-hydroxyphenyl) acetic acid) in bile. The high percentage of 3-phenylpropionic acid found in the samples was striking, although it can be considered as reasonable, since its presence in biological samples may be attributed to the bacterial metabolic action of dietary polyphenols as well as dietary phenolic amino acids such as phenylalanine and tyrosine( Reference Spoelstra 45 , Reference Lord and Bradley 46 ).
In principle, we would expect higher levels of microbial metabolites in control animals than in those treated with rifaximin, but no significant differences were observed between the two groups. These results suggest that the antibiotic treatment did not totally eliminate the intestinal microbiota but probably altered it. Gao and colleagues( Reference Gao, Gillilland and Owyang 47 ) reported that rifaximin alters the bacterial population in the ileum of rats, leading to a relative abundance of Lactobacillus species. In the present study, an increase in 3-phenylpropionic acid in the bile and in (4-hydroxyphenyl) acetic acid in the plasma of rifaximin-treated mice was observed.
On the other hand, taking into account the relatively high percentage of microbial metabolites found in the biological samples, it is of great interest to consider their possible contribution to the human health benefits attributed to the parent compound naringenin. In this context, microbial metabolites such as hydroxylated 3-phenylpropionic acids and hydroxylated phenylacetic acids retain antioxidant properties, while others such as (4-hydroxyphenyl) acetic acid are reported to be more effective than their parent compounds (rutin and quercetin) in inhibiting platelet aggregation in vitro ( Reference Konishi and Kobayashi 44 ). Miene and colleagues( Reference Miene, Weise and Glei 48 ) also report anti-inflammatory activity of (3,4-dihydroxyphenyl) acetic acid and 3-(3,4-dihydroxyphenyl) propionic acid in human colon cells. It could be extrapolated from these results that if naringenin were ingested in the diet, the food matrix would favour the production of microbial metabolites, since prebiotic and probiotic compounds can stimulate intestinal fermentation and the activity of the colonic microbiota( Reference Manach, Scalbert and Morand 36 ). The matrix could even bind or occlude naringenin, thereby hampering its absorption and increasing the residence time of unabsorbed naringenin in the gut and making it more available for the activity of the microbiota.
Conclusions
The present study results show that naringenin is a highly permeable compound (comparable to naproxen) and is absorbed throughout the gastrointestinal tract, but mainly in the small intestine and by a passive diffusion mechanism. Neither its permeability nor solubility at physiological pH values are expected to be a limiting factor in the bioavailability of naringenin after its dietary ingestion.
The low oral bioavailability of naringenin can be attributed to a high intestinal first-pass effect, and, to a lesser degree, to hepatic metabolism. The high intestinal first-pass metabolism of naringenin leads to a high level of phase II metabolites (mainly naringenin-O-sulfate in the intestinal lumen), which – due to an enterohepatic cycle – would extend the presence of naringenin within the organism. The main sulfation and glucuronidation activity was found in the small intestine, followed by the colon and stomach. The treatment with rifaximin (50 mg/kg) led to a decrease in the absorption of naringenin but not to a significant reduction in any of the microbial metabolites formed.
According to the present study results, the health effects associated with dietary naringenin seem to be more closely related to the high level of bioactive metabolites formed than to its bioavailability. However, further pharmacodynamics and metabolic studies are needed to confirm this statement.
Acknowledgements
The present study was supported in part by the Spanish Ministerio de Economía y Competitividad (AGL2010-22319-C03, AGL2013-49083-C3-1-R) and by the Generalitat de Catalunya (2014 SGR 773). The Ministerio de Economía y Competitividad, (CIBEROBN) Instituto de Salud Carlos III and the Generalitat de Catalunya had no role in the design, analysis or writing of this article.
Contributions of authors were as follows: All authors had full access to all the data in the study and take responsibility for the integrity of the data and the accuracy of analyses. All authors were involved in the conception and design of the study, the collection and assembly of data and the analysis and interpretation of the data. N. O.-L. and E. E.-F. wrote the article but the intellectual content of the manuscript was critically revised by all the authors.
None of the authors has any conflicts of interest.


