


Risk factors compromised at birth and in early childhood may exacerbate the progression of CVD in adulthood. A high birth weight with exposure to maternal obesity and/or diabetes has been strongly correlated with increased risks of developing chronic diseases later in life( Reference Botton, Heude and Maccario 1 – Reference Blake, Gurrin and Evans 4 ). Similarly, rapid weight gain before 6 months of age has been associated with obesity in adolescence( Reference Botton, Heude and Maccario 1 ). In the Western Australian Pregnancy Cohort (Raine) Study, a birth cohort study, we showed the detrimental effects of accelerated adiposity gain and sustained high adiposity levels from birth to age 14 years on insulin levels and homeostasis model assessment (HOMA) for insulin resistance at 14 years( Reference Huang, de Klerk and Smith 5 ). Furthermore, prenatal, postnatal and early childhood environment influences cardiovascular risk factors at a later age( Reference Beilin and Huang 6 ).
Nutrition during early childhood and adolescence plays a crucial role in the development of CVD in later life. Late adolescence, in particular, is a period of transition from established to self-dependent food and physical activity choices. Prolonged periods of skipping breakfast( Reference Smith, Gall and McNaughton 7 ) or increased consumption of sugar-sweetened beverages( Reference Duffey, Gordon-Larsen and Steffen 8 ) during childhood have been associated with an increased waist circumference. The rapid rise in the prevalence and magnitude of obesity in children results in earlier impaired glucose metabolism, high blood pressure and TAG levels, and reduced HDL-cholesterol in pre-pubertal and pubertal children( Reference Olza, Gil-Campos and Leis 9 ), a cluster of risk factors termed the metabolic syndrome. In the Raine Study, a higher Western dietary pattern at the age of 14 years has been associated with greater odds of adolescents being in a ‘high-risk metabolic cluster’( Reference Ambrosini, Huang and Mori 10 ). Systolic and diastolic blood pressure and mean arterial pressure are inversely related to intakes of polyunsaturated n-3, n-6 and long-chain n-3 fatty acids( Reference O'Sullivan, Bremner and Beilin 11 ).
Although derived dietary patterns in nutritional epidemiology have been used to explore the potential relationships with chronic disease( Reference Ambrosini, Huang and Mori 10 , Reference Ambrosini, Emmett and Northstone 12 – Reference Robinson, Marriott and Poole 14 ), they give no indication as to whether the prescribed dietary guidelines are achieved. In this regard, the Dietary Guideline Index (DGI) established to reflect the level of adherence to the Dietary Guidelines for Australian Adults has been validated using nutrient intakes estimated from 24 h recalls of the latest (1995) National Nutrition Survey( Reference McNaughton, Ball and Crawford 15 ). The DGI uses indicators based on each dietary guideline with cut-off values and food groupings guided by the Australian Guide to Healthy Eating. Golley et al. ( Reference Golley, Hendrie and McNaughton 16 ) established the Dietary Guideline Index for Children and Adolescents (DGI-CA) using the 2003 Australian Dietary Guidelines for Children and Adolescents and the DGI developed by McNaughton et al. ( Reference McNaughton, Ball and Crawford 15 ). The DGI-CA has been validated using the 2007 Australian National Children's Nutrition and Physical Activity Survey and comprises eleven indicators, as opposed to the DGI with fifteen indicators. It excludes alcohol and lean meat, and combines salt and sugars. Both the DGI and the DGI-CA correlate with lower energy intake, lower fat intake and energy density( Reference McNaughton, Ball and Crawford 15 , Reference Golley, Hendrie and McNaughton 16 ).
The aim of the present study was to employ the DGI-CA to assess the degree of adherence to the Dietary Guidelines for Australian Children and Adolescents in 14- and 17-year adolescents in the Raine Study and to examine its relationship with cardiometabolic risk factors over time.
Methods
Study participants
Between 1989 and 1991, 2900 pregnant women (16 and 20 weeks of gestation) were recruited serially to the Raine Study at the King Edward Memorial Hospital for Women and nearby private practices in Perth and gave birth to 2868 live babies. Full details of the Raine Study have been published elsewhere( Reference Newnham, Evans and Michael 17 ). Briefly, children were followed at regular intervals, and a range of information was collected at each follow-up, including sociodemographic characteristics, cardiometabolic parameters and physical assessments. Dietary information during adolescence was collected at the age of 14 and 17 years. Details of the contact maintained with the cohort at each follow-up have been previously published( Reference Huang, Mori and Burrows 18 ). Socially disadvantaged families made up a larger proportion of the original cohort; however, these families were less likely to remain in the study beyond year 3 of the follow-ups. Consequently, those remaining were more representative of the general Western Australian population( Reference Huang, Mori and Burrows 18 ). The 14- and 17-year cohort follow-ups were attended by 1860 and 1754 participants, respectively. The present study was conducted according to the guidelines laid down in the Declaration of Helsinki, and all procedures involving human subjects were approved by the human research ethics committees of King Edward Memorial Hospital for Women and the Princess Margaret Hospital for Children, Perth, Western Australia. Written informed consent was obtained from the mother or legal guardian at the 14-year and 17-year follow-ups, as well as from the adolescent at the 17-year follow-up.
Dietary assessment
All participating adolescents were sent a semi-quantitative, 212-item FFQ (Commonwealth Scientific and Industrial Research Organization (CSIRO), Adelaide, SA, Australia)( Reference Baghurst and Record 19 ). The FFQ was completed at the same visit when cardiometabolic risk factors were measured and consisted of individual foods, as well as mixed dishes and beverages, and was designed to assess usual dietary intake over the previous year. The CSIRO FFQ has been validated in adults( Reference Lassale, Guilbert and Keogh 20 ), and its reliability has been tested in this cohort( Reference Ambrosini, de Klerk and O'Sullivan 21 ). At the 14-year follow-up, the primary caregiver was asked to complete the FFQ along with the study participant due to the difficulty associated in recollecting the frequency of food consumption and the increased likelihood of food choices being made by the primary caregiver. At the 17-year follow-up, only the study participants were asked to complete the FFQ, but were free to consult their parents if needed. All FFQ were checked by a research nurse to clarify missing responses. Data entry, data verification and the estimation of average daily food and nutrient intakes were carried out by the CSIRO. FoodWorks® Professional version 7 (Xyris Software) was used to convert grams of food consumed into standard serves.
Dietary Guideline Index for Children and Adolescents
The DGI-CA comprises eleven indicators (Table 1) with a maximum score indicating the optimal intake or dietary recommendations being met. Of the eleven indicators, six are scored on a scale of 0–10; dairy and cereal are further divided into two categories, one indicating frequency and the other quality of the respective food consumed. Each of the sub-categories is scored on a scale of 0–5. The dietary guidelines for children and adolescents state that care should be taken to: (1) limit saturated fat and moderate total fat intake with low-fat diets being unsuitable for infants; (2) choose foods low in salt; (3) consume only moderate amount of sugars and foods containing added sugars. In the DGI-CA, these three guidelines have been combined into an ‘extra foods’ indicator and were given a scale of 0–20. Alcohol consumption is not recommended below the age of 18 years, and was, thus, not included as an indicator in the DGI-CA. Intermediate scores were proportional on a continuous scale, in line with the dietary guidelines for the age groups of interest( 22 ), and a total DGI-CA score closer to the maximum of 100 reflects better compliance to the dietary guidelines.
Table 1 Indicators of the Dietary Guideline Index (DGI) and Dietary Guideline Index for Children and Adolescents (DGI-CA)

Max, maximum; Min, minimum.
* Based on the Dietary Guidelines for Children and Adolescents in Australia( Reference Robinson, Marriott and Poole 14 ).
Biochemical and clinical measures
At each follow-up, weight and height were measured using standard calibrated equipment to the nearest 100 g and 0·1 cm, respectively. BMI was calculated as weight divided by the square of height (kg/m). Waist measurements were taken at the level of the umbilicus to the nearest 0·1 cm until two readings were within a centimetre of each other. Hip girth measurement was taken over the widest part of the buttocks and recorded to the nearest 0·1 cm.
Participants rested for 5 min in the supine position before having their blood pressure and heart rate (HR) measured using an oscillometric sphygmomanometer (Dinamap vital signs monitor 8100, Dinamap XL vital signs monitor, Dinamap ProCare 100 DPC100X-EN or Dinamap Procare 100 DPC100-EN; Soma Technology), set to automatically record six readings every 2 min with subjects remaining in the supine position and with the appropriate cuff size. The average of the last five readings for systolic blood pressure, diastolic blood pressure and HR was used.
Fasting blood samples were analysed in the PathWest Laboratory at the Royal Perth Hospital for determining the levels of serum glucose, insulin, cholesterol, TAG, HDL-cholesterol, LDL-cholesterol and high-sensitivity C-reactive protein, as described previously( Reference Huang, Mori and Burke 23 ). HOMA score was used as a measure of insulin resistance, and was derived using the following equation:
 $$\begin{eqnarray} HOMA\hyphen IR = (fasting\,insulin\,(mU/l)\times fasting\,glucose\,(mmol/l))/22\cdot 5. \end{eqnarray}$$
Confounding variables
Physical activity was assessed using a self-reported questionnaire based on exercise performed outside of school hours, with exercise defined in five categories as activity causing breathlessness or sweating (category 0: once a month or less; category 1: once a week; category 2: 2–3 times a week; category 3: 4–6 times a week; category 4: every day). The Australian Bureau of Statistics' Index of Relative Socio-economic Advantage and Disadvantage (IRSAD) was used to assess socio-economic status of the participants( Reference Pink 24 ). IRSAD derives variables related to both socio-economic advantage and disadvantage from the Census, and presents the combined results on a continuous scale, with higher values reflecting greater advantage and a relative lack of disadvantage.
Statistics analyses
Statistical analyses were performed using the STATA Data Analysis and Statistical Software, version 11 (StataCorp LP). Misreporting was identified as individuals with energy consumption < 3000 kJ/d or >20 000 kJ/d as described previously( Reference Ambrosini, Oddy and Robinson 25 ), and were omitted from the analyses. All variables were tested for normality. BMI, insulin, TAG and HOMA were log-transformed as they did not have a normal distribution. A DGI-CA score was calculated for each year (14 and 17), and a hierarchical linear mixed model using maximum likelihood estimation was used to test the difference between the scores of the two time points. The maximum likelihood estimation uses both complete and incomplete data to obtain the value of a parameter that is most likely to have resulted from the observed data, producing unbiased estimates when the missing mechanism is missing at random. The hierarchical structure, with random intercepts for both family and subject, was specified to adjust for correlation between siblings who comprised < 10 % of the sample. Time was treated as a factor variable with two levels. Sex effects on the DGI-CA score and the change in DGI-CA over time were tested in this model by including sex in the model as well as the interaction between sex and time. The same statistical analysis was employed to test the difference in the scores achieved for each DGI-CA indicator over time.
Hierarchical linear mixed modelling using maximum likelihood estimation was also employed to examine the relationship between DGI-CA and cardiometabolic risk factors over time. All models of cardiometabolic risk were adjusted for the potential influence of sex on the outcomes. Change in the relationship between DGI-CA and the cardiometabolic risk factors over time was assessed via an interaction between DGI-CA and time in each model.
The models for every cardiometabolic outcome were constructed by first testing the individual influence of each of the four covariates (IRSAD, physical activity, BMI and sex) and subsequently their interactions with DGI-CA (both three and two ways). Covariates and interactions, significantly associated with the outcome, were retained in the model. The DGI-CA coefficients reported are after adjusting for the covariates that remained significant in the model. Significance was set at P< 0·05. No adjustments were made for multiple comparisons as guided by Rothman's recommendations; no adjustment leads to ‘fewer errors of interpretation when data under evaluation are not random numbers but actual observations in nature’( Reference Rothman 26 ).
Results
Eighteen participants at the 14-year follow-up and eighteen participants at the 17-year follow-up were excluded from the analyses for misreporting. One participant, who had a DGI-CA score but did not fast as instructed before blood collection at the 14-year follow-up, had blood glucose level >7 mmol/l and was also excluded from all the analyses. In addition, fifteen participants at the 14-year follow-up and twelve at the 17-year follow-up who had high-sensitivity C-reactive protein level >10 mg/l, which reflects an acute state of inflammation, were excluded before the C-reactive protein analyses.
A total of 1608 adolescents attended the physical examination at the 14-year follow-up, of whom 1419 (689 females and 730 males) completed all components required to compute the DGI-CA scores (DGI-CA14) and were not excluded for misreporting or not fasting. From the 17-year follow-up, 843 DGI-CA17 scores (451 females and 392 males) were available from the 1255 adolescents who attended the 17-year physical examination (Fig. 1). Adolescents who attended the physical examination and had a DGI-CA score were classed as ‘participants’. Those who did attend the examination but did not have a DGI-CA score, or were excluded for misreporting or not fasting, were classed as ‘non-participants’. Participants at 14-year follow-up did not differ from non-participants (online Supplementary Table S1). At 17-year follow-up, participants had lower BMI and smaller waist circumference than non-participants, but did not differ in socio-economic status (denoted by the IRSAD).
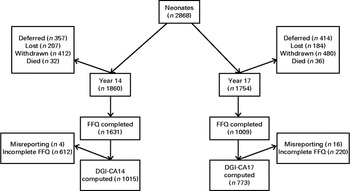
Fig. 1 Consort Flow Diagram: number of patients at each follow-up. ‘Deferred’ or ‘Lost’ patients at any particular follow-up were eligible to participate in subsequent follow-ups. Withdrawn patients are those who have permanently retracted their consent to participate in the study. Dietary Guideline Index for Children and Adolescents (DGI-CA) scores were only computed from complete FFQ. Those with energy intakes < 3000 and >20 000 kJ were excluded from the analysis.
Within the participants' category, a subset of 1143 participants (570 females and 573 males) attended both follow-ups. The subgroup that had the DGI-CA scores at both time points consisted of 724 participants (385 females and 339 males). The physical and biochemical profiles of those with a DGI-CA score are summarised in Table 2. A one-unit change in DGI-CA was positively associated with a change in IRSAD of 0·022 (P< 0·001) at 14-year follow-up and 0·03 at 17-year follow-up (P< 0·001), and with a 1·22 change in physical activity score (P< 0·001) at 14-year follow-up and 2·09 at 17-year follow-up (P< 0·001).
Table 2 Physical and biochemical profile of participants with a Dietary Guideline Index for Children and Adolescents (DGI-CA) score at each follow-up (Mean values and standard deviations)

HOMA-IR, homeostasis model assessment for insulin resistance; HR, heart rate; hs-CRP, high-sensitivity C-reactive protein.
Dietary Guideline Index for Children and Adolescents and adherence to the Australian Dietary Guidelines
The mean DGI-CA14 and DGI-CA17 scores were 47·1 (sd 10·2) and 47·7 (sd 11·0), respectively, and not significantly different between sexes. Table 3 shows the percentage of adolescents meeting the dietary guidelines, i.e. achieving maximum score for each indicator. The scores for all indicators of the DGI-CA changed over time; however, the 0·11 change in overall DGI-CA score for every unit change in time was not significant (P= 0·33). The meat score (indicator for ‘serves of meat and alternatives per day’) was the only indicator with more than 50 % of the participants achieving maximum score at 14-year and 17-year follow-ups. After adjusting for time, sex, time × sex interaction, socio-economic status and physical activity, a one-unit change in DGI-CA was positively associated with a change in total energy intake of 0·001 kJ (P< 0·001).
Table 3 Dietary profile of adolescents in the Raine Study based on the Dietary Guideline Index for Children and Adolescents (DGI-CA)

DGI-CA14, Dietary Guideline Index for Children and Adolescents at 14-year follow-up; DGI-CA17, Dietary Guideline Index for Children and Adolescents at 17-year follow-up; Min, minimum; Max, maximum; IQR, interquartile ranges.
* Mean change over time.
† Max score of 5.
‡ Max score of 20.
Dietary Guideline Index for Children and Adolescents and cardiometabolic risk factors
None of the cardiometabolic models showed a significant interaction between DGI-CA and time, indicating that the relationships between DGI-CA and the cardiometabolic outcome did not vary between 14- and 17-year follow-ups. BMI changed over time differently between the sexes. After adjusting for time, sex and time × sex interaction, as well as IRSAD score and physical activity, DGI-CA was positively associated with BMI (P= 0·029, β = 0·0007) (Table 4). In other words, an increase in DGI-CA of one unit was significantly associated with an increase in BMI of 0·0007 kg/m2 across both time periods. This equates to an increase in BMI of 0·021 kg/m2 following greater adherence to the dietary guidelines as would be observed for a change in the DGI-CA score of 30 points. The association between energy intake and BMI was investigated, and despite its association with DGI-CA, energy intake was not identified as a significant predictor of BMI in multivariable models (P= 0·89). Conversely, one-unit change in DGI-CA was significantly associated with a change in waist:hip ratio of − 0·0003 (P= 0·026) across both time periods (Table 4).
Table 4 Final hierarchical linear mixed models (using maximum likelihood estimation) depicting the associations between Dietary Guideline Index for Children and Adolescents (DGI-CA) and cardiometabolic risk factors (BMI, waist:hip ratio and waist) from the 14- to 17-year follow-up (β Coefficients and 95 % confidence intervals)

IRSAD, Index of Relative Socio-economic Advantage and Disadvantage; PA, physical activity; Cat, category.
* Change in outcome variable per one-unit change in DGI-CA or other listed terms across the 2 years.
† Cat 0 is the reference level and comparison is made between each of the physical activity categories and Cat 0.
A unit change in DGI-CA was inversely associated with a change in insulin levels of − 0·028 pmol/l (P= 0·01) and a change in HOMA score of − 0·004 (P= 0·005; Table 5). However, changes in DGI-CA were not significantly associated with changes in glucose levels before (P= 0·39) or after (P= 0·40) adjusting for IRSAD score, physical activity and BMI (Table 5). No interactions were observed between insulin, HOMA, glucose and the aforementioned covariates (Table 5).
Table 5 Final hierarchical linear mixed models (using maximum likelihood estimation) depicting the associations between Dietary Guideline Index for Children and Adolescents (DGI-CA) and cardiometabolic risk factors (insulin level, homeostasis model assessment (HOMA) score and glucose level) from the 14- to 17-year follow-up (β Coefficients and 95 % confidence intervals)

IRSAD, Index of Relative Socio-economic Advantage and Disadvantage; PA, physical activity; Cat, category.
* Change in outcome variable per one-unit change in DGI-CA or other listed terms across the 2 years.
† Cat 0 is the reference level and comparison is made between each of the physical activity categories and Cat 0.
Total cholesterol, TAG and HDL-cholesterol followed different patterns for males and females from the 14-year to the 17-year follow-ups (Tables 6 and 7). A unit increase in DGI-CA was significantly associated with a decrease in TAG of 0·003 mmol/l (P= 0·011; Table 7) across both time periods. Changes in DGI-CA were not associated with changes in the levels of cholesterol (P= 0·095; Table 6), LDL-cholesterol (P= 0·071; Table 6), high-sensitivity C-reactive protein (P= 0·51; Table 8) or HDL-cholesterol (P= 0·51; Table 6).
Table 6 Final hierarchical linear mixed models (using maximum likelihood estimation) depicting the associations between Dietary Guideline Index for Children and Adolescents (DGI-CA) and cardiometabolic risk factors (cholesterol, HDL-cholesterol and LDL-cholesterol) from the 14- to 17-year follow-up (β Coefficients and 95 % confidence intervals)

IRSAD, Index of Relative Socio-economic Advantage and Disadvantage; PA, physical activity; Cat, category.
* Change in outcome variable per one-unit change in DGI-CA or other listed terms across the 2 years.
† Cat 0 is the reference level and comparison is made between each of the physical activity categories and Cat 0.
Table 7 Final hierarchical linear mixed models (using maximum likelihood estimation) depicting the associations between Dietary Guideline Index for Children and Adolescents (DGI-CA) and cardiometabolic risk factors (TAG, heart rate (HR) and systolic blood pressure (SBP)) from the 14- to 17-year follow-up (β Coefficients and 95 % confidence intervals)

IRSAD, Index of Relative Socio-economic Advantage and Disadvantage; PA, physical activity; Cat, category.
* Change in outcome variable per one-unit change in DGI-CA or other listed terms across the 2 years.
† Cat 0 is the reference level and comparison is made between each of the physical activity categories and Cat 0.
Table 8 Final hierarchical linear mixed models (using maximum likelihood estimation) depicting the associations between Dietary Guideline Index for Children and Adolescents (DGI-CA) and cardiometabolic risk factors (diastolic blood pressure and C-reactive protein) from the 14- to 17-year follow-up (β Coefficients and 95 % confidence intervals)

IRSAD, Index of Relative Socio-economic Advantage and Disadvantage; PA, physical activity; Cat, category.
* Change in outcome variable per one-unit change in DGI-CA or other listed terms across the 2 years.
† Cat 0 is the reference level and comparison is made between each of the physical activity categories and Cat 0.
A unit change in DGI-CA associated with a change in HR of − 0·08 beats/min (P= 0·001; Table 7). However, there were no significant associations between changes in DGI-CA and changes in systolic blood pressure (P= 0·11; Table 7) or diastolic blood pressure (P= 0·09; Table 8).
Discussion
The relationships between cardiometabolic risk factors and single dietary facets, such as intake of n-3 fatty acids, dietary Ca, SFA and the adherence to a Mediterranean dietary pattern, have been extensively tested. However, to our knowledge, the relationships between cardiometabolic risk factors and the prescribed Australian Dietary Guidelines in adolescents have not been assessed. We tested these relationships by using the only available Australian dietary index for this age group: the DGI-CA.
Based on the DGI-CA, the overall level of adherence among the Raine Study adolescents is comparable to the Australian Children's Nutrition and Physical Activity Survey( Reference Golley, Hendrie and McNaughton 16 ) (National DGI-CA score of 48·6 (sd 0·5) for ages 12–16 years). Other international longitudinal studies examining the changes in diet quality in children and adolescents have observed that reported intakes are well below the recommended levels( Reference Mariscal-Arcas, Rivas and Velasco 27 – Reference Serra-Majem, Ribas and Ngo 29 ). We expected to see a marked decline in diet quality at 17-year follow-up as it falls within the transition period to adulthood, during which food independence and nutritional problems are common. Research has shown that adolescents, who have an increased consumption of fast food and less family meals, have lower diet quality( Reference Larson, Neumark-Sztainer and Hannan 30 – Reference Hammons and Fiese 32 ). However, based on the DGI-CA score, our data showed no change in diet quality with age. One possible reason for not having similar findings as described by Golley et al. ( Reference Golley, Hendrie and McNaughton 16 ) is that the latter conducted separate cross-sectional analyses for their three independent age groups while our analysis assessed a within-group change in diet quality longitudinally. Thus, from their study, the within-group change of DGI-CA over time cannot be determined. Another reason is the potential inadequacy of the score itself. Despite observing that the majority of indicators changed over time (the variety, fruit, vegetable, cereal, dairy and meat score showing a decrease in score, whereas the cereal quality, meat quality, water and saturated fat showing an increase in score over time, and a no change with the ‘extras’ indicator), the overall score did not change.
The relationship between DGI-CA and adiposity is not clear. We showed a positive association between DGI-CA and BMI but a negative association with waist:hip ratio. Although the magnitude of the associations is small, they are in accordance with previous findings( Reference McNaughton, Ball and Crawford 15 , Reference Golley, Hendrie and McNaughton 16 ). In 4- to 10-year-old children and in 12- to 16-year-old adolescents, Golley et al. ( Reference Golley, Hendrie and McNaughton 16 ) showed a weak positive association between BMI and DGI-CA. McNaughton et al. ( Reference McNaughton, Ball and Crawford 15 ) showed a similar association in women but also a negative association with waist:hip ratio in both men and women. In contrast, only one study has shown better adherence to the Australian dietary guidelines, assessed by the DGI, associated with lower BMI gain in male participants, but is unrelated with adiposity measures in females( Reference Arabshahi, van der Pols and Williams 33 ). We did not observe a sex × DGI-CA interaction, which is in contrast to the findings of Arabshahi et al. ( Reference Arabshahi, van der Pols and Williams 33 ) in an adult population. The poor associations between DGI-CA and measures of adiposity could be due to the fact that the index structure does not penalise excess consumption of the five main food groups (cereals, fruits, vegetables, meat and dairy) and focuses only on controlling the intake of high-fat and high-sugar foods. Consumption of the recommended 1 serving of nuts, for example, scores the maximum DGI-CA points (10 points) for the category of lean meat, nuts and legumes, but so does the consumption of 3 servings of nuts. Thus, while the two DGI-CA scores may reflect adherence to the dietary guidelines, energy intake of the two diets would be markedly different with the latter being higher. This, in turn, contributes to a positive energy balance and supports the positive association we observed between DGI-CA and energy intake.
DGI-CA was negatively associated with TAG levels but not with total cholesterol, HDL-cholesterol and LDL-cholesterol. The lack of association between DGI-CA and the other lipids was surprising, given that the index structure is highly focused on the intake of high-fat foods. In view of the fact that the present study is the first to examine the associations between cardiometabolic risk factors and an index that reflects the Australian dietary guidelines, these findings will need to be confirmed in other studies. However, it is possible that either the FFQ does not provide sufficiently accurate dietary information to compute the DGI-CA or that the DGI-CA is not adequately refined to detect changes in cholesterol, HDL-cholesterol and LDL-cholesterol levels based on dietary intake. Similar to BMI, TAG levels were different over time for males and females; however, sex differences with regard to DGI-CA were not significant, and were, thus, not analysed separately. A number of studies( Reference Olza, Gil-Campos and Leis 9 , Reference González, Guerrero and Soto 34 – Reference Weiss, Dziura and Burgert 36 ) have demonstrated that the onset of lipidaemia can occur at prepubertal age, and is often a reflection of diet and lifestyle( Reference Ambrosini, Huang and Mori 10 , Reference Mikkila, Rasanen and Raitakari 28 , Reference Heyman, Berthon and Youssef 37 – Reference Taveras, Berkey and Rifas-Shiman 39 ). The present study shows that, at any particular time, the DGI-CA score can be used to provide a non-invasive snapshot of the likelihood of higher TAG levels through dietary practice.
The occurrence of dyslipidaemia often presents itself parallel to insulinaemia, and eating behaviour is known to affect both( Reference Smith, Gall and McNaughton 7 , Reference Heyman, Berthon and Youssef 37 , Reference Azadbakht, Haghighatdoost and Feizi 40 , Reference Sesé, Jiménez-Pavón and Gilbert 41 ). We observed a negative association between DGI-CA and insulin levels and HOMA scores. In accordance with these findings, Pereira et al. ( Reference Pereira, Jacobs and van Horn 42 , Reference Pereira, Kartashov and Ebbeling 43 ) showed that adults from the Coronary Artery Risk Development in Young Adults (CARDIA) study, who had increased fast food habits, also had increased risks of insulin resistance but those with higher dairy intake showed negative associations.
We found no association between DGI-CA and blood pressure or the inflammatory marker high-sensitivity C-reactive protein. However, HR was negatively associated with DGI-CA after adjusting for physical activity and BMI. In adults, McNaughton et al. ( Reference McNaughton, Ball and Crawford 15 ) showed that the DGI was inversely associated with systolic blood pressure, but in males only. Using data from 3-d dietary records, O'Sullivan et al. ( Reference O'Sullivan, Bremner and Beilin 11 ) showed in the Raine Study cohort that blood pressure is inversely associated with PUFA, n-3, n-6 and long-chain n-3 fatty acids in boys but not in girls. In the Dietary Approaches to Stop Hypertension (DASH) study, a diet high in dairy products and fruits and vegetables has been associated with reduced risks of elevated blood pressure( Reference Moore, Bradlee and Singer 44 ). In the present study, we did not observe any DGI-CA × sex interaction. One possible reason for the lack of associations with blood pressure in the present study is the fact that DGI-CA combined the salt indicator with the ‘extras’ indicator, consequently reducing the accuracy of the scoring system.
The potential limitations of the present study include the use of the FFQ to compute the DGI-CA score. Additionally, FFQ were completed by the parents at the 14-year follow-up and by the adolescents at the 17-year follow-up. At 17-years of age, many adolescents would have already become food independent and even if they were allowed to seek help from their parents with filling in the questionnaire, it would have not been appropriate for their parents to solely complete the FFQ. Although the FFQ ranks less favourably in terms of accuracy when compared with food records, especially in adolescents( Reference Ambrosini, de Klerk and O'Sullivan 21 ), it provides a more feasible means to assess habitual food intake from a large cohort. Another potential limitation is that alcohol is not included in the DGI-CA scoring due to the fact that alcohol consumption is not recommended below the age of 18 years (Table 1)( Reference Golley, Hendrie and McNaughton 16 ). However, in the 17-year Raine Study cohort, we showed that 49·2 % of girls and 52 % of boys consumed alcohol the week before the follow-up session( Reference Le-Ha, Beilin and Burrows 45 ). The lack of sensitivity of the DGI-CA as a predictor of change poses an additional limitation to this study. The fact that DGI-CA did not change over time, despite the observed change in its individual components, suggests that the scale is not sensitive enough to reflect change in dietary intake that may be associated with changes in the outcome.
The present study is the first assessing the level of adherence to the dietary guidelines longitudinally in a large adolescent population and the first to determine the association of the dietary guidelines with cardiometabolic risk factors. However, because DGI-CA in its current form does not penalise overconsumption of the five main food groups, we cannot extrapolate whether adherence to the current dietary guidelines prevents adverse effects of the cardiometabolic risk factors. Future research is, thus, needed to address this question after first revising and revalidating the DGI-CA. Although we have an adequate sample size, our range of the DGI-CA scores is not extensive enough to postulate a level of adherence to the guidelines that associates with a reduction in cardiometabolic risk factors. This can be addressed by future meta-analysis of DGI-CA studies, gathering enough participants with a wider range of the DGI-CA scores.
Based on the current DGI-CA, the level of adherence to the dietary guidelines in the 14- and 17-year-old adolescents participating in the Raine Study is suboptimal, but comparable to the Australian Children's Nutrition and Physical Activity Survey( Reference Golley, Hendrie and McNaughton 16 ). We showed a positive, albeit weak, association between the DGI-CA and BMI, as well as a negative association with waist:hip ratio, a measure of abdominal obesity. The DGI-CA was inversely associated with TAG, insulin, HOMA score and HR. Further longitudinal studies, particularly with better dietary assessment tools and higher retention rates, are needed to support our findings. However, refinement of the index is needed to permit linkage of the impact of diet quality on adiposity.
Supplementary material
To view supplementary material for this article, please visit http://dx.doi.org/10.1017/S0007114515001026
Acknowledgements
We gratefully acknowledge the Raine Study participants and their families, and the Raine Study Team for cohort coordination and data collection. We also thank Lynette McCahon for technical assistance.
Core funding for the Western Australian Pregnancy Cohort (Raine) Study is provided by the University of Western Australia; the Faculty of Medicine, Dentistry and Health Sciences at the University of Western Australia; the Telethon Kids Institute (formerly known as the Telethon Institute for Child Health Research); the Women and Infants Research Foundation; Curtin University; and the Raine Medical Research Foundation. Specific data collection for the 14-year follow-up was funded by the National Health and Medical Research Council (project grant ID 211912) and the Telstra Research Fund (2003–6). Data collection and biological specimens at the 17-year follow-up were funded by the National Health and Medical Research Council (program grant ID 353514 and project grant ID 403981). The above-mentioned funders had no role in the design and analysis of the study or in the writing of the manuscript. W L. C. S. P.-D. is the recipient of an A & A Saw Postdoctoral Fellowship from the Faculty of Dentistry, Medicine and Health Sciences and the University of Western Australia.
None of the authors has any conflict of interest to declare.
The authors' contributions are as follows: W. L. C. S. P.-D. provided the idea for the analysis, analysed the data and wrote the manuscript; L. J. B., T. A. M. and W. H. O. designed and conducted the original research; S. B. provided statistical guidance. All authors were responsible for critical reviews and final approval of the manuscript.


