


Several approaches have been used for the identification of dietary patterns linked to improved health status of individuals( Reference Kant 1 – Reference Brunner, Mosdol and Witte 4 ). Indicators of total food variety have been associated with improved nutritional status, particularly in developing countries( Reference Drewnowski, Henderson and Shore 5 – Reference Steyn, Nel and Nantel 9 ), and higher food variety has been associated with reduced diabetes and colorectal cancer prevalence( Reference Fernandez, Negri and La Vecchia 10 – Reference Wahlqvist, Lo and Myers 12 ). In developed countries, it has been suggested that specific variety from healthy or recommended foods is protective against all-cause mortality and chronic disease( Reference Kant, Graubard and Schatzkin 3 , Reference Kant, Schatzkin and Graubard 13 – Reference Kaluza, Hakansson and Brzozowska 16 ). An objective identification of such healthier foods whose consumption should be recommended could assist in the development of food-based dietary guidelines that implicitly include dietary variety as a parameter( 17 – 20 ).
Nutrient profiling is defined by the WHO as ‘the science of classifying or ranking foods according to their nutritional composition for reasons related to preventing disease and promoting health’( 21 ). A nutrient profile model developed for the UK regulator for broadcast media (Ofcom) is being used for regulatory purposes in its original or adapted version in the UK, the Republic of Ireland, and Australia and New Zealand( 22 – 24 ). The SAIN,LIM nutrient profile model( 25 , Reference Darmon, Vieux and Maillot 26 ) is developed for the French food safety agency as an answer to the European Union regulation on food labelling( 27 ). Other governments and commercial companies around the world have or are proposing to use different models( Reference Rayner, Scarborough and Kaur 28 ).
Selecting healthier foods as defined by nutrient profile models would provide a robust basis to assess the impact on health of an increased variety from selected healthier foods, and to compare with the health effect of an increased total food variety. The use of longitudinal data would allow assessing prospective associations with chronic disease risk and mortality events, ensuring the temporality of the associations. The aim of the present study was to assess, within the British Whitehall II cohort, the associations between total food variety and variety from selected healthier foods identified using the UK Ofcom and French SAIN,LIM nutrient profile models and prospective risk of coronary events and diabetes, and mortality.
Subjects and methods
The Whitehall II cohort
The target population of the Whitehall II study was all civil servants aged 35–55 years working in the London offices of twenty Whitehall departments in 1985–8. A response rate of 73 % led to the recruitment of 10 308 participants, invited to the research clinic at 5-year intervals and receiving a postal questionnaire between clinic phases( Reference Marmot and Brunner 29 ). The last completed clinical phase ended in December 2009. The study was conducted according to the guidelines laid down in the Declaration of Helsinki, and all procedures involving human subjects were approved by the University College London Research Ethics Committee. Written informed consent was obtained from all subjects and renewed at each contact.
Dietary assessment and baseline covariates
Detailed dietary assessments were introduced between 1991 and 1993, the baseline for the present analysis. Dietary intakes were reported in a validated 127-item FFQ( Reference Willett, Sampson and Stampfer 30 , Reference Brunner, Stallone and Juneja 31 ). The FFQ was completed by 7935 respondents. For all items in the FFQ, participants were asked to report their frequency of eating a common unit or portion size during the previous year in nine predefined categories ranging from ‘never or less than once per month’ to ‘6+/d’.
Clinical examinations were conducted by trained staff at the study clinic or at home. As described in full elsewhere( Reference Marmot and Brunner 29 , Reference Brunner, Marmot and White 32 ), height, weight, blood pressure and serum lipids were collected following standard procedures. Employment grade within the British Civil Service (six levels) was used as the measure of adult socio-economic position. Ethnicity (white, South Asian, Afro-Caribbean or other), marital status (married, single, widowed or divorced), smoking habit (never, ex-smoker or current), leisure-time physical activity (hours mild, moderate and vigorous activity per week), prevalence of longstanding illness and medication use were self-reported in the general health questionnaire.
BMI was calculated as the ratio between weight (kg) and height squared (m2); subjects were classified as overweight/obese if their BMI was ≥ 25·0 kg/m2. Hypertension was defined as systolic or diastolic blood pressure ≥ 140 or ≥ 90 mmHg, respectively, or by the use of hypertensive drugs( Reference Whitworth 33 ). Dyslipidaemia was defined as serum LDL-cholesterol ≥ 4·1 mmol/l, or serum HDL-cholesterol ≤ 0·9 mmol/l (men) or ≤ 1 mmol/l (women), or serum TAG ≥ 1·7 mmol/l, or by the use of lipid-lowering drugs( 34 , Reference Alberti and Zimmet 35 ).
Outcomes follow-up
Mortality data (median follow-up 17·7 years, range 0·08–18·4 years), including the cause of death, were available through the National Health Service Central Registry until 31 January 2010. Death certificates were coded using the 9th or 10th revision of the International Classification of Disease (ICD). A total of 915 incident deaths were recorded within the 171 267 person-years of follow-up (mean 16·8 (sd 2·67) years per person). Of these, 419 were attributable to cancer (ICD-9 codes 140–209 except 173 and ICD-10 codes C00–C97 except C44), 259 to CVD (ICD-9 codes 390–458 and ICD-10 codes I00–I99) and 143 to CHD (ICD-9 codes 410–414 and ICD-10 codes I20–I25).
Potential cases of non-fatal myocardial infarction up to 30 December 2009 have been ascertained by questionnaire items on chest pain( Reference Rose 36 ), doctors' diagnoses and hospitalisations (NHS Hospital Episode Statistics database), as described in full elsewhere( Reference Brunner, Mosdol and Witte 4 ). Myocardial infarction was defined as negative when self-reported only. A total of 416 incident fatal CHD and non-fatal myocardial infarction cases were identified in the 140 641 person-years of follow-up (mean 14·5 (sd 5·24) years per person).
Incident cases of diabetes up to 30 December 2009 have been identified by self-report of doctor's diagnosis, diabetic medication and 2 h 75 g oral glucose tolerance test in clinical phases, according to the 1999 WHO classification( 37 ), as described previously( Reference Brunner, Mosdol and Witte 4 ). A total of 927 incident cases of diabetes were identified with a mean follow-up of 13·9 (sd 4·27) years per person (total 114 209 person-years).
The UK Ofcom and SAIN,LIM nutrient profile models
The UK Ofcom nutrient profile model is a two-category model, scoring food and drinks separately, but using the same basic algorithm – a semi-continuous score based on nutrient and ingredient content – as a basis to define products that are ‘healthier’ and ‘less healthy’. The detailed algorithm has been presented elsewhere( Reference Rayner, Scarborough and Lobstein 38 ). The Ofcom model incorporates on a single scale the following components per 100 g of food: saturated fats, Na, total sugar and energy as the negative components; and protein, fibre and fruit, vegetable, and nut content as the positive components.
The SAIN,LIM nutrient profile model was proposed by the French Food Safety Agency( 25 , Reference Darmon, Vieux and Maillot 26 ). It is based on two sub-scores: the SAIN that includes eight positive nutrients (protein, fibre, vitamin C, Ca, Fe, and the optional vitamin D, vitamin E and α-linolenic acid) calculated per 418 kJ (100 kcal) of food; and the LIM that includes three negative nutrients calculated per 100 g of food (saturated fats, free sugars and Na). Thresholds are defined for each of these sub-scores to define four healthiness classes, with foods from the first class being the ‘healthiest’ since having a SAIN and a LIM, respectively, higher and lower than the related thresholds, and those in the fourth class being the ‘least healthy’.
The Ofcom and SAIN,LIM nutrient profile models were applied to all the items of the FFQ, using the respective nutrient content information. The Ofcom and SAIN,LIM models identified sixty-one and forty-nine healthy items, and fifty-three and thirty-nine unhealthy items, respectively. Alcoholic drinks were excluded from the analyses.
Food variety scores
Five variety scores were calculated for each individual. The food variety score (FVS) was simply the number of FFQ items reported to be consumed more than once a week( Reference Hatloy, Torheim and Oshaug 6 ). The recommended food variety scores (RFV(Ofcom) and RFV(SAIN,LIM)) were derived similar to the FVS, counting only the foods identified as ‘healthier’ and ‘healthiest’ by the Ofcom and SAIN,LIM models, respectively. In addition, to adjust the variety of recommended foods for the variety from less healthy foods, the non-recommended food variety scores (NRFV(Ofcom) and NRFV(SAIN,LIM)) were computed similar to the RFV selecting foods identified as ‘less healthy’ and ‘least healthy’ by the Ofcom and SAIN,LIM models, respectively.
Statistical analyses
Spearman rank correlations were assessed between the five variety scores. Baseline participant characteristics were tested for heterogeneity across quartiles of all variety scores using one-way ANOVA or χ2 tests. Nutrients and food groups intakes were expressed in density, i.e. on a constant energy basis.
To assess the overall nutritional status, the variety scores were tested against the mean adequacy ratio (MAR) and the mean excess ratio (MER), which do not include variety in their algorithm. The MAR was used to assess average nutritional adequacy for nineteen micronutrients (Ca, Mg, P, Na, K, Cl, Fe, Zn, Cu, I and vitamins A, B1, B2, B3, B6, B9, B12, C and D); it was calculated as follow( Reference Madden, Goodman and Guthrie 39 ):
 $$\begin{eqnarray} MAR = { \sum _{1}^{19} }\,\frac {intake_{ i }}{DRV_{ i }}\ast \frac {100}{19}, \end{eqnarray}$$
where intake i is the daily intake of nutrient i and DRV i the respective British Dietary Reference Value( 40 ), taking into account the age and sex of each individual. If intake i /DRV i >1, then intake i /DRV i = 1.
The MER represented a mean percentage of intakes above maximal recommended amounts for saturated fats, Na and free sugars and was calculated as follows( Reference Vieux, Soler and Touazi 41 ):
 $$\begin{eqnarray} MER = \left ({ \sum _{1}^{3} }\,\frac {intake_{ j }}{MRV_{ j }}\ast \frac {100}{3}\right ) - 100, \end{eqnarray}$$
where intake j is the daily intake of either saturated fats, Na or free sugars, and MRV j the respective maximum recommended value (22 g, 3153 mg and 50 g, respectively). If intake j /MRV j < 1, then intake j /MRV j = 1
Cox proportional hazard regressions( Reference Cox 42 ) were fitted between quartiles of the variety scores and prospective outcomes, using follow-up time in years as time variable. Prevalent cases at baseline were excluded from the analyses. The FVS was assessed individually. To assess independently the effect of healthier and less healthy food variety, the RFV and NRFV scores linked to the same nutrient profile model were mutually adjusted following the approach of Kaluza et al. ( Reference Kaluza, Hakansson and Brzozowska 16 ) and Michels et al. ( Reference Michels and Wolk 14 ) Base models were adjusted for age, sex, ethnicity and total energy intake. Further adjustment included marital status, employment grade, smoking status, physical activity level, alcohol intake, BMI categories and prevalence of longstanding illness. Proportional hazard assumption was tested using scaled Schoenfeld residuals( Reference Schoenfeld 43 ). Linear trend was assessed by including quartiles of variety scores as continuous variables. All analyses were conducted on a complete case dataset (n 7251) to allow comparison between different levels of adjustment, using the SAS version 9.3 software (SAS Institute, Inc.).
In order to take some account of reporting bias and reverse causality, Cox regressions were conducted excluding either low- and high-energy reporters identified using Goldberg cut-off values( Reference Black 44 ), or individuals that declared a prevalent longstanding illness or the use of anti-hypertensive or lipid-lowering medication at baseline.
The Ofcom score includes fruit, vegetable and nut content as a positive component in its algorithm. Multi-adjusted Cox regressions further including fruit, vegetable, and nut intake as covariate were conducted to assess the contribution of fruit and vegetable intake on the overall results.
Results
Total food variety was positively correlated with variety of both healthier and less healthy foods (Table 1). RFV and NRFV scores derived from the same nutrient profile model were moderately correlated; correlations were highest between the two RFV scores and the two NRFV scores. Since the main objective of the present study was to compare the effects between increased total variety and increased variety from selected healthier foods, results for the NRFV score are presented in online Supplementary Tables S1–S7.
Table 1 Descriptive statistics and Spearman's correlations between the five variety scores (n 7251)
FVS, food variety score (total food variety); RFV, recommended food variety score (healthier food variety); NRFV, non-recommended food variety score (less healthy food variety); Ofcom, UK Ofcom nutrient profiling model( Reference Rayner, Scarborough and Lobstein 38 ); SAIN,LIM, score for the nutritional adequacy of individual foods, score for disqualifying nutrients( Reference Darmon, Vieux and Maillot 26 ).
Baseline characteristics
For all variety scores, a positive association was observed with high employment grade, and inverse associations with current smoking, physical inactivity and being single (Table 2 and online Supplementary Table S1). Men were more likely to have a higher FVS and NRFV scores, but lower RFV scores; age was positively associated with the RFV scores, and negatively with the NRFV scores. The FVS and RFV (Ofcom) scores were positively associated with prevalent overweight or obesity (i.e. BMI ≥ 25 kg/m2). Higher prevalence of longstanding illness was associated with higher RFV scores.
Table 2 Baseline sociodemographic and risk factor characteristics across variety score quartiles (Mean values with their standard errors; number of subjects and percentages, n 7251)

FVS, food variety score (total food variety); RFV, recommended food variety score (healthier food variety); Ofcom, UK Ofcom nutrient profiling model( Reference Rayner, Scarborough and Lobstein 38 ); SAIN,LIM, score for the nutritional adequacy of individual foods, score for disqualifying nutrients( Reference Darmon, Vieux and Maillot 26 ).
* Test for heterogeneity across quartiles, based on ANOVA for continuous variables, χ2 test for categorical variables.
The five variety scores were associated with increased energy intake, the trend being strongest for the NRFV scores and the FVS (Table 3 and online Supplementary Table S2). The FVS was positively associated with the intake – in g/MJ– of salted snacks and sweets, fish and shellfish, fruit and nuts, and vegetables. The FVS was inversely associated with the intake of dairy products and breads; no association was observed for other food groups. The two RFV scores were positively associated with the consumption of breakfast cereals and other starches, fish and shellfish, fruit and nuts, and vegetables, and inversely with the intake of breads, and salted snacks and sweets (Table 3). Consumption of dairy products was not associated with the RFV scores. The two NRFV scores were inversely associated with the intake of all food groups except salted snacks and sweets (online Supplementary Table S2).
Table 3 Baseline dietary characteristics across variety score quartiles (Mean values with their standard errors)
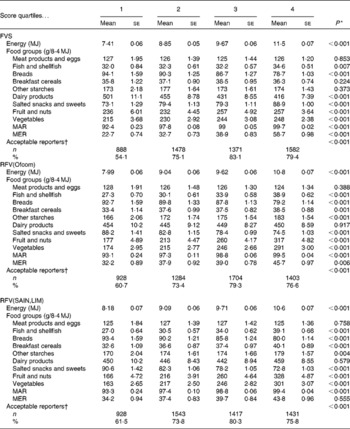
FVS, food variety score (total food variety); MAR, mean adequacy ratio( Reference Madden, Goodman and Guthrie 39 ); MER, mean excess ratio( Reference Vieux, Soler and Touazi 41 ); RFV, recommended food variety score (healthier food variety); Ofcom, UK Ofcom nutrient profiling model( Reference Rayner, Scarborough and Lobstein 38 ); SAIN,LIM, score for the nutritional adequacy of individual foods, score for disqualifying nutrients( Reference Darmon, Vieux and Maillot 26 ).
* Test for heterogeneity across quartiles, based on ANOVA for continuous variables, χ2 test for categorical variables.
† Acceptable energy reporters identified using Goldberg cut-off values( Reference Black 44 ).
The FVS and RFV scores were positively associated with overall nutritional adequacy of the diet as indicated by the MAR (Table 3). The FVS and the NRFV scores were positively associated with the MER. The RFV (Ofcom) was weakly, but positively, associated with the MER; there was no association with the RFV(SAIN,LIM). All scores were inversely associated with energy misreporting (both low and high energy reporting). Most associations between the variety scores and macro- and micronutrients intake followed the trends highlighted by the MAR and MER (online Supplementary Table S3).
Survival analyses
The FVS was linearly associated with prospective risk reduction of fatal and non-fatal CHD and all-cause mortality in the base models (Table 4). Further adjustment attenuated the linear trend estimates, which indicated a borderline significant risk reduction of 11 and 8 % for CHD and all-cause mortality, respectively; the hazard ratio estimates for the fourth quartile (v. first) of FVS indicated risk reductions of 39 and 26 % for CHD and all-cause mortality, respectively. A protective association was also suggested for cancer mortality, but estimates were not significant.
Table 4 Hazard ratio (HR) estimates across variety score quartiles for the risk of fatal and non-fatal CHD, all-cause mortality and cancer mortality (Hazard ratios and 95 % confidence intervals)

FVS, food variety score (total food variety); Ref, reference; RFV, recommended food score (healthier food variety); Ofcom, UK Ofcom nutrient profiling model( Reference Rayner, Scarborough and Lobstein 38 ); SAIN,LIM, score for the nutritional adequacy of individual foods, score for disqualifying nutrients( Reference Darmon, Vieux and Maillot 26 ).
* Model 1 adjusted for age, sex, ethnicity and energy intake; Model 2 further adjusted for marital status, employment grade, smoking status, physical activity level, alcohol intake, BMI categories and prevalence of longstanding illness. Models including the RFV were further adjusted for variety of less healthy foods.
† Linear trend was assessed using quartiles as continuous variable.
A protective effect of the RFV(Ofcom) on prospective all-cause and cancer mortality was observed in the base and fully adjusted models, significant estimates indicating an approximate 30 % risk reduction for the second and third quartiles (v. first; Table 4). Similar protective effects were suggested for the RFV(SAIN,LIM) second, third and fourth quartiles (v. first), but were not robust to multi-adjustment. For both RFV scores, there was no association with CHD risk. Overall, a higher variety of unhealthy foods, as measured by the NRFV scores, was not associated with prospective risk of CHD, and cancer and all-cause mortality (online Supplementary Table S4).
Similar trends were observed for CVD mortality risk, although the small number of cases led to wider CI and non-significant results (online Supplementary Table S5). No robust association could be observed between the variety scores and diabetes risk (online Supplementary Table S5). Prospective associations were investigated with diet-related cancer mortality (seventy-five cases), but no associations could be observed (data not shown).
Post hoc analyses: diet misreporting and reverse causation
The exclusion of low and high energy reporters (n 1387 and 545, respectively) attenuated most associations observed between the variety scores and the risk of CHD (models M2-rep in online Supplementary Table S6); the risk reductions obtained with the full sample with the FVS remained suggested, but estimates were non-significant. The protective effect of the FVS on cancer mortality risk was reinforced but with wider CI. The cancer and all-cause mortality risk reductions previously observed with the RFV(Ofcom) were confirmed.
Excluding individuals who reported a prevalent illness (n 2427; models M2-ill in online Supplementary Table S6) confirmed the protective effect of the FVS on both CHD and all-cause mortality risk. The protective association between the RFV scores and all-cause mortality were equally confirmed. No significant estimates were observed for the NRFV scores. Excluding individuals who reported the use of anti-hypertensive or lipid-lowering drug, and those for whom follow-up time was less than 2 years, led to similar conclusions (data not shown).
Further adjusting the Cox regression for fruit, vegetable and nut intake did not modify the overall conclusions (online Supplementary Table S7). Associations with cancer mortality were slightly attenuated; the protective effect of total variety on fatal and non-fatal CHD was confirmed.
Discussion
The present study assessed the prospective associations between both total food variety and variety from recommended – or healthier – foods (FVS and RFV scores, respectively) and adverse health outcomes over a long follow-up period. In contrast to previous investigations( Reference Michels and Wolk 14 , Reference Kaluza, Hakansson and Brzozowska 16 ), the recommended foods included in the RFV scores were based on validated nutrient profile models. In multi-adjusted survival analyses, total food variety was protective against the risk of fatal and non-fatal CHD, and all-cause mortality. Similar associations were suggested for cancer and CVD mortality risk, but estimates were not significant. Middle quartiles (v. first) of the RFV(Ofcom) were associated with cancer and all-cause mortality risk reduction. Similar risk reductions were suggested for the RFV(SAIN,LIM), but were not robust to adjustment. Higher variety of non-recommended foods (NRFV scores) was not associated with prospective health status. Post hoc analyses did not alter conclusions, including when adjusting for fruit, vegetable and nut intake.
Consistent with previous observations( Reference Drewnowski, Henderson and Shore 5 – Reference Steyn, Nel and Nantel 9 , Reference Kant, Schatzkin and Graubard 13 , Reference Michels and Wolk 14 , Reference Kaluza, Hakansson and Brzozowska 16 ), Whitehall II participants with higher FVS and RFV scores had a higher nutritional adequacy and a higher energy intake. They were also more likely to have a higher employment grade and to be more active, and less likely to be current smokers. These results strengthen previous evidence that diet variety, especially from recommended foods, is associated with healthier behaviours( Reference Kant, Schatzkin and Graubard 13 , Reference Michels and Wolk 14 , Reference Kaluza, Hakansson and Brzozowska 16 ) and further explain the protective effect of dietary variety on prospective mortality and CHD risk. However, participants with higher FVS and RFV scores were more likely to be obese or overweight. These associations were weak but significant (except for RFV(SAIN,LIM)) and had not previously observed in Swedish and North-American women( Reference Kant, Schatzkin and Graubard 13 , Reference Michels and Wolk 14 ), may be explained by socio-demographic characteristics of Whitehall II participants. In the UK, the prevalence of overweight or obesity is higher in men and in men with lowest income households, i.e. closer to the profile of participants with higher FVS( Reference Sutton, Craig and Mindell 45 ). In line with observations made in the USA( Reference Kant, Schatzkin and Graubard 13 ), age was positively associated with RFV scores, which would have explained the association between RFV scores and the prevalence of overweight and obesity.
A strength of the present study was the use of the Whitehall II cohort, in which participants have well-characterised health status and precisely determined socio-economic characteristics through repeated questionnaires and clinical examinations( Reference Marmot and Brunner 29 ). Dietary intakes have been reported in a validated FFQ( Reference Brunner, Stallone and Juneja 31 ), and dietary patterns identified either with cluster analysis or the Alternative Healthy Eating Index have been associated with the prospective risk of CHD, diabetes and mortality outcomes( Reference Brunner, Mosdol and Witte 4 , Reference Akbaraly, Ferrie and Berr 46 ). However, the Whitehall II sample size was smaller compared with previous examinations assessing health effects of recommended and non-recommended food variety( Reference Michels and Wolk 14 , Reference Kaluza, Hakansson and Brzozowska 16 ), resulting in a lower statistical power and wider CI. The exclusion of energy misreporters and individuals with reported prevalent longstanding illness further reduced the sample size, not allowing for robust conclusions despite the strength of the suggested associations.
A limitation of the present study was in the definition of the variety scores since they were very dependent on the FFQ tool itself. The Whitehall II FFQ put more emphasis on fruit and vegetables (thirty-four items) compared with meat and fish products (16), dairy products (13) or snack foods (12). Hereby, participants with higher FVS or RFV scores were mechanically more likely to have a varied and increased intake of fruit and vegetables. Nevertheless, post hoc analyses adjusted for fruit and vegetable intake did not alter the conclusions. The use of alternative dietary assessment methods with no pre-defined list of food items such as dietary records or 24 h recalls could help in overcoming such limitation. Latest national dietary surveys in the UK, USA and France used such dietary assessment methods( Reference Bates, Lennox and Bates 47 – 49 ); however, these rarely include follow-up for incident chronic disease and/or mortality. In addition, all variety scores had a minimum of zero. These very low scores could be explained by either a very high dietary variety (i.e. more foods consumed less than once a week) or by underreporting. Sensitivity analyses excluding 1 % of participants at the extremes of the variety score distributions did not alter the conclusions (data not shown), and Cox models excluding energy misreporters did not alter the conclusions from this report (post hoc analysis).
The stronger effects observed with the RFV scores compared with the NRFV scores, in particular, the cancer and all-cause mortality risk reduction observed with the middle quartiles of RFV(Ofcom), supported the rationale to promote higher variety of healthier foods and the move of Dietary Guidelines for Americans from the ‘Eat a variety of food message’ in 1995( 50 ) to the ‘Eat a variety of vegetables’ and ‘Choose a variety of protein foods’ messages in 2010( 20 ). As recently illustrated, individuals tend to focus more on less healthy foods when thinking of healthy diets( Reference Macdiarmid, Loe and Kyle 51 ). The present results, which would need confirmation in larger data sets and using alternative nutrient profile models, therefore, suggest that more focus should be put on promoting healthier foods and total food variety.
In the present study and unlike previous observations, the significant protective associations of the RFV(Ofcom) score were observed in the middle quartiles, suggesting that intermediate variety of healthier foods may be more favourable than higher variety of such foods. In previous studies, the ‘Recommended’ foods were defined on an a priori basis using food-based dietary guidelines( Reference Michels and Wolk 14 , Reference Kaluza, Hakansson and Brzozowska 16 , Reference Larsson, Akesson and Wolk 52 ), i.e. essentially linked to the identification of healthier dietary patterns rather than foods per se, which may have led to the stronger and linear protective effects. As an example, in the recent study by Larsson et al. ( Reference Larsson, Akesson and Wolk 52 ), all fruit and vegetables and all fish products, but no meat or poultry products often associated with Western style dietary patterns, were included in the recommended food score. In addition, both the UK Ofcom and SAIN,LIM models were virtually across-the-board, i.e. they scored almost all foods using a similar algorithm. Such approach, although allowing to better align classification of foods with existing dietary guidelines, may not be the most appropriate to identify healthier dietary patterns( Reference Scarborough, Arambepola and Kaur 53 ). Conducting similar analyses using category-specific models would allow assessing whether the present results could be explained by the choice of nutrient profile models.
Previous results regarding the association between increased variety of non-recommended foods and prospective health outcomes have not been consistent. No association has been found with all-cause mortality risk in a cohort of Swedish women( Reference Michels and Wolk 14 ); however, a positive association was observed with the risk of stroke in the same population( Reference Larsson, Akesson and Wolk 52 ). A positive association with all-cause mortality risk was observed in Swedish men( Reference Kaluza, Hakansson and Brzozowska 16 ). In addition, dietary variety of sweets, snacks, condiments, carbohydrates and entrées was associated with increased body fatness in a small US population( Reference McCrory, Fuss and McCallum 54 ). No robust associations could be identified in the present study.
The use of nutrient profiling to identify the recommended (or healthier) and non-recommended (or less healthy/unhealthy) foods was another strength of the present analysis since no previous assumption was made on the healthiness of particular foods. The stronger associations observed with the UK Ofcom nutrient profile model indicated that it may be a more adequate model to identify dietary patterns predictive of improved health status, compared with the SAIN,LIM. This result may be explained by the fact that the SAIN,LIM model was more restrictive when selecting healthier foods. As opposed to the RFV(Ofcom), foods such as pears, grapes, wholemeal bread, brown rice, boiled potatoes or vegetable soups were not included in the RFV(SAIN,LIM). In contrast, full-fat milk products were considered healthier by the SAIN,LIM and not by the UK Ofcom model. However, Darmon et al. ( Reference Darmon, Vieux and Maillot 26 ) have indicated that the SAIN,LIM did identify ‘most unrefined starches and grains’ as healthier in a French database. Differences in food composition database may explain these diverging classifications of foods, as well as the fact the Whitehall II FFQ items were calculated as weighted average of several individual foods, i.e. not reflecting the true nutrient content of specific foods. In addition, the SAIN,LIM was developed and validated using French data; an adaptation of criteria and target values may be needed when implementing the model on foreign data. The inclusion in the UK Ofcom algorithm of fruit, vegetable and nut content as a positive nutritional component could have explained the stronger associations; however, analyses adjusted for fruit, vegetable and nut intake did not alter the conclusions.
To the best of our knowledge, only one study has linked a nutrient profile model, the US Overall Nutrition Quality Index (ONQI), to prospective risk of chronic disease and mortality( Reference Chiuve, Sampson and Willett 55 ). A diet index based on the ONQI was associated with modest reduced risk of total chronic disease, CVD, diabetes and total mortality in the US Nurses' Health study and Health Professionals Follow-up Study datasets. Unlike the RFV scores, the ONQI diet index did not account for diet variety. Cross-validation of the present results with the ONQI model and in the two US data sets would strengthen the nutrient profiling rationale.
The results from the present analysis strongly support the inclusion of messages recommending increased overall diet variety and variety from healthier foods in public health recommendations. In this respect, nutrient profiling could become the most adequate tool to help identify healthier foods; however, more research is needed to assess nutrient profile models and their ability to predict prospective health in various populations. The consistency with previous results with regard to the association between food variety and nutritional adequacy would support the generalisability of the present findings. The use of alternative datasets, and more particularly alternative dietary assessment tools, should therefore confirm the beneficiary health effects of total food variety and variety of healthier food options.
Supplementary material
To view supplementary material for this article, please visit http://dx.doi.org/10.1017/S000711451500094X
Acknowledgements
The authors thank all the participating civil service departments and their welfare, personnel and establishment officers; the Occupational Health and Safety Agency; the Council of Civil Service Unions; all participating civil servants in the Whitehall II study; and all the members of the Whitehall II study team.
The present study was supported by the British Heart Foundation (FS/08/043/25495) and the French Agence Nationale de la Recherche (ANR-11-ALID-0002). The Whitehall II study was supported by grants from the Medical Research Council; Economic and Social Research Council; British Heart Foundation; Health and Safety Executive; Department of Health; National Heart Lung and Blood Institute (HL36310), US, NIH; National Institute on Aging (AG13196), US, NIH; Agency for Health Care Policy Research (HS06516); and the John D. and Catherine T. MacArthur Foundation Research Networks on Successful Midlife Development and Socioeconomic Status and Health. The funders had no role in the study design and analysis, decision to publish, or in the preparation of the manuscript.
All authors declare no conflict of interest.
The authors' contributions are as follows: G. Masset conceived the analysis, analysed the data and drafted the first manuscript; P. S., M. R., E. J. B. and G. Mishra provided the essential materials and assisted with the preparation of the manuscript. All authors contributed in drafting the final manuscript.


