


Vitamin D deficiency has been well described in the US population. Results from the National Health and Nutrition Examination Survey 2001–6 suggest that vitamin D deficiency is highly prevalent in the US population, with approximately 32 % of adults exhibiting vitamin D deficiency (defined as serum 25-hydroxyvitamin D (25(OH)D) concentrations < 50 nmol/l) and approximately 76 % exhibiting vitamin D insufficiency (defined as serum 25(OH)D concentrations < 75 nmol/l). The prevalence is increased in blacks than in other race and ethnic groups, where the prevalence of vitamin D deficiency and insufficiency has been reported to be 73 and 97 %, respectively( Reference Ganji, Zhang and Tangpricha 1 ). The high prevalence of vitamin D deficiency may have important implications for extra-skeletal health as this deficiency is associated with a number of disease processes, including heart disease, cancer and infections( Reference Kendrick, Targher and Smits 2 – Reference Yamshchikov, Desai and Blumberg 4 ). Recently, vitamin D deficiency has also been found to be associated with anaemia( Reference Perlstein, Pande and Berliner 5 , Reference Sim, Lac and Liu 6 ).
Anaemia is characterised by a decrease in concentration of erythrocytes or Hb, resulting in impaired oxygen transport throughout the body. Furthermore, it is associated with a number of chronic conditions, including kidney disease and CVD( Reference Robinson 7 , Reference Sarnak, Tighiouart and Manjunath 8 ). The association between vitamin D status and anaemia has been shown in various populations, including children, the elderly, chronic kidney disease patients and those with heart failure( Reference Perlstein, Pande and Berliner 5 , Reference Atkinson, Melamed and Kumar 9 – Reference Zittermann, Jungvogel and Prokop 11 ). However, the relationship between anaemia and vitamin D status in the generally healthy adult US population has not been well described.
Previous studies have revealed that the strongest association between vitamin D status and anaemia may be of anaemia with inflammation( Reference Perlstein, Pande and Berliner 5 ). The mechanism underlying this relationship involves the antimicrobial peptide hepcidin, a hormone involved in the regulation of Fe recycling in the body that is induced by pro-inflammatory cytokines including IL-6( Reference Krause, Neitz and Mägert 12 – Reference Nemeth, Rivera and Gabayan 14 ). Under chronic inflammatory conditions, Fe can become sequestered within the cells of the reticuloendothelial system and become unavailable for erythropoiesis, which may ultimately lead to anaemia( Reference Weiss and Goodnough 15 , Reference Roy and Andrew 16 ). Recently, vitamin D has been reported to lower inflammatory cytokines implicated in the pathophysiology of anaemia with inflammation( Reference Zughaier, Alvarez and Sloan 17 ), and suppress expression of hepcidin mRNA( Reference Bacchetta, Zaritsky and Sea 18 ). Thus, vitamin D may reduce the risk of anaemia through its anti-inflammatory effects.
The present paper aims to examine the association between vitamin D status and anaemia in a generally healthy adult population. Based on the putative mechanism that vitamin D lowers pro-inflammatory cytokines, we hypothesised that lower vitamin D status would be associated with increased odds of anaemia, particularly anaemia with inflammation. In addition, given that the prevalence of vitamin D deficiency is higher in blacks than in whites, and lower Hb concentrations have been reported in blacks than in whites( Reference Patel, Longo and Ershler 19 , Reference Zakai, McClure and Prineas 20 ), we hypothesised that there would be significant effect modification by race in the association between vitamin D and anaemia.
Materials and methods
Study population
Participants were recruited from the Emory University/Georgia Institute of Technology (Georgia Tech) Predictive Health Institute cohort within the Center for Health Discovery and Well Being( Reference Brigham 21 ). This is a cohort of generally healthy adults (age ≥ 18 years) living in Atlanta, Georgia, and working in a university setting. Recruitment into the cohort was based on invitation to a random list of Emory employees and members of the Emory and Georgia Tech communities. Exclusion was based on hospitalisation for acute or chronic disease within the previous year; severe psychosocial disorder within the previous year; addition of new prescription medications to treat a chronic condition within the previous year (with the exception of changes in anti-hypertensive or anti-diabetic agents); history of substance/drug abuse or alcoholism; existing active malignant neoplasm; history of malignancy other than localised basal cell cancer of the skin during the previous 5 years; uncontrolled or poorly controlled autoimmune, cardiovascular, endocrine, gastrointestinal, haematologic, infectious, inflammatory, musculoskeletal, neurologic, psychiatric or respiratory disease; and any acute illness in the 12 weeks before baseline visits. Participants enrolled between January 2008 and February 2013. Those with available serum 25(OH)D and Hb concentrations were included in this analysis. The present study was conducted according to the guidelines laid down in the Declaration of Helsinki, and all procedures involving human subjects were approved by the Emory University Institutional Review Board. Written informed consent was obtained from all participants.
Data collection
Upon enrolment, participants completed questionnaires on demographic information, personal and family health history, existing health status, and medication and supplement use. Physical activity was assessed via the Cross-Cultural Activity Participation Study Physical Activity Questionnaire( Reference Whitt, Levin and Ainsworth 22 ) and glomerular filtration rate was estimated, as a marker of kidney function, using the Modification of Diet in Renal Disease equation( Reference Levey, Bosch and Lewis 23 ). Venepuncture for biochemical measurements was performed after an overnight fast. Serum 25(OH)D concentrations were measured commercially via liquid chromatography/tandem MS in a laboratory that participates in the Vitamin D External Quality Assessment Scheme (Quest Diagnostics). Markers of Fe status were measured as follows: serum ferritin via immunoassay, total serum Fe and Fe-binding capacity via spectrophotometry and Hb and haematocrit via HPLC (Quest Diagnostics). Serum high-sensitivity C-reactive protein (CRP) was measured using nephelometry (Quest Diagnostics). Serum IL-6, IL-8, TNF-α and interferon-γ concentrations were measured using a Fluorokine® MultiAnalyte Profiling multiplex kit (R&D Systems) with a Bio-Plex analyzer (Bio-Rad).
Definitions
Anaemia was defined based on the WHO criteria as Hb concentration < 130 g/l for men and < 120 g/l for women( Reference McLean, Cogswell and Egli 24 ). Anaemia was further categorised into sub-types based on inflammation status. Participants with anaemia who had CRP concentrations >3 mg/l or were in the upper quartile of IL-6 concentration ( ≥ 1·76 pg/ml) were classified as having anaemia with inflammation. Those with CRP concentrations ≤ 3 mg/l or who were in the lower three quartiles of IL-6 concentrations ( < 1·76 pg/ml) were classified as having anaemia without inflammation. The CRP cut-off point used was based on the American Heart Association determination of an increased risk of heart disease with CRP concentrations >3 mg/l( Reference Pearson, Mensah and Alexander 25 ). Given its role in upregulating hepcidin expression( Reference Nemeth, Rivera and Gabayan 14 ), IL-6 was incorporated into our definition of inflammation; however, in the absence of a standard clinical cut-off point, inflammation was defined based on the upper quartile of IL-6 in our dataset. Participants were determined to be nutrient deficient if they had evidence of Fe deficiency (serum ferritin < 12 μg/l and transferrin saturation < 15 %)( Reference Looker, Dallman and Carroll 26 ) or low serum vitamin B12 (levels < 147·6 pmol/l)( Reference Perlstein, Pande and Berliner 5 ). Other nutritional measures related to anaemia of nutrient deficiency, such as folate, were not available for this cohort.
Statistical analysis
Descriptive statistics were examined for all variables. Continuous variables were reported as means and standard deviations for normally distributed variables or medians and interquartile ranges for non-normally distributed variables; categorical variables were presented as numbers of subjects and percentages. Continuous variables not following a normal distribution were logarithmically transformed (serum ferritin and all inflammatory markers) for modelling. For variables requiring log transformation with values of zero (IL-6, TNF-α and interferon-γ), a constant of 1 was added to all non-missing values. Differences in demographic and biochemical variables by serum 25(OH)D status (dichotomised as serum 25(OH)D < 50 nmol/l compared to serum 25(OH)D concentrations ≥ 50 nmol/l, based on the Institute of Medicine guidelines)( Reference Ross, Manson and Abrams 27 ) and by race (whites compared to blacks) were examined using two sample Student's t tests for normally distributed continuous variables, Wilcoxon–MannWhitney U tests for non-normally distributed continuous variables, and χ2 or Fisher's exact test for categorical variables. Pearson's correlations and simple linear regression analyses were performed to examine bivariate associations of vitamin D status with biomarkers related the anaemia, Hb and serum Fe. To further explore these associations, multivariable linear regression analyses were performed with Hb and serum Fe as dependent variables and vitamin D status as the independent variable, controlling for age, sex, race, BMI, IL-6 and CRP as a priori covariates.
Simple logistic regression was used to examine demographic, health history and biochemical variables associated with anaemia. Multivariable logistic regression was used to assess the association between vitamin D status (independent variable) and anaemia (dependent variable). Variables that were significantly associated with anaemia in bivariate analysis were included as covariates in these models. We assessed for an interaction between vitamin D status and race using a likelihood ratio test, given that both vitamin D status and anaemia prevalence are known to differ by race group( Reference Ganji, Zhang and Tangpricha 1 , Reference Patel, Longo and Ershler 19 , Reference Zakai, McClure and Prineas 20 ).
To further explore the association of vitamin D status with anaemia with and without inflammation, multivariable logistic regression analyses were performed using anaemia with inflammation and without inflammation as dependent variables and vitamin D status as the independent variable. We assessed for interaction between race and vitamin D status using a likelihood ratio test, and included the same covariates used in the overall anaemia models (with the exception of inflammatory markers given their use in the definition of anaemia with inflammation outcome). All analyses were performed using SAS version 9.3 (SAS Institute, Inc.), with a two-sided P value < 0·05 used to define statistical significance.
Results
Participant characteristics
Of the 719 participants enrolled in the Emory/Georgia Tech Predictive Health Institute cohort as of February 2013, 638 had available serum 25(OH)D and Hb levels and were included in the present analysis. Demographic characteristics of these participants, as a whole and by vitamin D status (25(OH)D < 50 nmol/l v. 25(OH)D ≥ 50 nmol/l), are shown in Table 1. Among the whole cohort, the mean age was 48·3 (sd 10·9) years, and approximately two-thirds of the participants were female. Race and ethnicity were based on self-report and those in this cohort were primarily non-Hispanic or Latino; 72 % were white, 23 % were black/African American, 5 % were Asian and 1 % identified as another race. For the regression analyses, participants were restricted to white and black/African American (n 602). This was a relatively highly educated and affluent population. The cohort was generally overweight, and while participants were healthy by self-report, some did report a history of stable chronic conditions including hypertension and diabetes. Characteristics that differed by vitamin D status included age, race, education, income, BMI, comorbidities, supplementation and season of study visit. Among the participants with serum 25(OH)D < 50 nmol/l, the mean age was younger (P< 0·001), a greater proportion were black/African American (P< 0·001), a greater proportion reported less education (P =0·007) and lower income (P =0·007), the mean BMI was greater (P< 0·001), there was a higher prevalence of hypertension (P< 0·001) and diabetes (P= 0·002), and a lower proportion took any vitamin D (P< 0·001) or multivitamin supplements (P< 0·001), compared to those with serum 25(OH)D concentrations ≥ 50 nmol/l. Compared to whites, blacks in our cohort were younger (P= 0·002), a higher proportion were female (P< 0·001), had lower education and income levels (P< 0·001), had higher BMI (P< 0·001), had a higher prevalence of hypertension (P< 0·001) and diabetes (P= 0·04) and a higher proportion reported taking vitamin D supplements (P= 0·004) (see online Supplementary Table S1).
Table 1 Demographic, socioeconomic and health status characteristics of Emory/Georgia Tech Predictive Health Institute cohort (2008–2013)*, by serum 25-hydroxyvitamin D (25(OH)D) status (Mean values and standard deviations; number of subjects and percentages)

eGFR, estimated glomerular filtration rate.
* Restricted to participants with available vitamin D and Hb values.
† Two sample Student's t test for continuous variables, χ2 or Fisher's exact test for categorical variables, comparing 25(OH)D < 50 nmol/l and 25(OH)D ≥ 50 nmol/l.
‡ Age: n 116 and n 521 for 25(OH)D < 50 nmol/l and 25(OH)D ≥ 50 nmol/l, respectively; ethnicity: n 116 and n 521 for 25(OH)D < 50 nmol/l and 25(OH)D ≥ 50 nmol/l, respectively; race: n 116 and n 521 for 25(OH)D < 50 nmol/l and 25(OH)D ≥ 50 nmol/l, respectively; education: n 116 and n 521 for 25(OH)D < 50 nmol/l and 25(OH)D ≥ 50 nmol/l, respectively; income: n 109 and n 493 for 25(OH)D < 50 nmol/l and 25(OH)D ≥ 50 nmol/l, respectively; physical activity: n 116 and n 518 for 25(OH)D < 50 nmol/l and 25(OH)D ≥ 50 nmol/l, respectively; BMI: n 115 and n 521 for 25(OH)D < 50 nmol/l and 25(OH)D ≥ 50 nmol/l, respectively; smoking: n 115 and n 521 for 25(OH)D < 50 nmol/l and 25(OH)D ≥ 50 nmol/l, respectively; hypertension: n 115 and n 522 for 25(OH)D < 50 nmol/l and 25(OH)D ≥ 50 nmol/l, respectively; diabetes: n 115 and n 522 for 25(OH)D < 50 nmol/l and 25(OH)D ≥ 50 nmol/l, respectively; eGFR: n 116 and n 519 for 25(OH)D < 50 nmol/l and 25(OH)D ≥ 50 nmol/l, respectively; Fe supplementation: n 86 and n 431 for 25(OH)D < 50 nmol/l and 25(OH)D ≥ 50 nmol/l, respectively; season: n 116 and n 521 for 25(OH)D < 50 nmol/l and 25(OH)D ≥ 50 nmol/l, respectively.
§ Education refers to highest educational achievement; less than high school defined as less than 12th grade, completed high school defined as completion of 12th grade, some college defined as less than 4 years of college, and any graduate school includes both graduate and post-graduate education.
∥ Meet Cross-Cultural Activity Participation Study guidelines for moderate physical activity.
¶ Vitamin D supplementation from any source (alone, in combined supplement, or in multivitamin).
Among the entire cohort, approximately 50 % of the participants had serum 25(OH)D concentrations < 75 nmol/l, 18 % had serum 25(OH)D concentrations < 50 nmol/l and 3 % had serum 25(OH)D concentrations < 30 nmol/l. The mean serum 25(OH)D concentration was in the range considered sufficient (Table 2). The mean Hb was above the threshold for anaemia. Mean and median measures of Fe status were all within normal ranges( Reference Hollowell, van Assendelft and Gunter 28 ). Approximately 8 % of the cohort was anaemic, and of these, 4·9 % had anaemia with inflammation and 3·3 % had anaemia without inflammation. There were sixteen participants who were anaemic with evidence of nutrient deficiency (fifteen with Fe deficiency and one with low serum vitamin B12). Those with serum 25(OH)D concentrations < 50 nmol/l had lower Hb (P= 0·008), haematocrit (P= 0·03), serum Fe concentrations (P< 0·001), and higher CRP (P< 0·001) and IL-6 concentrations (P< 0·001) compared to those with serum 25(OH)D ≥ 50 nmol/l. Furthermore, there was a higher prevalence of anaemia overall (P= 0·001) and, specifically, anaemia with inflammation among those with serum 25(OH)D concentrations < 50 nmol/l (P< 0·001). Compared to whites, blacks in our cohort had lower serum 25(OH)D concentrations (P< 0·001), lower Hb concentrations (P< 0·001), haematocrit (P< 0·001) and serum Fe concentrations (P< 0·001), and higher CRP (P< 0·001) and IL-6 concentrations (P< 0·001) (see online Supplementary Table S2). Blacks also had a higher prevalence of vitamin D deficiency (P< 0·001) and anaemia (P< 0·001).
Table 2 Iron status and inflammatory markers of Emory/Georgia Tech Predictive Health Institute cohort (2008–2013), by serum 25-hydroxyvitamin D (25(OH)D) status (Mean values and standard deviations; median values and interquartile ranges (IQR); number of subjects and percentages)

CRP, C-reactive protein; IFN-γ, interferon-γ.
* Two sample Student's t tests for normally distributed continuous variables, Wilcoxon–Mann–Whitney test for non-normally distributed continuous variables, χ2 or Fisher's exact test for categorical variables.
† Median and IQR given for non-normally distributed variables.
‡ CRP: n 116 and n 521 for 25(OH)D < 50 nmol/l and 25(OH)D ≥ 50 nmol/l, respectively; IL-6: n 114 and n 509 for 25(OH)D < 50 nmol/l and 25(OH)D ≥ 50 nmol/l, respectively; IL-8: n 114 and n 510 for 25(OH)D < 50 nmol/l and 25(OH)D ≥ 50 nmol/l, respectively; TNF-α: n 114 and n 510 for 25(OH)D < 50 nmol/l and 25(OH)D ≥ 50 nmol/l, respectively; IFN-γ: n 114 and n 510 for 25(OH)D < 50 nmol/l and 25(OH)D ≥ 50 nmol/l, respectively.
§ Anaemia with inflammation defined as anaemia with serum CRP>3 mg/l or upper quartile of IL-6 ( ≥ 1·76 pg/ml); anaemia without inflammation defined as anaemia with CRP ≤ 3 mg/l or quartiles 1–3 of IL-6 ( < 1·76 pg/ml).
Associations of vitamin D status with markers of iron status
In simple linear regression analysis, serum 25(OH)D was positively associated with Hb concentrations (β = 0·05 (se 0·02), P= 0·004); however, adjustment for age, sex, race, BMI, CRP and IL-6 attenuated the significance (P= 0·23). Serum 25(OH)D was positively associated with serum Fe concentrations (β = 0·04 (se 0·01), P< 0·001; Fig. 1), and the association remained significant after adjusting for age, sex, race, BMI, CRP and IL-6 (β = 0·02 (se 0·01), P= 0·006).

Fig. 1 Correlation between vitamin D status (serum 25-hydroxyvitamin D (25(OH)D)) and total circulating Fe concentrations in participants of the Emory/Georgia Tech Predictive Health Institute cohort (2008–2013), n 638. Total serum Fe was positively correlated with serum 25(OH)D concentration (Pearson's r 0·2, P< 0·001), and this association remained statistically significant after adjusting for age, sex, race, BMI, C-reactive protein and IL-6 (β = 0·02 (se 0·01), P= 0·006).
Association of vitamin D status with anaemia
Serum 25(OH)D as a continuous variable was significantly associated with decreased odds of anaemia (OR 0·98, 95 % CI 0·97, 0·99). Odds of anaemia were increased when participants were dichotomised by various serum 25(OH)D cut-off points for vitamin D insufficiency/deficiency: < 75 nmol/l (OR 2·15, 95 % CI 1·18, 3·92), < 50 nmol/l (OR 2·64, 95 % CI 1·43, 4·86) and < 30 nmol/l (OR 4·97, 95 % CI 1·84, 13·41). These associations remained significant after adjustment for season (OR25(OH)D < 75 nmol/l 2·10, 95 % CI 1·15, 3·85; OR25(OH)D < 50 nmol/l 2·54, 95 % CI 1·37, 4·72; OR25(OH)D < 30 nmol/l 5·02, 95 % CI 1·82, 13·85). Additional variables associated with anaemia in bivariate analysis included inflammatory markers CRP, IL-6 and IL-8; black race; female sex; BMI; history of diabetes; and lower annual income, age and Fe supplement intake (see online Supplementary Table S3). TNF-α and interferon-γ, waist circumference, physical activity, smoking status, history of hypertension, education, multivitamin use and vitamin D supplementation were not significantly associated with anaemia.
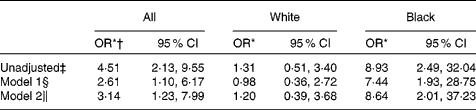
There was a significant interaction between race and vitamin D status (P= 0·003), such that the association between vitamin D status and anaemia remained significant only among blacks (Table 3). After adjustment for significant anaemia covariates from the bivariate analyses (age, sex, BMI, CRP, IL-6, IL-8, use of Fe supplements, income and diabetes) the odds of anaemia were six times higher for blacks with serum 25(OH)D < 50 nmol/l compared to blacks with serum 25(OH)D ≥ 50 nmol/l (OR 6·42, 95 % CI 1·88, 21·99) (Table 3).
Table 3 Association of serum 25-hydroxyvitamin D (25(OH)D)<50 nmol/l and anaemia, stratified by race (Odds ratios and 95 % confidence intervals)

* OR comparing 25(OH)D < 50 nmol/l v. 25(OH)D ≥ 50 nmol/l.
† Race not included as covariate due to evidence of interaction (P= 0·003).
‡ Crude association between 25(OH)D < 50 nmol/l and anaemia, n 602.
§ Adjusted for age, sex and BMI, n 599.
∥ Model 1+adjustment for C-reactive protein, IL-6 and IL-8, n 586.
¶ Model 2+adjustment for use of Fe supplements, income and history of diabetes, n 465.
The magnitude of effect in blacks increased when vitamin D status was defined by 25(OH)D < 30 nmol/l and 25(OH)D ≥ 30 nmol/l (fully adjusted OR 17·3, 95 % CI 2·27, 132·0). There was no significant association between anaemia and vitamin D status defined by 25(OH)D < 75 nmol/l and ≥ 75 nmol/l after adjustment for the same covariates.
Association of vitamin D status with sub-types of anaemia
The crude association between serum 25(OH)D < 50 nmol/l and anaemia with inflammation was statistically significant (OR 4·51, 95 % CI 2·13, 9·55). However, there was significant effect modification by race (P= 0·03), such that in stratified analyses, controlling for age, sex, BMI, use of Fe supplements, income and history of diabetes, blacks with serum 25(OH)D concentrations < 50 nmol/l had eight times higher odds of having anaemia with inflammation compared to blacks with serum 25(OH)D ≥ 50 nmol/l (OR 8·64, 95 % CI 2·01, 37·23) (Table 4). The association between vitamin D status and anaemia with inflammation was not statistically significant in whites. When we excluded those with evidence of nutrient deficiency from the anaemia with inflammation outcome, the crude association between vitamin D status and anaemia with inflammation remained statistically significant (OR 4·29, 95 % CI 1·80, 10·23); however, the limited sample size with this sub-analysis precluded adjustment for the aforementioned anaemia covariates. The crude association between vitamin D status and anaemia without inflammation was not statistically significant (OR 0·74, 95 % CI 0·22, 2·57).
Table 4 Association of serum 25-hydroxyvitamin D (25(OH)D)<50 nmol/l and anaemia with inflammation, stratified by race (Odds ratios and 95 % confidence intervals)
* OR comparing 25(OH)D < 50 nmol/l v. 25(OH)D ≥ 50 nmol/l.
† Race not included as covariate due to evidence of interaction (P= 0·03).
‡ Crude association between 25(OH)D < 50 nmol/l and anaemia, n 602.
§ Adjusted for age, sex and BMI, n 599.
∥ Model 1+adjustment for use of Fe supplements, income and history of diabetes, n 474.
Discussion
The present study reports an association between vitamin D status and anaemia in a generally healthy, working adult population. There were several notable findings: (1) a significant positive association between serum 25(OH)D concentrations and serum Fe; (2) 25(OH)D < 50 nmol/l was associated with increased odds of anaemia in blacks, but not in whites; and (3) the association between vitamin D status and anaemia among blacks was especially prominent in anaemia with inflammation, consistent with our hypothesis that vitamin D would be associated particularly with anaemia with inflammation.
The results presented are supported by other epidemiologic studies that have demonstrated inverse associations between vitamin D status and odds of anaemia in patients with chronic kidney disease and heart failure( Reference Zittermann, Jungvogel and Prokop 11 , Reference Krause, Neitz and Mägert 12 ). The present analysis adds to the literature by suggesting that the association may pertain particularly to anaemia with inflammation. However, there have been few trials examining the impact of vitamin D supplementation on anaemia. Lin et al. ( Reference Lin, Hung and Yang 29 ) showed in patients undergoing haemodialysis, treatment with the active form of vitamin D, calcitriol, was effective in improving anaemia of chronic kidney disease. In a study of patients with myelodysplastic syndromes, Mellibovsky et al. ( Reference Mellibovsky, Díez and Pérez-Vila 30 ) demonstrated that treatment with calcitriol resulted in increases in haematologic markers including Hb. Further investigation is needed to better understand the therapeutic effects of vitamin D supplementation on anaemia, especially in generally healthy persons.
The findings presented are consistent with the hypothesised mechanisms underlying the vitamin D–anaemia relationship. Anaemia resulting from chronic inflammation is characterised by disturbances in Fe regulation such that Fe becomes sequestered in cells of the reticuloendothelial system as a result of the action of pro-inflammatory markers, such as IL-6, on hepcidin, the global regulator of Fe metabolism( Reference Nemeth, Rivera and Gabayan 14 , Reference Weiss and Goodnough 15 ). Hepcidin acts on ferroportin, the Fe exporter on the surface of enterocytes, macrophages and hepatocytes, resulting in its internalisation and degradation, preventing Fe efflux from the cell( Reference Nemeth, Tuttle and Powelson 31 ). This leads to a decrease in Fe available in circulation for erythropoiesis and heme synthesis (despite adequate Fe stores and total body Fe), ultimately leading to anaemia( Reference Weiss and Goodnough 15 , Reference Roy and Andrew 16 ). Vitamin D is thought to temper the effect of inflammation-induced anaemia by decreasing the secretion of pro-inflammatory cytokines. Our group recently demonstrated through a series of in vitro studies that vitamin D can decrease the release of cytokines IL-6 and IL-1β from macrophages, and down-regulate hepcidin and up-regulate ferroportin expression in human monocytes( Reference Zughaier, Alvarez and Sloan 17 ). These findings are consistent with those of Bacchetta et al. ( Reference Bacchetta, Zaritsky and Sea 18 ) showing that treatment of hepatocytes and monocytes with vitamin D resulted in decreased expression of hepcidin mRNA. In support of this putative mechanism for the role of vitamin D in Fe metabolism, our findings showed that serum 25(OH)D concentrations were positively associated with serum Fe concentrations, suggesting that increases in vitamin D status may lead to increases in circulating Fe available for use in erythropoiesis and heme synthesis. Furthermore, in our cohort, vitamin D deficiency was associated with anaemia with inflammation but not with anaemia without inflammation, supporting a potential role for vitamin D in Fe recycling in the context of inflammation.
In our cohort, the association between vitamin D status and odds of anaemia was significant only among blacks. The odds of anaemia were approximately six times higher for blacks with serum 25(OH)D < 50 nmol/l compared to blacks with serum 25(OH)D ≥ 50 nmol/l, although the CIs about the estimate were relatively wide. The magnitude of effect was even greater for blacks with serum 25(OH)D < 30 nmol/l compared to those with 25(OH)D ≥ 30 nmol/l (OR 17·3, 95 % CI 2·27, 132·0), although the estimate remained imprecise. A potential explanation for the racial differences in the association between vitamin D status and anaemia is the racial difference in circulating inflammatory markers. Increased IL-6 expression in African Americans compared to Caucasians has been demonstrated in human umbilical vein endothelial cells( Reference Feairheller, Park and Sturgeon 32 ). Further, a systematic review of thirty-two population-based studies found higher CRP concentrations in non-whites compared to whites( Reference Nazmi and Victora 33 ). Similarly, in our population, IL-6 and CRP were significantly increased in blacks than in whites. Moreover, the magnitude of effect for the association of serum 25(OH)D < 50 nmol/l with odds of anaemia with inflammation increased above that of anaemia overall. Thus, higher inflammation in blacks may be augmenting the association between vitamin D status and anaemia in this racial group than in whites.
There are currently no race-specific cut-offs for anaemia. However, it is known that blacks have a higher prevalence of vitamin D deficiency and lower Hb concentrations compared to whites( Reference Ganji, Zhang and Tangpricha 1 , Reference Patel, Longo and Ershler 19 , Reference Zakai, McClure and Prineas 20 ). The clinical significance of this is not well understood. Vitamin D deficiency may provide one potential explanation for the differences observed in Hb concentration and anaemia prevalence between blacks and whites.
Strengths of the present study were a large sample size and a well-characterised cohort. However, this was a cross-sectional analysis, leaving us unable to conclude causality in the vitamin D–anaemia associations observed, and reverse causality bias cannot be excluded. We were also unable to measure hepcidin concentrations and, therefore, could not directly examine the putative mechanism underlying the vitamin D and anaemia association observed. Health status and socioeconomic variables were collected via self-administered questionnaires; thus, recall error may be a limiting factor. Our population was self-selected from individuals invited to participate in the Emory/Georgia Tech Predictive Health Institute. In addition, the majority of participants reported high income and high education level and are therefore not representative of the general population. However, one may expect such a population to have regular access to health resources; thus the persistence of the vitamin D–anaemia association is noteworthy. Additional prospective studies exploring the relationship between vitamin D status and anaemia, including those in low-income populations, are warranted.
In conclusion, the results presented suggest that lower vitamin D status is associated with anaemia, particularly anaemia with inflammation, among blacks in a generally healthy and high socioeconomic cohort residing in Atlanta, GA. Given the duel burden of vitamin D deficiency and anaemia prevalence among blacks, our findings have important public health implications. Clinical trials in racially diverse populations are necessary to elucidate the therapeutic effect of vitamin D supplementation on anaemia.
Supplementary material
To view supplementary material for this article, please visit http://dx.doi.org/10.1017/S0007114515000999
Acknowledgements
Information upon which this work is based is from the Emory/Georgia Tech Predictive Health Participant Database, and is supported by the National Center for Advancing Translational Sciences of the National Institutes of Health (UL1 TR000454). Other sources of support for the present study include grants from the National Institutes of Health (E. M. S., grant no. T32 DK007734), (V. T., grant no. K23 AR054334), (J. A. A., grant nos. T32 DK007298 and K01 DK102851), (T. R. Z., grant no. K24 DK096574) and the Emory-Egleston Children's Research Center (S. M. Z.). The content is solely the responsibility of the authors and does not necessarily represent the official views of the National Institutes of Health. The funders had no role in the design, analysis or writing of this article.
The author's contribution were as follows: E. M. S., J. A. A., and V. T. formulated the research question; G. S. M. and T. R. Z. had leading roles in the cohort study design, implementation and data collection; E. M. S., J. A. A., and V. T. analysed data; E. M. S., J. A. A., G. S. M., S. M. Z., T. R. Z., and V. T. wrote the article; E. M. S. and V. T. had primary responsibility for final content. All authors read and approved the final manuscript.
None of the authors has any conflicts of interest.


