


The Institute of Medicine and prominent experts in obesity prevention identify the school environment as a key target for efforts to promote healthy weight-related behaviours in children and adolescents( Reference Glickman, Parker and Sim 1 , Reference Story, Nanney and Schwartz 2 ). Schools are uniquely positioned to play a role in health promotion as US young people aged 5–17 years spend up to half their waking hours at school for nine months of each year( Reference Glickman, Parker and Sim 1 ). The promotion of healthy eating and physical activity can be integrated into the school day through the provision of nutritious food, opportunities to learn healthy eating skills and opportunities to get regular physical activity. A growing body of evaluation research demonstrates that the development of school-based policies may be effective in ensuring students are provided with these supports. Research in some locations has linked school-based policies to improvements in student behaviours such as decreased consumption of sugar-sweetened beverages and improvements in school environments such as lower availability of sugar-sweetened beverages and energy-dense snack foods; higher availability of fresh produce, low-fat and whole-grain foods; and more days or minutes of physical education per week( Reference Chriqui 3 – Reference Nanney, MacLehose and Kubik 8 ). However, several factors may hinder the effectiveness of school-based policies as evidenced by other research documenting variability in the strength and comprehensiveness of school-based policies and challenges to implementation( Reference Budd, Schwarz and Yount 9 – Reference Polacsek, O’Rourke and O’Brien 14 ).
Consistent with this growing evidence, the Healthy, Hunger-Free Kids Act of 2010 included language strengthening the requirement previously established by the Child Nutrition and WIC Reauthorization Act of 2004 for US school districts participating in the National School Lunch Program or other child nutrition programmes to adopt and implement a wellness policy( 15 , 16 ). The 2010 legislation specifically strengthened requirements for the inclusion of nutrition promotion goals; involvement of a diverse team of community stakeholders in implementing, periodically reviewing and updating wellness policies; and designation of a local education agency or school officials to ensure each school complies with the local school wellness policy. School health professionals and community-based nutrition educators will have important roles in helping schools adhere to the strengthened requirements and evaluate the effectiveness of updated policies. In providing such support, it will be particularly important to understand how the language of local school wellness policies may influence the likelihood of complete implementation.
Few studies have as yet comprehensively examined how the strength of local school wellness policy language is associated with school-level practices and published studies have produced mixed results( Reference Schwartz, Henderson and Falbe 17 – Reference Snelling and Kennard 24 ). Some districts may draft strong wellness policies but encounter challenges to implementation at the school level, while others may be more cautious in committing to goals in writing and still have schools that implement numerous changes to support students in practising healthy behaviours. There is a need for further research to clarify the association, especially for the implementation of practices in secondary schools where foods and beverages sold outside the school meal programme are often more readily available( Reference Finkelstein, Hill and Whitaker 25 ). The current study was designed to help fill this research gap using state-wide data on public middle schools and junior/senior high schools in Minnesota, USA. The purpose was to compare the strength of district wellness policies with corresponding school-level practices reported by principals and teachers in 2012. To provide a comprehensive picture of school wellness environments, we separately examined policies and practices in regard to nutrition standards for foods and beverages, nutrition education and wellness promotion, and physical activity promotion.
Methods
Data and sample
The present study was conducted as part of the School Obesity-related Policy Evaluation (ScOPE) study, which aims to evaluate food and activity policy and practice environments in Minnesota secondary schools and examine relationships with the behaviours and weight status of students( Reference Nanney, Nelson and Kubik 26 ). The ScOPE study has been approved by the University of Minnesota’s Institutional Review Board. District-level policy data were collected from school district websites along with any supplementary documentation describing procedures or regulations and, if not available online, by requests made to district administrators in the autumn of 2013. Wellness policies were obtained from 95 % of the 343 public school districts in Minnesota and scored by the authors using the established online Wellness School Assessment Tool (WellSAT) as described below( Reference Brissette, Wales and O’Connell 27 , Reference Schwartz, Lund and Grow 28 ). School-level data for the analysis to be described here were drawn from three primary existing data sets: (i) Minnesota School Health Profiles principal survey; (ii) Minnesota School Health Profiles teacher survey; and (iii) National Center for Educational Statistics (NCES) Common Core Data( 29 , 30 ). The School Health Profiles is a survey of school health policies and practices sponsored by the Centers for Disease Control and Prevention. In Minnesota, mailed principal questionnaires (n 297) and teacher questionnaires (n 280) were collected from a stratified random sample of public schools in 2012( Reference Demissie, Brener and McManus 31 ). The NCES Common Core Data is the Department of Education’s primary database on public schools in the USA and is updated annually( 29 ).
Measures
Wellness policy strength
The 326 district wellness policies collected for the present study were scored by the authors using the WellSAT with consideration given to any complementary information available in documents describing procedures or regulations (inter-rater reliability к=0·94). The WellSAT evaluates wellness policies in terms of both comprehensiveness and strength, and provides scores for the overall policy as well as for five content area domains (nutrition education and wellness promotion, standards for US Department of Agriculture Child Nutrition Programs and school meals, nutrition standards for competitive and other foods and beverages, physical education and physical activity, and evaluation). Comprehensiveness scores reflect the extent to which recommended content is covered in the policy and strength scores reflect how strongly the content is stated. Overall and domain-specific scores for comprehensiveness and strength are assigned out of a possible 100 points. The current analysis focused on the strength of policy items relating to nutrition standards for competitive and other foods and beverages (three items), nutrition education and wellness promotion (five items), and physical education and physical activity (two items). The majority of policy items were assigned a score of 0 (not mentioned), 1 (weak statement) or 2 (meets/exceeds expectations) using the guidelines published by WellSAT developers( Reference Schwartz, Lund and Greves 32 ). Policy items addressing the regulation of vending machines and school stores were the exception and were combined for analysis to better allow for comparability with the measures of school-level practices drawn from the School Health Profiles principal survey (0=neither vending machines or school stores were mentioned, 1=a weak statement applied to vending machines and/or school stores and neither was regulated by a strong statement, 2=a strong statement applied to vending machines and/or school stores but neither was banned, 3=a statement banned vending machines and/or school stores). The policy items included in the current study are shown in Table 1 along with the distribution of scores. WellSAT strength scores for individual policy items were dichotomized for analyses (0–1 v. 2–3) due to the distribution of scores in the sample.
Table 1 District wellness policy items and corresponding school-level practices

* Wellness School Assessment Tool policy item strength score of 0–1.
† Wellness School Assessment Tool policy item strength score of 2–3.
Template policy
District wellness policies were additionally compared with the template policy developed by the Minnesota School Boards Association (MSBA) and the Minnesota Association of School Administrators (MASA) given that schools may encounter more challenges to the implementation of wellness policies not tailored to the unique local environment of a district. Further, prior research has shown differences in the strength of language included in template-based v. locally developed policies( Reference Smith, Capogrossi and Estabrooks 33 ). To be categorized as a template policy, a district wellness policy had to meet the conditions of including the same introductory language to the policy and following the same general format and organization as the MSBA/MASA template. For the ten policy items examined as part of the current analysis, the MSBA/MASA template policy contained no statement in regard to six policy items and only a weak or general statement (based on WellSAT scores) addressing the other four items (nutrition education teaches skills that are behaviour-focused, specifies how districts will engage families, regulates vending machines, and regulates school stores). However, several districts made changes to the template policy (additions, omissions and/or modifications to the language). If a district wellness policy was based on the MSBA/MASA template, the number of changes made to the template was determined.
Availability of competitive foods
Principals were asked several questions relating to the availability of competitive foods. The presence of competitive foods was assessed (yes/no) by asking if students could purchase snack foods or beverages from one or more vending machines at the school or at a school store, canteen or snack bar. If at least one vending machine or a school store was present, principals were additionally asked if students could purchase the following snack foods or beverages: (i) chocolate candy; (ii) other kinds of candy; (iii) salty snacks not low in fat; (iv) cookies, crackers, cakes, pastries or other baked goods not low in fat; (v) ice cream or frozen yoghurt not low in fat; (vi) water ices or frozen slushes not containing juice; (vii) soda pop or fruit drinks that are not 100 % juice; and (viii) sports drinks. Yes/no responses were summed to form a score (range: 0–8; Cronbach’s α=0·75).
Access to drinking-water
Two items on the principal survey were used to assess student access to drinking-water throughout the school day. Principals indicated if students were permitted to have a drinking-water bottle with them during the school day in all locations, only in certain locations or in no locations. Responses were dichotomized for analysis based on the distribution to represent whether students were allowed to have a water bottle in all locations v. some or no locations. In addition, principals were asked (yes/no) whether or not their school offered a free source of drinking-water in the cafeteria during meal times.
Healthy eating curriculum
To assess the breadth of healthy eating skills addressed in the health education curriculum, teachers were asked if students in any of grades 6–12 in their school were taught the following topics as part of a required course: (i) using food labels; (ii) balancing food intake and physical activity; (iii) eating more fruits, vegetables and whole-grain products; (iv) choosing foods that are low in fat, saturated fat and cholesterol; (v) using sugars in moderation; (vi) using salt and sodium in moderation; (vii) eating more calcium-rich foods; and (viii) preparing healthy meals and snacks. Yes/no responses were summed to form a score (range: 0–8; Cronbach’s α=0·91).
Environmental strategies to promote healthy foods and beverages
To assess the promotion of healthy food and beverage selection, principals were asked if: (i) nutritious foods and beverages were priced at a lower cost while increasing the price of less nutritious options; (ii) fruits and vegetables were placed near the cafeteria cashier, where they are easy to access; (iii) fruits and vegetables were displayed attractively in the cafeteria; and (iv) healthful foods were labelled with appealing names (e.g. crunchy carrots). Yes/no responses were summed to form a score (range: 0–4; Cronbach’s α=0·57).
Banned advertising of unhealthy foods and beverages
To assess whether school policies existed to limit student exposure to promotions for energy-dense, nutrient-poor foods and beverages, principals were asked if their school prohibited advertising for candy, fast-food restaurants or soft drinks: (i) in the school building; (ii) on school grounds including on the outside of the school building, on playing fields or other areas of the campus; (iii) on school buses or other vehicles used to transport students; and (iv) in school publications (e.g. newsletters). Yes/no responses were summed to form a score (range: 0–4; Cronbach’s α=0·87).
School health council representation and activities
Principals were asked several questions relating to guidance provided by a school health council to improve the school environment. The presence of a school health council was assessed (yes/no) by asking if one or more than one group at their school offered guidance on the development of policies or coordinated activities on health topics. If a school health council was present, principals were additionally asked about representation on the school health council from each of seventeen different groups (e.g. nutrition or food-service staff, parents or families of students) and five types of activities performed by the school health council during the past year (e.g. recommended health and safety policies and activities). Responses for all representation and activity items were yes/no and these items were summed to form an overall school health council score (range: 0–22; Cronbach’s α=0·80).
Efforts to engage families in the promotion of healthy eating
To assess whether families were engaged in the promotion of healthy eating, principals were asked if their school: (i) collected suggestions on nutritious food preferences and strategies to promote healthy eating; and (ii) provided information on the nutrition and caloric content of foods available. In addition, teachers were asked if their school had provided parents and families with health information designed to increase knowledge of nutrition and healthy eating. Responses for all items were yes/no.
Opportunities to participate in intramural and interscholastic sports
Principals were asked to separately indicate if their school offered intramural (i.e. programmes in which students are given equal opportunity to participate regardless of physical ability) and interscholastic sports to students. Yes/no responses were combined to create a dichotomous indicator of whether a school offered both types of opportunities to students v. only one or neither option.
Community use of physical activity facilities
To assess community use of school facilities, principals were asked (yes/no) if their school, either directly or through the school district, had a joint use agreement for shared use of school or community physical activity facilities.
District and school demographics
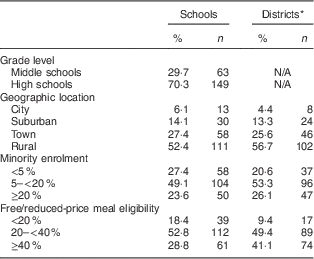
District and school-level demographics were obtained from the 2012 NCES Common Core Data( 29 ) and included geographic location, minority enrolment and free/reduced-price school meal eligibility. School geographic location was assigned based on district-level data as city, suburban, town or rural( 29 , 34 ). Ethnic/racial minority enrolment was defined by the percentage of students within a district or school representing a background other than non-Hispanic white and categorized as <5 %, 5 to <20 % or ≥20 %. Free/reduced-price school meal eligibility was similarly defined by the percentage of students within a district or school who were eligible and categorized for analysis as <20 %, 20 to <40 % or ≥40 %. School grade level (middle school v. junior/senior high school) was also determined based on 2012 data from the Minnesota Department of Education. Middle schools were defined as any school that enrolled students in grade 6 or higher and did not enrol students beyond grade 9. Junior/senior high schools were defined as any school that enrolled students in grade 10 or higher and did not enrol students before grade 6.
Statistical analysis
Analyses were performed using the statistical software package SAS version 9·3 (2011) or Stata version 12·1 (2012). The sample of schools participating in the School Health Profiles was limited for the current analysis to those representing secondary schools (excluding schools that enrolled primary grades and alternative schools) and to those with available data from both the principal and teacher surveys and WellSAT. School and district-level demographics for the analytic sample of 212 schools and corresponding 180 school districts are shown in Table 2. Descriptive statistics (means and standard deviations for WellSAT scores) were examined to characterize district wellness policies. Generalized estimating equations (GEE) with an independent correlation structure, which accounted for the nesting of up to two schools within some districts (n 32), were used to examine associations between the strength of district wellness policies and corresponding school-level practices as identified in Table 1. All GEE models accounted for school-level demographics, including school grade level, geographic location, minority enrolment and free/reduced-price meal eligibility. Models of dichotomous school-level measures used a binomial distribution and logit link, and all other models used a normal distribution and identity link. Additional models were run to test for the presence of interactions between school-level demographics and district policy. As no significant interactions were identified, models stratified on school characteristics were not examined. To further allow for describing different types of discordance between district wellness policy strength and school-level practices, schools were assigned to one of four groups: (i) weak policies were more completely implemented; (ii) strong policies were not or poorly implemented; (iii) strong policies were more completely implemented; and (iv) weak policies were not or poorly implemented. The χ 2 test was examined to assess whether school-level demographic characteristics were associated with assignment to one of the two discordant groups (i or ii). For these analyses, the implementation of school practices that were measured by a score was assessed based on the distribution of scores in the sample; a score at or above the median was used to define more complete implementation of a practice. A 95 % confidence level was used to interpret the statistical significance of all probability tests, corresponding to P<0·05.
Table 2 Demographic characteristics of schools participating in the 2012 Minnesota School Health Profiles principal and teacher surveys (n 212) and the corresponding school districts (n 180)
N/A, not applicable.
* One school was surveyed in 148 districts; thirty-two districts were represented by a middle school and 116 districts were represented by a high school. Two schools were surveyed in each of thirty-two districts with thirty-one districts represented by one middle school and one high school, and one district represented by two high schools.
Results
Description of school district wellness policies
The overall mean WellSAT comprehensiveness score for district wellness policies included in the analysis was 63·1 (sd 13·2) and the overall mean strength score was 28·4 (sd 29·3). Total mean scores for the three domains examined in the current analysis were also calculated: nutrition standards for competitive and other foods and beverages comprehensiveness=54·7 (sd 21·3), strength=12·3 (sd 18·0); nutrition education and wellness promotion comprehensiveness=63·2 (sd 16·3), strength=24·7 (sd 20·9); and physical education and physical activity comprehensiveness=65·7 (sd 12·3), strength=29·3 (sd 13·7). Nearly 80 % of school districts in the analytic sample had a wellness policy based on the MSBA/MASA template policy. Approximately half of the school districts using the template made three or fewer changes to the template language and three-quarters of the districts had made sixteen or fewer changes; however, the remaining 25 % of districts made up to fifty-one changes. Districts with template policies were demographically similar to the overall sample; no significant differences in regard to geographic location, minority enrolment and free/reduced-price meal eligibility were identified.
Nutrition standards for competitive and other foods and beverages
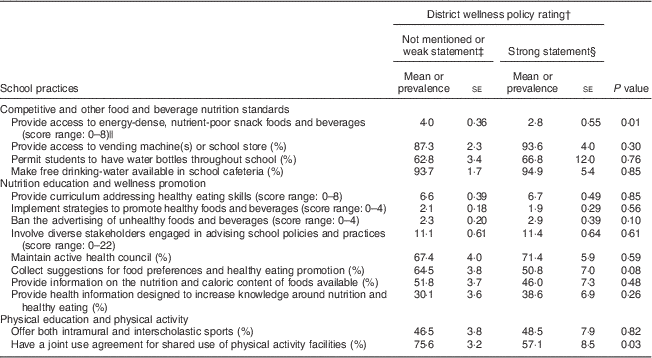
Associations were examined between three district wellness policy items of relevance to nutrition standards for the foods and beverages made available at school and four corresponding measures of school-level policies and practices (Table 3). School-level availability of energy-dense, nutrient-poor snack foods and beverages was inversely related to the strength of district wellness policy items regulating vending machines and school stores (P=0·01). The mean number of energy-dense, nutrient-poor snack foods and beverages available for students to purchase at school was 4·0 among districts having no or only weak policy statements and 2·8 among districts having a ban on competitive food sales or strong policy statement regulating the nutritional quality of food and beverage items sold in vending machines and/or school stores. No associations were found between the strength of district policies and other school-level practices, including the presence of one or more vending machine or school store; permission for students to have water bottles in locations throughout the school; and availability of free drinking-water in the cafeteria.
Table 3 Strength of school district policies and practices of Minnesota schools in 2012Footnote *
* Models were adjusted for school grade level, geographic location, minority enrolment and free/reduced-price meal eligibility.
† Policy content corresponding to the school policy or practice evaluated (see Table 1).
‡ Wellness School Assessment Tool policy item strength score of 0–1.
§ Wellness School Assessment Tool policy item strength score of 2–3.
|| Number of accessible snack food or beverage items.
Nutrition education and wellness promotion
Associations were also examined between five district wellness policy items of relevance to nutrition education or wellness promotion and eight corresponding measures of school-level practices (Table 3). No associations were found between the strength of district policies and school practices, including the breadth of healthy eating skills addressed in the health education curriculum; collection of suggestions from family members regarding nutritious food preferences and strategies to promote healthy eating; provision of nutrition content information for the foods available in school to families; provision of health information to parents and families; promotion of healthy food and beverage choices in the cafeteria; existence of policies to limit student exposure to promotions for energy-dense, nutrient-poor foods and beverages; presence of a school health council; and diversity of health council stakeholder roles and activities. Despite the absence of statistical significance, observed patterns were in the expected direction for five of the eight associations examined. For example, the mean number of locations where a school prohibited advertising for candy, fast-food restaurants or soft drinks was 2·3 among districts having no or only a weak policy statement and 2·9 among districts having a strong policy statement restricting the marketing of unhealthful food and beverage choices.
Physical education and physical activity
Finally, associations were examined between two district wellness policy items of relevance to physical education and physical activity and two corresponding measures of school-level practices (Table 3). The proportion of schools offering both intramural and interscholastic sports to students was unrelated to the strength of district policies addressing structured physical activity before or after school through clubs, classes, intramurals or interscholastic activities. Although the proportion of schools having a joint use agreement was significantly related to the strength of district policies addressing community use of school physical activity facilities (P=0·03), the relationship was not in the expected direction. More than three-quarters of schools had joint use agreements within districts having no or a weak policy statement whereas only 57·1 % of schools had joint use agreements within districts having a strong policy statement that encouraged schools to allow community use of school facilities.
Discordant policies and practices
Given the overall low concordance observed between school district wellness policies and school-level practices, additional analysis was conducted to describe whether it was more common for schools to: (i) poorly implement strong district-level policies; or (ii) implement practices supportive of healthy behaviours more completely in the absence of strong district-level policies. The results showed that for thirteen of the fourteen school-level practices examined, discordance resulting from more complete implementation of practices that support healthy behaviours in the absence of strong district-level policies (data not shown) was more common than failure to fully implement strong district-level policies. For example, 23 %of schools provided health information designed to increase knowledge around nutrition and healthy eating to families despite the absence of a strong district policy specifying how to engage families to meet district wellness goals. Conversely, 14 % of schools had strong district policies around engaging families but did provide them with health information. The only school-level practice for which discordance more often resulted from limited implementation of a strong district policy was providing access to one or more vending machine or school store; 10 % of schools had a weak district policy and did not provide access to either source of competitive foods while 16 % of schools had a strong district policy and provided access to one or more competitive food sources.
The nature of discordance between district-level policy and school-level practice was not consistently associated with the demographic characteristics of schools in the sample. No statistically significant associations with school grade level, geographic location, minority enrolment or free/reduced-price meal eligibility were found in examining discordance patterns for most school-level practices and the only two school-level practices for which demographic characteristics were linked to discordance patterns showed different associations. More specifically, collecting suggestions on nutritious food preferences and strategies to promote healthy eating despite the absence of a strong policy addressing family engagement was more likely to occur in high schools than in middle schools (P=0·008) and was less likely to occur in city schools than rural or suburban schools (P=0·01). Additionally, having a joint use agreement for shared use of physical activity facilities despite the absence of a strong district policy addressing community use of school facilities was more likely to occur in schools with high minority enrolment (P=0·02).
Discussion
The present study describes the concordance between school district wellness policies and school-level practices using state-wide data on public middle schools and junior/senior high schools in Minnesota. School district policies and fourteen school-level practices were examined with a focus on nutrition standards for competitive and other foods and beverages, nutrition education and wellness promotion, and physical education and physical activity. The results showed that the strength of district wellness policies regulating vending machines and school stores was inversely related to the mean number of energy-dense, nutrient-poor snack foods and beverages available for students to purchase at school. However, in contrast to expectations, the strength of district policies addressing community use of school facilities was inversely related to the proportion of schools having a joint use agreement for shared use of physical activity facilities. No other associations were found between the strength of other district policies and corresponding school-level practices. Discordance between district policy and school-level practices more often occurred as the result of schools implementing practices supportive of healthy behaviours in the presence of weak district policies than schools failing to implement strong district policies; however, the overall findings suggest the need for periodic assessment of school-level compliance with the implementation of district wellness policies. Thus, the findings support the importance of new proposed requirements that were developed by the US Department of Agriculture for districts to periodically assess school-level compliance with district wellness policies( 35 ).
The findings presented here complement the small number of previous studies that have examined how the strength of district school wellness policy language is associated with school-level practices( Reference Schwartz, Henderson and Falbe 17 – Reference Snelling and Kennard 24 ). Particularly few studies have addressed the implementation of district wellness policies in secondary-school environments and most focused only on nutrition standards for foods and beverages. Of four studies that assessed student exposure to competitive food and beverage offerings in secondary schools, two found the strength of district nutrition standards was related to reduced student exposure to energy-dense, nutrient-poor competitive foods/beverages; one found the strength of state but not district policies to be related to student exposure in a nationally representative sample of middle schools; and one study found no association among a large, multistate sample of twenty-three districts( Reference Wall, Litchfield and Carriquiry 18 – Reference Kubik, Wall and Shen 20 , Reference Snelling and Kennard 24 ). One other study comprehensively assessed nutrition education, school food practices, physical education and physical activity, communication and promotion, and coordinated school health among elementary, middle and high schools( Reference Schwartz, Henderson and Falbe 17 ). The results of that comprehensive study showed districts with stronger, more comprehensive policies to be more successful in implementing them at the school level; however, high schools were less likely than elementary schools to have fully implemented policies and middle schools were less likely to report any degree of implementation/development based on a combined overall measure of corresponding health-promoting practices( Reference Schwartz, Henderson and Falbe 17 ). Results of the current study extend previous research in demonstrating how concordance between district-level policy and school-level practices may vary according to the health-promoting practice of interest at the secondary-school level.
The results of the current study further showed that a large proportion of Minnesota school districts had template-based wellness policies and the findings in regard to concordance between district policies and school-level practices should be interpreted accordingly. Some schools may encounter challenges to the implementation of district policy language not tailored to the unique local environment while others with more resources in place may go beyond the requirements of the policy to provide an environment supportive of healthy behaviours. The overall weak language found in the MSBA/MASA template policy for the ten policy items examined here is in line with prior research that has found locally developed policies are in general stronger than template-based policies( Reference Smith, Capogrossi and Estabrooks 33 ). The current study built on this previous work in determining the number of changes districts made to the template policy in adopting the language for their own local wellness policy. While approximately half of the school districts using the template made three or fewer changes to the template language, the wide distribution ranging from zero to fifty-one changes suggested the impact of using a template-based policy on school-level implementation may also vary greatly among districts.
Strengths of the present study include the unique design and use of state-wide data to capture both district-level policies and secondary-school-level practices around nutrition and physical activity promotion. District wellness policies were obtained from nearly all public school districts in Minnesota and scored using the established WellSAT( Reference Brissette, Wales and O’Connell 27 , Reference Schwartz, Lund and Grow 28 ). The diverse sample of districts for which data were also available at the school level did not differ demographically from other districts in the state in terms of ethnic/racial minority enrolment or the proportion of students eligible for free/reduced-price school meals. Despite the diverse nature of the sample, caution should be used in making generalizations as districts with data available at the school level were less likely to represent rural areas and because the data were collected in just one Midwest state. The findings of the current study may, for example, have been influenced by state legislation in Minnesota regarding the liability of schools for injuries and other losses resulting from the use of school property made available for public recreational activity. The Minnesota state legislature only recently passed a law made effective in May 2011 that provides schools with immunity from such liability and it is possible our counterintuitive findings regarding the strength of district joint use policies resulted from a lagged response to its passage( 36 ).
Additional limitations of the data relating to the timing of collection, set of policies and practices compared, and potential for bias in reporting should also be considered in interpreting the results. As data on school practices were assessed in the spring of 2012 it is possible that some districts modified their wellness policies prior to collection in the autumn of 2013. However, an analysis of change in the strength of district wellness policies over an approximately one-year period in a sub-sample of districts (n 139) with policy data available for both years found no significant changes were made by the districts for the policy items examined here. Due to superseding state legislation( 37 ) it was not possible to assess concordance between district wellness policies and school-level physical education practices, and only fourteen school-level measures corresponding to a limited set of WellSAT policy items were identified for comparisons. Finally, school-level data were also subject to bias as practices were reported by school principals, designees or teachers.
Implications for research and practice
In conclusion, the findings of the current study along with other research strongly support the importance of periodically assessing school-level compliance with the implementation of district wellness policies( Reference Wall, Litchfield and Carriquiry 18 – Reference Kubik, Wall and Shen 20 , Reference Snelling and Kennard 24 ). Federal, state and district-level policies addressing school nutrition and physical activity environments have the potential to ensure diverse students are provided with supports for healthy behaviour( Reference Chriqui 3 – Reference Slater, Nicholson and Chriqui 7 ); however, several factors may present challenges to implementation( Reference Budd, Schwarz and Yount 9 , Reference Agron, Berends and Ellis 10 , Reference Robertson-Wilson, Dargavel and Bryden 12 – Reference Polacsek, O’Rourke and O’Brien 14 ). Nutrition educators and other health professionals who work with middle schools and junior/senior high schools in their community should evaluate school nutrition and physical activity practices, regardless of district wellness policy strength, in determining the need for intervention to better promote healthy student behaviours. Research building on the current study will be imperative to confirm the results among school districts in other geographic regions and to additionally account for discordance between policies and school-level practices in examining the impact of federal, state and district-level policies on student behaviours. Further, there is a need to add to the limited existing research regarding the possible influence of template-based district policy development on the implementation of health-promoting practices in schools.
Acknowledgements
Financial support: This work was supported by the National Institute of Child Health and Human Development (Principal Investigator: M.S.N.; grant number 5R01HD070738). Additional support for statistical analysis was also provided by the National Center for Advancing Translational Sciences (grant number UL1TR000114) of the National Institutes of Health. The content is solely the responsibility of the authors and does not necessarily represent the official views of the National Institute of Child Health and Human Development; the National Center for Advancing Translational Sciences; or the National Institutes of Health. Conflict of interest: None. Authorship: N.L. formulated the research question and drafted the manuscript. C.D. conducted the statistical analysis. P.H. collected and scored the district wellness policies. M.K. and M.S.N. conceptualized the larger School Obesity-related Policy Evaluation (ScOPE) study. All authors contributed to the interpretation of results and manuscript revisions. All authors have reviewed and approved the content of the submission. Ethics of human subject participation: The ScOPE study was approved by the University of Minnesota’s Institutional Review Board.


