


It is well known and documented that a balanced healthy diet plays an important role in the physical and cognitive development of children and adolescents, in maintaining a healthy weight and in reducing the risk of chronic diseases in the future( Reference Waxman 1 ). Furthermore, healthy nutrition may have a positive impact on performance at school( Reference Bellisle 2 , Reference Taras 3 ).
The increasing prevalence of unhealthy diet and childhood obesity has resulted in a significant policy response from many governments followed by the implementation of school-based initiatives, including standards for school meals. Experts agree that having access to healthy foods while being at school can enable children to develop healthy eating habits and reduce childhood obesity( 4 ). One common strategy to improve children’s eating habits is to reduce or remove unhealthy foods from schools( Reference Vecchiarelli, Takayanagi and Neumann 5 ). A universal food and nutrition policy for the European Union cannot be formulated due to the wide variation in school systems, eating habits and cultural differences in Europe( 6 ). The most appropriate approaches applicable to a diverse school system and health priorities were taken by different countries( 7 ).
However, Slovenian children’s and adolescents’ dietary patterns do not differ so much from those of their counterparts in other developed countries within the European Union and wider( Reference Currie, Zanotti and Morgan 8 ). Data indicate that Slovenian adolescents very often choose unhealthy foods, have irregular meals, skip breakfast, consume less fruit, shy away from vegetables and readily consume sugar-sweetened beverages( Reference Kobe, Štimec and Hlastan Ribič 9 – Reference Artnik, Drev and Drglin 11 ). Consequently, the meals of Slovenian children and adolescents are often high in added sugars, SFA and Na. At the same time, they tend to be low in PUFA, dietary fibre, folic acid, Ca and vitamin D( Reference Fidler Mis, Kobe and Štimec 12 ). This drawback leads Slovene nutritional experts to highlight the need to improve children’s and adolescents’ dietary habits. Well-planned and organized healthy school meals are recognized as the most efficient and rational method of intervention to improve children’s and adolescents’ dietary intake( 13 ).
Major differences exist in the provision of school meals throughout European school systems. While some countries organize school meals for all students, in others this responsibility lies with the school( 13 ). Many school meal programmes have shown improvement of the immediate nutritional intake of the children( Reference Condon, Crepinsek and Fox 14 – Reference Afridi 17 ) and benefits in cognition, academic achievement and lower school absence( Reference Alaimo, Olsžon and Frongillo 18 ). Further, meals provided at school constitute an important part of the children’s and adolescents’ diet and affect dietary habits in adults. Therefore, interventions that target healthy nutrition are needed to occur early in childhood and adolescence in order to prevent or reverse the adverse health effects of overweight and poor eating habits( Reference St-Onge, Keller and Heymsfield 19 ).
Slovenia has a long tradition of providing school meals. All Slovene schools are mandatorily involved in a well-organized and well-supported national School Meals Program, regulated by the School Meals Act( 20 ). School meals provide from 20 % up to 70 % of daily energy requirements, depending on the number of daily meals offered. According to the Act every school is obliged to organize at least one meal (mid-morning snack) for all students on an individual school day. But in practice, all primary schools offer at least one mid-morning snack and lunch to all students and the majority of them also offer breakfast and an afternoon snack for younger students. In Slovenia students enter primary school at the age of 6 years and finish it at the age of 14 years. Furthermore, mid-morning snack funding for students from low-income families is completely subsidized; and the same is true for additional school meals if the family of the student has an income below levels defined by law( 20 ).
The National Dietary Guidelines for Healthy Nutrition in Kindergartens and Schools( Reference Gabrijelčič Blenkuš, Pograjc and Gregorič 21 ) (hereafter ‘NDG’) were adopted as part of a comprehensive Slovene Food and Nutrition Policy( Reference Maučec Zakotnik, Hlastan Ribič and Poličnik 22 ) in 2005 and became obligatory by the renovated School Meals Act in 2010, amended in 2013( 20 ). Since then, schools are obliged to adapt their organization of school meals to meet these guidelines. How successfully these guidelines were introduced into routine practice can be best identified by comprehensive evaluation, such as for instance using the WHO framework with potential indicators and mechanisms for monitoring and evaluation of nutrition policies embedded in the 2006 WHO Global Strategy on Diet, Physical Activity and Health( 7 ), or different other monitoring systems to evaluate school nutrition policies( Reference Story, Kaphingst and Robinson-O’Brien 23 – Reference Cauwenberghe, Maes and Spittaels 25 ).
Providing school meals that meet guidelines is very complex; therefore, it was our intention to evaluate implementation of the NDG of the School Meals Act from a holistic perspective. With this aim we employed different monitoring systems that enabled us to evaluate the implementation process and resulting outputs( Reference Nutbeam and Bauman 26 ). The purpose of the current paper is to present the evaluation approach used to assess the implementation of the NDG in Slovene primary schools during the period when these guidelines became obligatory under the Act of 2010( 20 ).
Research design and methods
The implementation of the NDG for healthy nutrition took place in the period 2005–2010. Due to the recognized importance of school nutrition by policy decision makers, the NDG were endorsed as a substantial part of the School Meals Act( 20 ) in 2010. The evaluation approach of this implementation was developed gradually during the same time period and a systematic evaluation was carried out at three different levels in the years 2010 and 2011. Taking into account the recommendations of the WHO Global Strategy on Diet, Physical Activity and Health for nutrition policy evaluation( 7 ), three different approaches have been developed: (i) a survey among school food-service managers for process evaluation (level 1); (ii) an indicator-based evaluation of menu quality (level 2); and (iii) nutritional assessment of school meals (level 3) for output evaluation.
Primary schools were selected from the official register of all primary schools in Slovenia, held by the Ministry of Education, Science and Sport, which served as a sampling frame for all three levels (n 448). Schools were sampled separately for each level of evaluation. All Slovene primary schools offer mid-morning snack and lunch( Reference Gabrijelčič Blenkuš, Pograjc and Gregorič 21 ), therefore all the schools were included in the sampling procedure.
At the first level, a survey among school food-service managers was conducted from June to September 2010 with the aim to evaluate the process of implementation of the NDG. All Slovene primary schools (n448) were invited to complete the online survey. The response rate at the first level was 52·2 % (n 234).
At the second level, 194 randomly sampled primary schools were involved in indicator-based menu quality evaluation. The frequency of the indicative food items and food groups in school monthly menus was assessed and an appropriate tool was developed for this purpose. The menus from sampled schools were collected in May 2010 and September 2011. Menus with full details needed for evaluation of menu quality were provided by 177 (91·2 %) selected schools.
Recommended nutrient contents and energy values of 120 school lunches were analysed at the third level on a small sample of twenty-four primary schools, selected primarily for being close to the regional public health institutes due to the limited execution capacities. All selected schools allowed access to offered lunches. The nutritional quality of school lunches was assessed by measuring and analysing (calculating energy and nutrients) lunches that were offered directly to students aged 10–12 years during the period from September to December 2011. This age group was selected according to the Slovene primary-school curriculum which is organized in three triads; the middle triad, harmonized with the NDG age group of 10–12 years, was included.
The first- and second-level evaluation allowed disaggregation of the data by school location (urban and rural areas), cohesion region (eastern and western Slovenia), school size (schools divided into smaller, medium and larger, relative to the number of students) and municipality socio-economic status (schools divided into lower, medium and higher tertiles, relative to the income per capita in the school municipality). Details of the survey sample are presented in Table 1.
Table 1 Characteristics of the primary schools sampled in the present evaluation of NDG implementation, Slovenia, 2010–2011
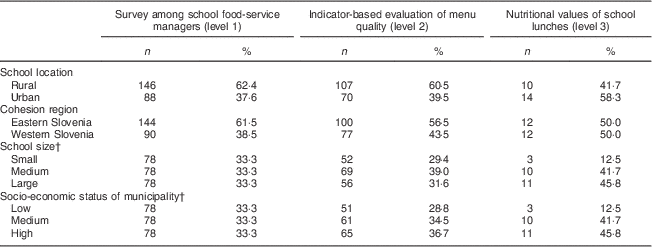
NDG, National Dietary Guidelines for Healthy Nutrition in Kindergartens and Schools( Reference Gabrijelčič Blenkuš, Pograjc and Gregorič 21 ).
† Tertile cut-offs were used to classify schools as we do not have clear definitions of school size and graduation of socio-economic status of municipalities in Slovenia. The distribution of schools into three groups for the first level of evaluation was also used for the second and third level of evaluation( Reference Buzeti, Djomba and Gabrijelčič Blenkuš 33 ).
Survey among school food-service managers
School food-service managers were invited to complete an online survey by a circular letter. We measured the degree of implementation of the NDG with a questionnaire using a Likert scale( Reference Norman 27 ) from 1 to 5, with 1 meaning ‘not implemented’ and 5 meaning ‘fully implemented’. Only answers 4 and 5 were considered to meet the criteria. The survey contained eleven evaluation questions regarding: (i) organization cultural( Reference Willcoxson and Millett 28 ) issues including organization of school meal-planning groups and school nutrition action groups, regular inclusion of foods from quality schemes, as well as regular use of the NDG manual( Reference Gabrijelčič Blenkuš, Pograjc and Gregorič 21 ), the related practical manual for preparing healthy meals( Reference Hlastan Ribič, Maučec Zakotnik and Koroušić Seljak 29 ) and the practical manual for food procurements with defined quality standards for foods( Reference Pograjc, Poličnik and Hlastan Ribič 30 ); and (ii) technical issues( Reference Gabrijelčič Blenkuš, Pograjc and Gregorič 21 , Reference Hlastan Ribič, Maučec Zakotnik and Koroušić Seljak 29 , Reference Pograjc, Poličnik and Hlastan Ribič 30 ) including provision of balanced mid-morning snacks, regular inclusion of foods from local production and organic production, provision of fruit and/or vegetables in each meal, and reduction of fruit and vegetable leftovers to less than 25 %.
Indicator-based evaluation of school menu quality and definition of the nutritional score scale
The system for evaluating menu quality was based upon the use of a food frequency checklist and food-based criteria of the inclusion of indicative foods in monthly menus. During the construction of this system( Reference Gregorič, Gabrijelčič Blenkuš and Klančar 31 ), data related to national epidemiological( Reference Rok Simon, Bajt and Brcar 32 , Reference Buzeti, Djomba and Gabrijelčič Blenkuš 33 ), food consumption( Reference Kobe, Štimec and Hlastan Ribič 9 , Reference Fidler Mis, Kobe and Štimec 12 ) and dietary habits( Reference Gregorič and Koch 10 , Reference Artnik, Drev and Drglin 11 , Reference Gabrijelčič Blenkuš 34 ) were considered. Following national research data and priorities as well as information obtained from other scientific research studies( Reference Kleiser, Mensink and Scheidt-Nave 35 – 40 ), the classification described below was prepared as presented in Table 2.
Table 2 Components and assessment of menu quality scores used in the present evaluation of NDG implementation, Slovenia, 2010–2011
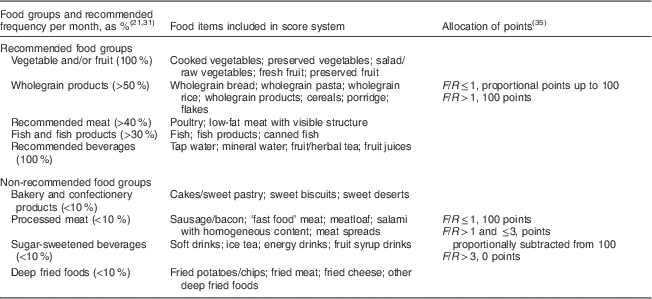
NDG, National Dietary Guidelines for Healthy Nutrition in Kindergartens and Schools( Reference Gabrijelčič Blenkuš, Pograjc and Gregorič 21 ); F/R, frequency (F)/recommended frequency (R) ratio for the food group.
Information regarding food frequency was recorded as the number of servings of selected food groups per month (where one month corresponds to twenty school days; for example, one serving per month=1, one serving per week=4 and one serving per day=20). The checklist covers thirty-seven indicative food items that were checked in mid-morning snacks as well as in lunches. Thus, thirty-seven food items were aggregated into nine selected food groups divided in two categories: recommended and non-recommended, as they are defined by the NDG( Reference Gabrijelčič Blenkuš, Pograjc and Gregorič 21 ). In the case of monitoring two offered menus at the same time, data related to frequency were expressed as an average of these two meals. Information regarding the frequency of indicative foods was compared with food-based criteria for healthy school meals( Reference Gabrijelčič Blenkuš, Pograjc and Gregorič 21 , Reference Gregorič, Gabrijelčič Blenkuš and Klančar 31 ), as seen in Table 2.
Because our scoring approach has not yet been validated, for the purpose of the present paper score calculations and allocation of points follow the concept developed by a group from the Robert Koch Institute (Berlin, Germany)( Reference Kleiser, Mensink and Scheidt-Nave 35 ) as described below. Every food group was related back to the recommendations by calculating the ratio for food group x:
 $$Ratio_{x} =\left( {{F \over R}} \right)_{x} ,$$
where F is frequency of food group x and R is recommended frequency for food group x.
Then, the ratio (F/R) x was allocated with points relating to the percentage of the recommended frequency for a single food group ((F/R) x →score x ). All results below/over the recommendations were assessed proportionally( Reference Kleiser, Mensink and Scheidt-Nave 35 ).
For recommended food groups, 100 points were given for each group if the menu reached or exceeded the recommended frequency. Points were proportionally subtracted from 100 if the menu did not reach the recommended frequency. If the frequency of non-recommended food groups was below or equal to a tolerable frequency, 100 points were given. If it exceeded the recommendation, points were proportionally subtracted from 100, since frequencies above the recommendation level for these foods are considered unfavourable. Finally, single points were added together and standardized in a scale from 0 to 100( Reference Kleiser, Mensink and Scheidt-Nave 35 ), as follows:
 $${\rm Menu\ quality\ score}=\left( {{{\mathop{\sum}{score_{x} } } \over {N_{{score_{x} }} }}} \right),$$
where
 $$N_{{score_{x} }} $$
is the number of score components/food groups included.
$$N_{{score_{x} }} $$
is the number of score components/food groups included.
Nutritional values of school lunches, estimated by weighed food records
School lunches offered to students in primary schools were evaluated for compliance with the NDG that included school meal recommendations for energy, macronutrients, dietary fibre, vitamins, and macro, micro and trace elements( Reference Gabrijelčič Blenkuš, Pograjc and Gregorič 21 ). Dietary recommendations for school meals were based on D-A-CH (D-German, A-Austrian, CH-Swiss) Reference Values for Nutrient Intake, which have been adopted and used as officially recognized values for Slovenia since 2004( 41 ) (Tables 5 and 6).
To estimate the nutritional values of school lunches, a 5 d weighed food record method was used( Reference Willett 42 – Reference Livingstone, Prentice and Strain 44 ). At each school three randomly selected lunches were monitored on the monitoring day. Lunches were taken away immediately after the pupil received them. After that lunches were weighted using professional scales (type Scale House NCS3K; Dini Argeo SRL, Spezzano di Fiorano, Italy) to the nearest 0·1 g. Each food item or dish was weighed with the container and a standard container mass was subtracted from the total mass. Disassembling of composite dishes was made before weighing where appropriate. The weight of pre-packaged food items was recorded as it was indicated on the package. For each lunch a recipe was obtained that contained information on the quantities of raw food items, preparation procedure and yields/retention factors( Reference Gregorič, Gabrijelčič Blenkuš and Ceglar 45 ). The process of monitoring school meals was performed by nutritional experts from regional public health institutes, using pre-prepared methodological instructions.
Average nutritional values of lunches for each school were calculated by the National Institute of Public Health, using the OPEN nutrition data software system (Jožef Stefan Institute, Ljubljana, Slovenia)( Reference Koroušić Seljak 46 ). The structure and use of OPEN software have been described in detail elsewhere( Reference Koroušić Seljak 46 , Reference Kasenburger 47 ).
Statistical analysis
Data obtained from the survey among school food-service managers and the indicator-based evaluation of menu quality were analysed across characteristics of school location, cohesion region, school size and socio-economic status. Data for the third evaluation level were not analysed across characteristics due to the small sample size.
Results were analysed statistically using the statistical software package IBM SPSS Statistics 17·0( 48 ). The χ 2 test was used to compare proportions between two or more categories and the ANOVA test was used to identify differences among group means. The school lunches were analysed using a one-sample t test to compare the means of energy and nutrient values of school meals against the national recommendations as the specified constant. The level of statistical significance was set to P<0·05.
Results
Survey among school food-service managers
The survey results indicated high levels of implementation regarding almost all evaluation areas of the NDG. In general, all schools reported regular use of the NDG manual at their daily work but were less successful in the case of organizing meal-planning groups and of including foods from organic production. Schools were slightly more successful in the implementation of the NDG in relation to organization cultural issues than in relation to the technical issues (Table 3).
Table 3 Characteristics of primary schools that met the criteria for implementation of the NDG in relation to various issues, Slovenia, 2010–2011
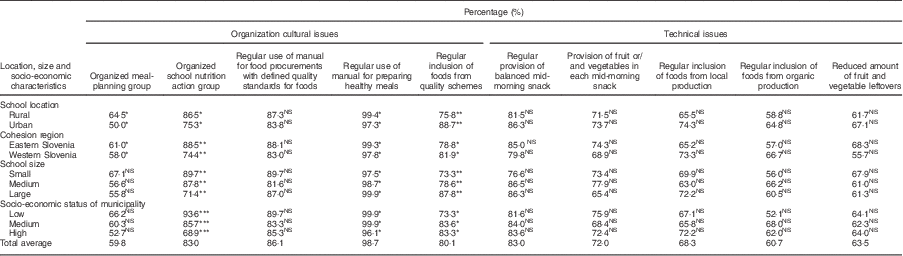
NDG, National Dietary Guidelines for Healthy Nutrition in Kindergartens and Schools( Reference Gabrijelčič Blenkuš, Pograjc and Gregorič 21 ).
Significance obtained by χ 2 test: *P<0·05; **P<0·01; ***P<0·001.
All evaluation areas were also examined across characteristics of location, cohesion region, school size and socio-economic status of the municipality, and the results are presented in Table 3. Smaller schools as well as rural schools, which are in general of smaller size, were more successful at implementing the NDG in relation to organizational matters and less successful at providing and including healthier foods. Furthermore, schools from municipalities with lower socio-economic status reported a more successful implementation of the NDG at organizational level.
Indicator-based evaluation of school menu quality
Values of nutritional scores for school menu quality followed a normal distribution. The overall average of the scores was 61·6 with a minimum of 36·4 and a maximum of 81·7 points. The interquartile range extended from 55·9 to 68·2. Table 4 shows the crude average values of scores by various location, size and socio-economic characteristics. A statistically significant higher (better) average score was detected in larger schools with a higher number of students and to some extent among schools belonging to municipalities with a higher socio-economic status.
Table 4 Menu quality scores in relation to various location, size and socio-economic characteristics of primary schools, Slovenia, 2010–2011
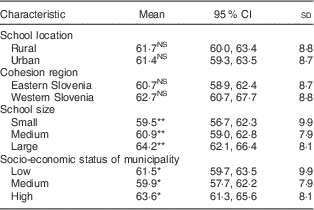
Significance obtained by ANOVA test: *P<0·05; **P<0·01; ***P<0·001.
Nutritional values of school lunches
School lunches on average contained adequate amounts of protein and did not significantly exceed the maximum recommended values for sugars, total fat and SFA. On the other hand, school lunches contained significantly less energy, carbohydrates and dietary fibre than minimum recommended values (Table 5) and consequently students covered on average only 25·2 % instead of 35–40 % of their daily energy requirements with school lunches( Reference Gabrijelčič Blenkuš, Pograjc and Gregorič 21 ).
Table 5 Recommended and mean daily values of energy, macronutrients and dietary fibre in lunch offered to students aged 10–12 years, Slovenia, 2010–2011

Significance obtained by t test: *P<0·05; **P<0·01; ***P<0·001.
† Based on less than 30 % of energy from fat.
According to the percentage of contained energy, school lunches provided students with an average of 18·0 % of energy from protein, 31·4 % from total fat (7·6 % from SFA) and 50·6 % from carbohydrates (10·8 % from sugars).
In addition, school lunches were examined and compared with the dietary recommendations for vitamins, and macro, micro and trace elements. School lunches contained significantly less retinol, vitamin D, riboflavin, pantothenic acid, biotin and folic acid than the recommended levels. Values of vitamin B6 significantly exceeded the recommended levels (Table 6).
Table 6 Recommended and mean daily values of vitamins, macro, micro and trace elements in lunch offered to students aged 10–12 years, Slovenia, 2010–2011
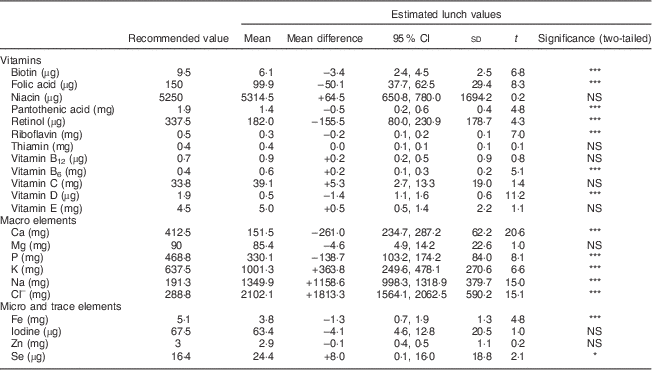
Significance obtained by t test: *P<0·05; **P<0·01; ***P<0·001.
Regarding macro, micro and trace elements, school lunches significantly exceed the recommended levels of Na, Cl–, K and Se. The levels of Ca, P and Fe were significantly lower than recommended amount (Table 6).
Discussion
Regulation of school meals in Slovenia is strongly supported with national legislation. With this regulation, the State enables students to make healthy nutritional choices, develop healthy nutritional habits( 20 ) and consequently reduces social inequalities and effectively responds to high employment levels of women in Slovenia( Reference Buzeti, Djomba and Gabrijelčič Blenkuš 33 ). The Slovene School Meals Program is focused on providing healthy meals, which should comply with the NDG( Reference Gabrijelčič Blenkuš, Pograjc and Gregorič 21 ) regarding the frequency of food groups included, as well as recommended energy and nutritional values. In addition, the NDG also provide a list of non-recommended foods for school meals. Undesirable foods can be included in school meals only in low frequency and low amounts. Defined by the law, the School Meals Program is – in addition to providing the availability of high-quality school meals – also aimed at learning healthy habits; raising awareness about sustainable consumption, optimal growth and cognitive development; and developing responsible attitudes towards health and the environment( 20 ).
Reviews of school nutrition interventions in other countries indicate that most of them are oriented either to healthy nutrition education( Reference Kostanjevec, Jerman and Koch 49 – Reference Powers, Struempler and Guarino 51 ) or other interventions such as school lunches, school canteens( Reference Cullen, Hartstein and Reynolds 52 , Reference Lien 53 ), vending machines( Reference Matthews, Nelson and Kaur 54 ), or specific practices such as school breakfast programmes( Reference Moore, Moore and Tapper 55 , Reference Shemilt, Harvey and Shepstone 56 ) and school gardens( Reference Ozer 57 ). Some interventions tend to focus only on specific foods, such as the School Fruit Scheme( Reference de Sa and Lock 58 – Reference Lesnik, Gabrijelčič Blenkuš and Gregorič 60 ), or specific dietary outcomes, such as decreased consumption of high-fat choices( Reference French, Story and Fulkerson 61 ) and sugar-sweetened beverages( Reference Blum, Davee and Beaudoin 62 ). However, only a state-wide nutrition policy that targets all foods and beverages and school environments may be effective; otherwise, compensation of dietary outcomes may occur( Reference Cullen, Watson and Zakeri 63 ).
The overview of the implementation of the NDG at different evaluation levels presented herein revealed that expected changes in organization and offer of school meals, resulting from interventions, are not equally effective in meeting these guidelines. As will be discussed below, the level 1 process evaluation showed very good results, but at the same time a more specific, in-depth evaluation of the quality of meals offered pinpointed important reservations and challenges for future implementation.
The overview showed evidence that some school characteristics such as size, location and socio-economic environment can play an important role in implementation procedures. We observed that the results of the survey among Slovene school food-service managers indicated high levels of implementation at almost all observed level 1 evaluation areas, which is in agreement with other studies that evaluated the process of the implementation of nutrition initiatives in schools( Reference Adamson, Spence and Reed 15 , Reference Dick, Lee and Bright 64 ). In Slovenia’s case, providing quality school meals is a high priority for all schools( Reference Gregorič, Gabrijelčič Blenkuš and Klančar 31 ). We can explain this with the fact that, characteristically for Slovenia, organized school meals are quite often cheaper than the food prepared at home( Reference Simčič 65 ) and also suit well the mostly employed Slovene mothers( Reference Buzeti, Djomba and Gabrijelčič Blenkuš 33 ). Furthermore, the School Meals Program is a part of nutrition education, as parts of formal and hidden curricula( 20 ). This means that healthy diet is supported with the curriculum topics, where children receive important information on healthy eating practices in home economics classes as part of the average curriculum( Reference Buzeti, Djomba and Gabrijelčič Blenkuš 33 ).
Greater focus and implementation support was found to be required in the areas of operationalization of meal-planning groups; reduction of fruit and vegetable leftovers; and regular inclusion of foods from organic and local production. This might be explained by problems surrounding public procurement of foods and food prices( Reference Gregorič, Gabrijelčič Blenkuš and Klančar 31 ) about which schools often have reported. Low quantities of locally produced or organic foods and complicated legislation on public procurement can be an inhibiting factor. In addition, a lack of involvement on behalf of students, school management, parents and public health representatives in school nutrition groups, as well as a lack of knowledge, organizational skills or awareness, are all elements which might be attributed to the traditional organizational culture at an individual school with important potential for improvement. More successful implementation of the NDG in rural schools, as related to organizational matters, might be attributed to more personal relationships in smaller schools. But on the contrary, these schools had more difficulties to provide and include healthier foods, which are more often more expensive for them. Higher prices and limited availability of healthier foods in smaller, rural and more distant communities have been documented in other studies( Reference Chambers, Lobb and Butler 66 ). It is also not unusual that food-service managers at smaller schools perform other duties besides managing food service – such as teaching – and might therefore not be as dedicated as their colleagues in larger schools whose only job is the management of food service( Reference Simčič 65 ). Schools from the eastern part of Slovenia were more successful in implementing establishment of meal-planning groups. School nutrition action groups and the use of manuals for preparing healthy meals, which might be attributable to different cultural habits, influenced organizational culture at the school level, while schools from (in general) the wealthier western side of Slovenia( Reference Buzeti, Djomba and Gabrijelčič Blenkuš 33 ) were more successful at providing more quality foods. Schools from municipalities with a medium socio-economic status compared with those with lower and higher socio-economic status seemed to have fewer problems implementing the NDG in terms of inclusion of foods from high-quality schemes. These reported differences in implementation may be explained by various support levels available from different regional institutions and distinct financial capacities at the school level. All of the differences described above might to some extent be explained also by contrasting levels of interest and abilities among individuals responsible for implementing the NDG.
The indicator-based systems offer a valuable instrument to evaluate overall menu quality in schools. They can be used as a simple, low-cost indicative tool to detect schools with undesirable foods included in school meals. The results of the currently applied indicator-based evaluation menu score system( Reference Kleiser, Mensink and Scheidt-Nave 35 ) are consistent with the findings of the Slovene School Meals Program evaluation report from 2012( Reference Gregorič, Gabrijelčič Blenkuš and Ceglar 45 ), where weighted scores were used( Reference Gregorič, Gabrijelčič Blenkuš and Klančar 31 ). Both approaches revealed that schools with lower scoring results provided school menus that on average did not include enough recommended food groups – particularly fish and wholegrain products – and exceed maximum recommended frequency for sugar-sweetened bakery and confectionery products, as well as sugar-sweetened beverages.
Taking into consideration school size and the socio-economic status of a municipality, differences in score values were statistically significant: better menu quality was related to larger schools and higher socio-economic status of the municipality. Furthermore, insignificant differences among school location and cohesion region groups may be the result of a long tradition of reducing inequalities among regions through a variety of school-based programmes and interventions( Reference Buzeti, Djomba and Gabrijelčič Blenkuš 33 ). On the other hand, relatively important differences among score values were detected among individual schools where additional efforts for improvement are necessary. These differences in menu quality were also detected in the Slovene School Meals Program 2010 evaluation( Reference Gregorič, Gabrijelčič Blenkuš and Klančar 31 ).
Nutritional score systems, composed of relevant indicative indices, are designed to capture ‘healthy menus’ and to reflect compliance with the recommendations. Moreover, the construction of nutritional scores appears to be useful for several reasons( Reference Hu 67 ). The scoring system is used to summarize the abundance of information on individual food items into a single indicator for an overall impression of menu quality. Index approaches are subjective and limited by current knowledge, selection of components, assessment methods and available information( Reference Hu 67 ). A decision for using different weights in scorings is also subjective and a matter of further validation studies.
The relatively low energy content of the average school lunch might be explained by excessive levels of energy in subsidized school mid-morning snacks, which exceeded the recommended values( Reference Poklar Vatovec 68 ); leading to the fact that the joint energy intake of mid-morning snacks and lunches was close to the recommended one. Smaller portion sizes and lower energy density can affect the energy value of meals( Reference Kral and Rolls 69 ), which was recognized as a possible reason for the lower energy content of school lunches( Reference Gregorič, Gabrijelčič Blenkuš and Ceglar 45 ). School lunches did have low carbohydrate and fat contents, and consecutively lower energy values. Similarly, the relatively low nutritional quality of school lunches might reflect the frequent inclusion of low-nutrient-dense foods, the low inclusion of milk and milk products in menus, as well as the lack of vegetables in lunches( Reference Gregorič, Gabrijelčič Blenkuš and Ceglar 45 ). Low Ca and vitamin D intakes are well documented among children and adolescents( Reference Salamoun, Kizirian and Tannous 70 , Reference Serra-Majem 71 ). The inadequate quality of school lunches is perhaps surprising but not unusual, taking into consideration that children and adolescents are the population group most likely to have a higher risk of nutritional deficiencies( Reference Serra-Majem 71 ). Similar results were found in English schools, where the majority of children did not meet the recommendations for lunch nutrient intake, especially for micronutrients( Reference Gould, Russell and Barker 72 ). The very high levels of Na are of significant concern and likely reflect the frequent inclusion of processed foods (pre-treated foods, semi-finished products, instant soups and sauces, etc.)( Reference Gregorič, Gabrijelčič Blenkuš and Ceglar 45 ). The interpretation of the results could be related to the method used( Reference Lambert, Agostoni and Elmadfa 73 ). In our study we used food composition data to estimate the nutritional quality of lunches. Comparison of these data with analytical ones, which we did not have, would be more accurate and easier to explain. Methods of measuring food intake are not standardized across Europe( Reference Lambert, Agostoni and Elmadfa 73 ). However, it is evident that more nutritional education with a focus on menu design should be oriented towards food-service managers in the future( Reference Gregorič, Gabrijelčič Blenkuš and Ceglar 45 ).
As we have discussed above, only multilevel evaluation of programme implementation can give public health professionals a clear insight into the implementation results and provide tangible and useful results for policy makers and policy decisions for future implementation improvements. Such types of evaluation overview as the one presented here are essential to ensure well-informed public policy decisions( Reference Oxman, Bjorndal and Bacerra-Posada 74 ). The power of knowledge is one of the crucial political forces for moving health issues on to policy agendas in general( Reference Leppo, Ollila and Pena 75 ) and implementing them. Different approaches of transferring knowledge to policy and practice are under development( Reference van Kammen, de Savigny and Sewankambo 76 ) and public health nutrition areas should incorporate these new methodological developments, too.
The present overview provided evidence that use of multilevel evaluation approaches appears to be useful for several reasons. In general, the evaluation overview has demonstrated that nutrition interventions in schools are implemented differently at distinct levels.
The present study demonstrates that although schools believe that they are making positive changes to adolescents’ diets, in fact the School Meal Program is reaching the food-based dietary guidelines and nutrient recommendations only to some extent. The evaluation overview suggests that specific barriers at different levels require different measures to improve the implementation of the NDG. Specific important school-based dietary recommendations for school food-service managers include placing more emphasis on the importance of food-based criteria for the composition of healthy school meals. The Slovenian National Institute of Public Health intends to validate the indicator-based evaluation of menu quality with the aim to provide stronger evidence-based arguments for future implementation steps. However, all primary schools in Slovenia should use standardized recipes to ensure that their menus meet the specific standards of a healthy school diet. A clear set of rules and instructions regulating the work of school kitchen personnel should be adopted. In the institutionalized School Meal Program no substantial differences should appear in the quality of school meals among schools varying in size, location, cohesion region and socio-economic status of the municipality.
The guidelines alone do not result in the required changes in practice. The implementation of guidelines in complex systems such as school nutrition programmes might require different system changes, the evaluation at different levels and the use of alternative research designs. This should be considered not only by researchers, but also by school policy makers, who are interested in improving students’ nutritional intake, performance at school and consequently their future health.
Acknowledgements
Acknowledgements: The authors acknowledge and thank Franc Jesenek, Mojca Vivoda, Mateja Šturm, Rok Poličnik, Barbara Gregorič Gorenc, Branka Đukić, Anja Magajna, Lilijana Spasojevič, Cecilija Sušec, Gordana Toth, Irena Jerič, Brigita Zupančič Tisovec and Tea Kordiš for their assistance in checking menus and monitoring school lunches. Many thanks also go to Dr Katja Povhe Jemec and Rok Poličnik for their critical review of the study, and to Darja Lavtar for her methodological assistance. Last but not least, the authors are grateful to all participating schools. Financial support: This study was supported by the Ministry of Health of the Republic of Slovenia and the Ministry of Education, Science and Sport of the Republic of Slovenia. Neither Ministry had a role in the design, analysis or writing of this article. Conflict of interest: None. Authorship: M.G. contributed to the conception and design of the study, the acquisition of national survey, menu quality and weighed food record data, the analysis and interpretation of data, the drafting of the article and final approval of the version to be published. L.P. revised the article critically for important intellectual content and gave final approval of the version to be published. A.P. and M.S. contributed to the conception and design of the food consumption study, revised the article critically for important intellectual content and gave final approval of the version to be published. M.G.B. contributed to the conception and design of the evaluation study, the description of the methodology, the interpretation of data, revised the article critically for important intellectual content and gave final approval of the version to be published. Ethics of human subject participation: The study was conducted according to the guidelines laid down in the Declaration of Helsinki for all procedures involving human subjects.


