


The health problems associated with obesity across much of the industrialized world are ubiquitous( Reference Fakhouri, Ogden and Carroll 1 ) and in part attributed to poor food choices. In order to aid consumers’ decision-making process, the US Food and Drug Administration (FDA) has proposed to change the nutrition facts panel (NFP). As stated by Michael Landa, Director of the US FDA’s Center for Food Safety and Applied Nutrition, ‘Obesity, heart disease, and other chronic diseases are leading public health problems… The proposed new label is intended to bring attention to calories and serving sizes, which are important in addressing these problems’ (p. 1)( 2 ). The current investigation assesses the merits of this proposal by comparing judgements of nutrition of cereals using different NFP formats.
Background: changes to the nutrition facts panel
The NFP was developed by a team headed by the US FDA Commissioner, Dr Kessler, as mandated by Congress in the Nutritional Labeling and Education Act of 1990( 3 , Reference Kessler, Mande and Scarbrough 4 ). The aim of this law was to provide consumers with nutritional information that was accurate and easy to read so as to encourage healthier food choices. Self-reports of NFP usage show a positive trend; a recent study by the US Agriculture Department found that the percentage of adults who reported using the NFP ‘always or most of the time’ went from 34 % in 2007–08 to 42 % in 2009–10( Reference Todd 5 ). In spite of this, the health problems associated with poor food selections are still significant. The proposed changes to the NFP are the first major revisions since it was launched( Reference Kessler 6 ). The changes include, but are not limited to: making the serving size and calories more salient; removing calories from fat; moving the Percent Daily Value to the left of the label and the units of nutrients (e.g. grams) to the right; including added sugars; including amounts of potassium and vitamin D; and continuing to list total fat, saturated fat and trans fat( 7 ). Members of the public were able to comment on the proposal until 1 August 2014. Debates on the merits of the proposal range from industry concerns regarding implementation of the law( 8 ) to scientific concerns that the proposal does not go far enough in considering products’ overall nutritional value or in regulating nutrient content claims and ingredient lists( Reference Kessler 6 , Reference Sylvetsky and Dietz 9 ).
Judgement and choice accuracy
The psychological literature has demonstrated that food choices are affected by many extraneous factors, such as the size of the plate and the proximity of food( Reference Wansink 10 ). The literature has also revealed erroneous food beliefs, such as that high-caloric foods eaten in small amounts have fewer calories than low-caloric foods eaten in great quantities( Reference Rozin, Ashmore and Markwith 11 ). Consumers have difficulty interpreting absolute nutrient levels( Reference Burton, Biswas and Netemeyer 12 – Reference Viswanathan 14 ) and consumers’ judgements of food quality are often affected by package label claims. Andrews et al.( Reference Andrews, Netemeyer and Burton 15 ) found that the claim of ‘no cholesterol’ increased the positive evaluations of margarine, in terms of ‘healthiness’ and ‘fat content,’ but higher nutrition knowledge moderated the effect when fat content information was available. Other claims such as ‘organic’ and ‘fair trade’ may often exert a halo effect, in which a positive impression promotes subsequent positive evaluations of other dimensions that are not warranted. For example, consumers underestimated the calories in sandwiches from Subway®, which is viewed as the healthy alternative within fast-food options( Reference Chandon and Wansink 16 ). Similarly, ‘organic’ cookies were perceived as lower in calories( Reference Lee, Shimizu and Kniffin 17 ). Thus, judging nutrition quality is not an error-free process and accuracy may depend on various factors including the availability of nutritional information and individuals’ nutrition knowledge( Reference Andrews, Burton and Netemeyer 18 ). Concern for healthy eating was also found to influence the evaluation and purchasing intentions of healthier food products( Reference Kähkönen, Tuorila and Rita 19 , Reference Bower, Saadat and Whitten 20 ). On the other hand, a recent study showed that the green colour of front-of-package labels led to more positive nutrition judgements among participants with stronger healthy eating concerns, casting doubts on the benefits of such concerns( Reference Schuldt 21 ).
In the current study we focus on gaining understanding of nutrition judgements based on the NFP. The NFP provides valuable information, but the label is complex and consumers prefer simplified front-of-package labels( Reference Grunert and Wills 22 ). Behavioural research has further shown that individuals use simple heuristics to make food selections( Reference Scheibehenne, Miesler and Todd 23 ) and are thus unlikely to base their judgements on multifaceted descriptions. Indeed, only individuals with a high level of motivation and obesity knowledge, the ‘nutrition elite’, were found to have appropriate evaluations of nutrient claims that impacted consumption intentions( Reference Andrews, Netemeyer and Burton 24 ). Thus, if judgements and actions are the result of simple heuristics, then the proposed FDA changes to the NFP may prove ineffective because the panel remains quite complex. Recent findings with eye viewing methodology support the conclusion that individuals attend to very few pieces of information. That study further revealed no relationship between amount of time viewing nutritional information and the selection of more nutritious foods( Reference Nelson, Graham and Harnack 25 ).
On a positive note, the quality of the foods consumed by US adults has improved, in part due to an increased focus on the nutritional quality of the foods selected( Reference Todd 5 ); hence, changes to the NFP may be most timely. A goal of the present study is to assess nutritional information usage and judgement accuracy comparing the current NFP with two NFP formats designed following key FDA guidelines. An additional goal is to assess the nutrients that individuals rank as important v. the nutrients that they use when making their food quality judgements. These assessments do not always coincide( Reference Wigton 26 , Reference Adelman, Stewart and Hammond 27 ) but in conjunction they allow us to better understand the effects of the NFP formats.
In order to assess whether different NFP formats can meaningfully impact consumers’ behaviour, we use the Lens Model of Social Judgement Theory as a framework for studying judgement accuracy( Reference Stewart 28 , Reference Hammond 29 ). For example, a physician’s diagnosis is useful to decision making to the extent that it agrees with the actual presence (or absence) of the condition being judged. Similarly, individuals may make healthier food choices if they are able to judge the nutritional quality of food alternatives. A vast literature on linear models as applied to the study of judgement accuracy has demonstrated that individuals sometimes rely on information that is not relevant to what they are trying to assess. Other times they use relevant information but do not weight it appropriately( Reference Hardman and Hardman 30 ). Furthermore, experts do not always agree in their judgements. A study of nutrition experts in Europe revealed that judgements of 125 foods agreed with four nutrient profiling systems for easily classifiable foods (fruits and vegetables scored high, whereas sugary foods and fatty meats scored low)( Reference Azais-Braesco, Goffi and Labouze 31 ). However, a wide array of other foods produced less agreement. This raises the question about the ability of lay consumers to judge the nutrition quality of packaged foods.
The assessment of nutrition judgement accuracy within the Lens Model framework is carried out by comparing lay judgements with a gold standard. The model conceives the environment–person relationship as a system that has cues (proximal variables) centrally located and the decision maker uses these cues to make a judgement about a distal criterion (the gold standard). The cues relate statistically to both the criterion and to the judgements made by the individuals. To the extent that a judge uses information with high cue validity, judgements can be accurate. In the current application of the model, NuVal© was selected as the gold standard and the nutrients in the NFP serve as the cues for judgement. The judgements are the evaluations of cereals with regard to their nutritional quality.Footnote *
NuVal scores derive from a nutrition profile system developed by Katz et al. – independent from the food industry – that utilizes the Overall Nutritional Quality Index (ONQI) algorithm( Reference Katz, Njike and Faridi 32 ). The ONQI is a measure that weights positive and negative qualities of nutrients converting nutritional value into a single score that ranges from 1 to 100, with higher values indicating higher nutrition. NuVal was developed in an effort to inform American consumers of the quality of the foods they consume and has been adopted by a number of supermarket chains (e.g. Tops Friendly Markets, United Supermarkets LLC and Scolari’s Food and Drug Company)( 33 ). However, the system is not without critics because the specifics of the ONQI algorithm are under proprietary restrictions( Reference Reedy and Kirkpatrick 34 ). We adopted NuVal in spite of this issue because a large-scale study demonstrated its validity in predicting lower risk of chronic disease and mortality for individuals who consumed foods with greater NuVal( Reference Chiuve, Sampson and Willet 35 ).
In sum, using the Lens Model as a framework the current study evaluates the accuracy of consumers’ judgements of nutrition relative to a gold standard provided by nutrition science, NuVal. Furthermore, the study compares this accuracy as a function of three NFP formats and tests whether variations to the NFP impact decision making in the direction expected by the FDA. In contrast to the expectations of the FDA, if individuals use few pieces of information to make their judgements, as prior research indicates, then little difference between the NFP formats may result. The role of nutrition knowledge and concern for healthy eating are also addressed.
Methods
Participants
Two hundred and thirteen adult volunteers living in the USA were recruited through Amazon’s Mechanical Turk (www.MTurk.com).Footnote † Sample size was adequate for achieving a power of 80 % for all analyses (α=0·05). Eighty-five participants were needed to detect a correlation=0·3; 176 individuals were needed for independent group mean comparisons with effect size d=0·3; and a sample of 136 was needed to detect an interaction effect size f=0·3 on a repeated-measures ANOVA with three independent groups and three within-subjects measures. Observed power is also reported for specific analyses.
The sample reflected a wide range of health, weight and levels of socio-economic status. Participants were female (66·2 %), not currently dieting (71·4 %) and had a mean age of 37·31 (sd 12·56) years. Individuals were employed (58·2 %), not employed or on disability (18·8 %); individuals reported being students, homemakers, retired or other (23·0 %); individuals had at least a 4-year college degree (37·0 %). The majority of the sample had an annual income of less than $US 59 000 (77·0 %). While the sample was largely Caucasian (76·5 %), it also included African Americans (13·1 %), Hispanics (4·2 %) and Asians (5·2 %). Most individuals reported being free of any health concerns that affected their food choices (71·4 %) and the sample’s mean BMI was 27·15 (sd 6·93) kg/m2, which is considered overweight by the Centers for Disease Control and Prevention( 39 ).
Study materials
The study used breakfast cereals because cereal consumption is high in the USA, with retail sales expected to reach $US 10·3 billion in 2017( 40 ). Figure 1 presents an example of the stimuli, with two modified NFP for Kashi® 7 Whole Grains Honey Puffs. Note that only one type of NFP (and hence only one cereal box with NFP) was seen by a participant on the screen.
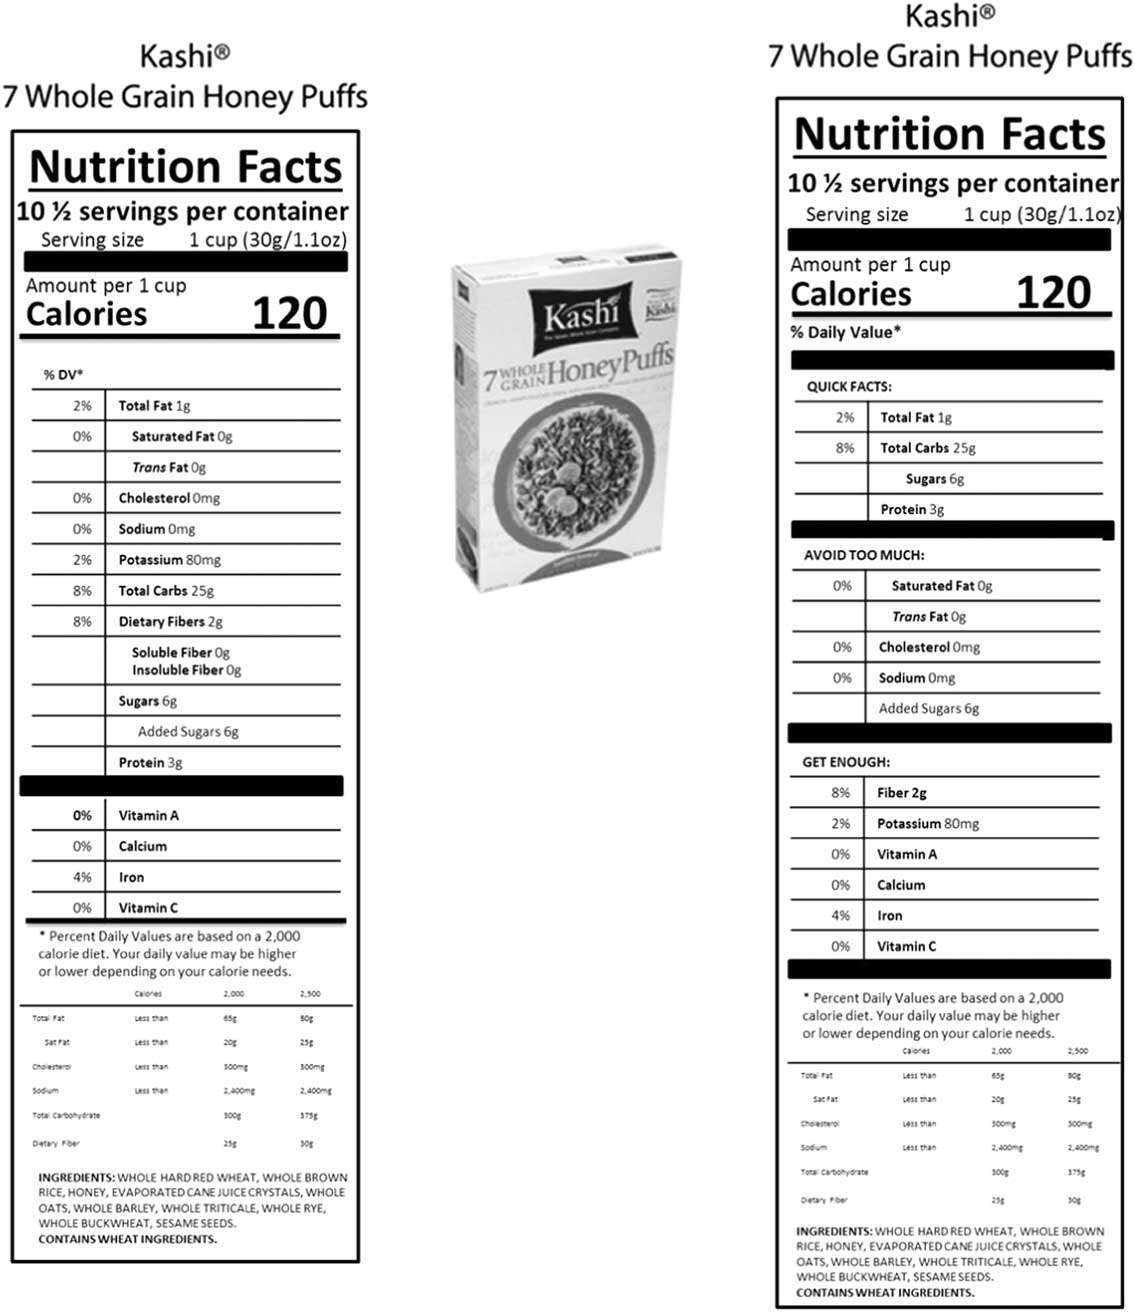
Fig. 1 Stimuli display. Cereal box with NFP-1 (left) and NFP-2 (right): calories and serving sizes enlarged; calories from fat removed; Percent Daily Value to the left; nutrient units to the right of nutrient amount; potassium included. NFP-2 has categories of ‘Avoid Too Much’ and ‘Get Enough’ nutrients. Cereal names also appeared on the top of each NFP image (not shown). Images appeared in colour in the study and are reduced here to fit the page (NFP, nutrition facts panel)
The two NFP versions in Fig. 1 were designed based on the FDA proposals( 7 ) also published by The Washington Times in January 2014( Reference Jalonick 41 ). We refer to them as NFP-1 and NFP-2 (current NFP is NFP-0). NFP-1 is closely related to the FDA proposal, while NFP-2 corresponds with the alternative format of the nutrition facts label( 7 ) which has nutrients grouped into bad (‘Avoid Too Much’) and good (‘Get Enough’) categories. This alternative NFP was tested because the categorization of nutrients should, in principle, make consumers more likely to avoid foods that contain higher quantities of the bad nutrients.
Table 1 presents the cereals in the present study with NuVal scores, nutrition values and mean judgements of nutrition in each NFP format. The cereals were selected from a set for which we were able to obtain NuVal scores from NuVal®, LLC. We strived to have cereals with a wide range of scores, but limited the total number to twenty so that participants could complete the survey with ease. The study was completed without problems as evidenced by a very low rate of blank responses, <1 %.
Table 1 Cereals ordered by NuVal with nutrient values and mean judgements of nutrition per NFP format
NFP, nutrition facts panel.
* Saturated fats found only in General Mills Cinnamon Toast Crunch (0·5 g); Kellogg’s Krave® Double Chocolate (1·5 g); Kellogg’s Special K® Low Fat Granola Touch of Honey (0·5 g); Nature’s Path Organic Qia (0·5 g) and Post Fruity Pebbles (0·24 g).
Measures
Demographics
Participants reported: dieting, employment, health, and disability status; educational level, income, age, gender, weight, height and ethnic group; and self-report measures of frequency of NFP usage (from 0 % of the time=‘never’ to 100 % of the time=‘always’). Participants also reported whether they used the NFP in the current study (yes/no).
Questions for each cereal
Judgement of nutrition quality was measured on a ‘1=not nutritious at all’ to ‘100=very nutritious’ scale in response to: ‘In your opinion, how nutritious is this cereal?’ The likelihood of consumption and purchasing intentions were measured on a seven-point scale from ‘1=very unlikely’ to ‘7=very likely’ in response to: ‘Assuming that you would eat cereal for breakfast or as a snack, how likely is it that you would consume this cereal?’ and ‘Assuming cost is not an issue and you are shopping for a cereal, how likely is it that you will purchase this cereal?’ Serving size was assessed with the question ‘How much of this cereal would you eat?’, with possible responses of: ‘I would not eat this cereal’, ‘¾ cup’, ‘1 cup’, ‘2 cups’ and ‘3 cups’, or participants could write their own amount.
Nutrition and obesity knowledge, and concern for healthy eating questionnaires
General nutrition knowledge( Reference Parmenter and Wardle 42 ) and obesity knowledge( Reference Swift, Glazebrook and Macdonald 43 ) were measured as total number of correct answers. The concern for healthy eating questionnaire( Reference Kähkönen, Tuorila and Rita 19 ) is a Likert-type scale, Cronbach’s α=0·84 in the current sample. Scale items are found in the Appendix. These scales have been found to have good psychometric properties by several researchers( Reference Kähkönen, Tuorila and Rita 19 , Reference Bower, Saadat and Whitten 20 , Reference Parmenter and Wardle 42 – Reference Wardle, Parmenter and Waller 45 ).
Ranking of nutrients
Fourteen nutrients common to all cereals were ranked in terms of importance in overall diet and importance when evaluating the cereals in the present study. A ranking of 1 is given to the most important nutrient and so forth. Partial rankings were accepted.
Hypotheses
Following the FDA’s rationale for the proposed changes to the current NFP, nutrition judgement accuracy is expected to be higher when using the new NFP formats. In particular, the categorization of nutrients into positive and negative in NFP-2 may nudge individuals into avoiding products high in undesirable nutrients (losses) and, to a lesser extent, approaching those high in positive nutrients, consistent with basic notions of prospect theory’s value function( Reference Tversky and Kahneman 46 ), namely that losses loom larger than gains. The greater impact of negative information, relative to positive, is well documented in many domains (see Baumeister et al.( Reference Baumeister, Bratslavsky and Finkenauer 47 ) for a review). However, because consumers may use simple heuristics in order to reduce the information load, the changes in the NFP format may not affect behaviour in the expected direction of the FDA proposal. To put it simply, if individuals focus on just a few pieces of information, label changes may be inconsequential. In terms of knowledge, past research has shown that more knowledgeable individuals encode and utilize information in a more piecemeal manner( Reference Brucks, Mitchell and Staelin 48 ) and can be more accurate( Reference Andrews, Burton and Netemeyer 18 , Reference Andrews, Netemeyer and Burton 24 ). Barreiro-Hurlé et al. also showed links between nutrition knowledge, usage of nutrition label and healthier food choices in Spanish consumers( Reference Barreiro-Hurlé, Gracia and de-Magistris 49 ), and Wardle et al. demonstrated that nutrition knowledge related to self-reports of consumption of foods with lower fat content, as well as greater consumption of fruits and vegetables, in an English sample( Reference Wardle, Parmenter and Waller 45 ). Thus, it is expected that individuals scoring higher in nutrition knowledge will have greater accuracy beyond the effect of the NFP format.
Past research with an English sample showed that individuals with higher concerns for health and nutrition had higher frequency of healthy eating habits( Reference Roininen, Lähteenmäki and Tuorila 50 ). Concern for health related to attitudes towards healthy eating in a sample of college students in Taiwan( Reference Sun 51 ), and health motives related to attitudes and consumption of ready-made meals by consumers in Belgium( Reference Geeroms, Verbeke and Van Kenhove 52 ). The current study expects a similar positive relationship between concern for healthy eating and accuracy of judgements in a US sample.
Procedures
Participants read instructions and signed consent forms online. They were randomly assigned to one of three NFP conditions. Within each NFP format, participants viewed twenty cereals, individually, randomly presented, each appearing with a colour picture of the front of the cereal box and the cereal’s NFP (see Fig. 1); the four cereal questions were placed right below the images. Participants then completed the demographic and other measures all presented in random order. The study lasted about 20 min.
Results
Manipulation checks
There were seventy participants (32·9 %) in NFP-0, seventy (32·9 %) in NFP-1 and seventy-three (34·3 %) in NFP-2 conditions. The percentage of individuals who reported using the given NFP in the present study was high (85·4 %), which was expected given the highly visible NFP information provided. Furthermore, the frequency with which individuals endorsed using the NFP did not depend on NFP format (χ 2 (2)=3·01, P=0·22). This means that within the controlled conditions afforded by the study, reported differences in other measures are not due to differential levels of usage of the NFP.
Effects of nutrition facts panel formats
As seen in Table 1, the mean nutrition judgements of each cereal computed across participants were fairly similar when comparing the three NFP formats (means across all cereals equal to 49·0, 47·3 and 50·3, for NFP-0, −1 and −2, respectively) and they relate to NuVal. Spearman’s ρ correlations found in Table 2 demonstrate that the current NFP yielded the highest agreement with NuVal (0·76). Additional correlations with nutrients are found in Table 2.
Table 2 Spearman ρ correlations of NuVal and nutrients of twenty cereals with mean ratings of nutrition in NFP-0, NFP-1 and NFP-2 formats
NFP, nutrition facts panel.
*P<0·05; **P<0·01.
As seen in Table 2, the mean judgements of nutrition correlated significantly (all P<0·05) and positively with calories, protein, fibre and potassium. Negative significant correlations were found with total sugars and sodium. Furthermore, results show that NuVal related to the nutrients in a similar pattern, with cereals high in protein, fibre and potassium, but low in total sugars and sodium, receiving higher scores. Calories significantly related to the participants’ judgements and surprisingly in a positive rather than a negative direction.
The observed advantage of NFP-0 over the other formats was assessed in repeated-measures ANOVA with cereal nutrition level as a within-subjects factor and NFP as the between-subjects factor on nutrition judgements. The cereal-nutrition-level variable was a categorization of cereals based on NuVal: low (NuVal average of 23·0), medium (NuVal average of 31·0) and high (NuVal average of 80·6). There was a NFP × cereal-nutrition-level interaction (F(2, 210)=4·2, P<0·05, Roy’s Largest Root=0·04, observed power=0·73) and a cereal-nutrition-level main effect (F(2, 209)=148·47, P<0·01, observed power=1). There was a significant linear contrast interaction for cereal nutrition level and NFP (F(2, 210)=3·18, P<0·05, observed power=0·6) showing that the mean ratings of nutrition increased linearly with NuVal, but the slope was steepest for the current NFP as shown in Fig. 2. That is, participants using the current NFP discriminated best between lower- and higher-quality cereals. All pair comparisons of the means between the lowest and highest NuVal categories were significant (all paired t tests (df=212)>5·65, P<0·01).
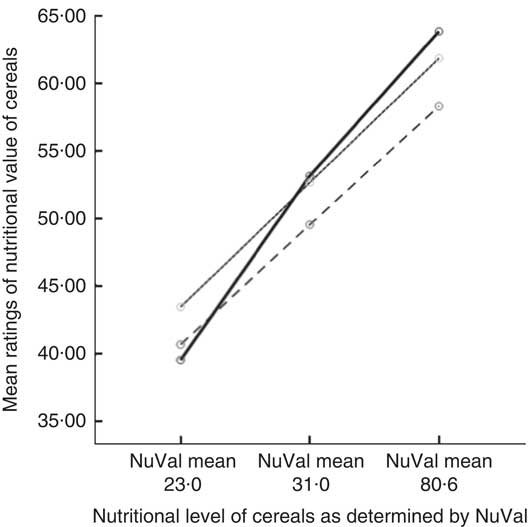
Fig. 2 Plot showing mean of nutrition ratings as a function of nutrition level for each NFP format (——, NFP-0; – – –, NFP-1; - - -, NFP-2). Nutrition ratings of cereals provided by US adults (n 213) in an online survey; nutrition level of cereals provided by NuVal as objectively defined nutrition score (NFP, nutrition facts panel)
The results for the likelihood of consuming the cereal showed that the mean difference between the high (mean=4·02) and low (mean=3·60) NuVal categories was significant for NFP-0 (paired t(212)=2·07, P<0·05). No other comparison reached significance. A similar result was obtained for the likelihood of buying the cereal, with a significant mean difference between the low (mean=3·50) and high (mean=3·98) NuVal categories for NFP-0 (paired t(212)=2·1, P<0·05). No differences were observed in the amount of cereal individuals would consume, with means clustered around 2 cups (minimum average was 1·97 cups for Nature’s Path EnviroKidz Organic Gorilla Munch and maximum average was 3·24 cups for Kellogg® Special K® Low Fat Granola).
Judgement accuracy: person-level analyses
An ordinal measure of agreement, Kendall τ correlation, was computed for each participant between the cereals’ NuVal and the participants’ judgements. This is an achievement index in Lens Model analysis( Reference Stewart 28 ) and measures the accuracy of judgements. In the current study, it captures the ordinal correspondence between the judgements and the NuVal criterion. With respect to consumption/purchasing judgements, the measure is an index of the likelihood of consuming/purchasing a healthier cereal.
The mean of the correlations between NuVal and the nutrition judgements was highest for NFP-0 (mean=0·34, 0·25 and 0·29 for NFP-0, NFP-1 and NFP-2, respectively). The 95 % confidence interval did not include the value of 0 only for the NFP-0 correlation.
Regression analysis predicting the nutrition judgement accuracy from NFP dummy coded (highest value for NFP-0 and lowest for NFP-1 and NFP-2) and other variables resulted in a significant regression model.Footnote * Results of this and the other judgements are found in Table 3.
Table 3 Prediction of nutrition judgement accuracy and the likelihood of consuming and purchasing healthier cereals

NFP, nutrition facts panel.
*P<0·05; **P<0·01.
Results show that older individuals with greater knowledge of obesity were more accurate in evaluating nutritional quality with NFP-0. Older individuals with greater nutrition knowledge, concern for healthy eating and higher frequency of NFP usage were more likely to consume healthier cereals with NFP-0. The pattern for purchasing intentions was slightly different as NFP format was not a significant predictor.
MANCOVA analyses on judgement accuracy
To assess the additional contribution of other factors (e.g. nutrition knowledge) in explaining the variance in judgement accuracy, we ran MANCOVA with the correlations of NuVal with the judgements of consumption, purchasing and nutrition as the dependent variables; NFP served as the between-subjects factor and the other variables were used as covariates. All variables except education, income and BMI were significantly predictive of the correlations; thus we focus on models containing the significant variables only. Tests of interactions between the covariates and the independent variable in the design (i.e. NFP format) showed no significant effects and hence no violation of the constancy of regression slope assumption.
The MANCOVA resulted in a significant NFP effect (F(3, 203)=3·23, P<0·05, Roy’s Largest Root =0·05). Contrast tests (Helmert) between the mean correlation under NFP-0 when compared with the average correlations under the other two formats revealed significant differences for the nutrition ratings and the likelihood of consumption correlations with higher mean values for NFP-0, both P<0·05. That is, the accuracy in judgement as measured by the agreement between NuVal and the judgement of nutrition was greatest in NFP-0 when compared with the other two formats when controlling for nutrition/obesity knowledge, age, self-report measures of NFP usage and concern for healthy eating. This was also true for the likelihood of consuming the cereal.
Ranking of nutrients as a function of nutrition fact panels format
The mean ranking of nutrients when evaluating the cereals in the present study showed no significant effects of NFP format (F(2,137)=2·377, P=0·097). Pre-planned tests contrasting the NFP-2 with the current NFP showed that the categorization of nutrients into ‘Get Enough’ and ‘Avoid Too Much’ did not impact the ranking in the expected direction. Further, NFP-0 resulted in a significantly lower mean value (thus a higher importance ranking) for calories when compared with the NFP-2 (t(139)=2·29, P<0·05), contrary to expectations. Across NFP formats, the top ranked nutrients were calories (4·26), sugar (5·30) and total fat (5·92).
Ranking of nutrients by individuals with health issues in the sample
Few consumers reported having at least one health issue that affects their diet (61/213 or 28·6 %) and there was no relationship between the NFP format and the frequency of reporting a health issue (χ 2 (2)=2·91, P=0·23). Among participants with health problems the most common conditions were high blood pressure (n 25, 11·73 %), diabetes (n 17, 7·98 %), food allergies (n 16, 7·51 %) and high cholesterol (n 15, 7·04 %). Other health conditions reported were high blood TAG (n 7, 3·29 %) and genetic disorder (n 3, 1·41 %). In terms of diet, dietary restriction was reported as due to religion (n 6, 2·82 %), being vegan (n 1, 0·47 %), vegetarian (n 15, 7·04 %) and gluten intolerant (n 8, 3·76 %).
The sample sizes are too small for statistical mean comparisons of ranking across NFP within individuals with a specific condition, but the results did not show the expected patterns of importance rankings. Highlighted nutrients in the NFP-2 did not yield greater importance for sugars and carbohydrates for diabetics; or sodium and fibre for individuals with high blood pressure. For example, the means of the ranking of sodium were 5·70, 8·80 and 5·86 for NFP-0, -1 and -2, respectively; thus, the lowest ranking (i.e. high importance) resulted when using the current NFP rather than NFP-1 or NFP-2.
Discussion
The risks of CVD, stroke and obesity are linked to what and how much consumers eat. The intentions of the FDA are commendable in addressing these issues via policy. In discussing the NFP proposal, Drs Leighton and Kavanaugh, health scientists at FDA, expressed that, ‘The goal is to make people aware of what they are eating and give them the tools to make healthy dietary choices throughout the day’ (p. 2)( 2 ). Understanding consumers’ information processing is essential to advancing this goal.
Nutrition judgements were in ordinal agreement with NuVal scores in all NFP formats and this is surprising given that NuVal is based on a complex algorithm. However, placing these findings within the Lens Model, we see that in task environments in which a few cues can predict a criterion well, judgement accuracy can be high with little information. Analyses of task environments have demonstrated this( Reference Stewart, Roebber and Bosart 53 ). In the present study, the foods were restricted to cereals. In this cereal domain and within the limits of the sample of items, protein, fibre and potassium increased the nutritional quality of cereals, whereas sugar and sodium decreased it. The pattern of cue utilization at the person level agreed with this. Importantly, the level of agreement was higher when using the current NFP rather than the modified NFP. Furthermore, NFP format predicted judgement accuracy in addition to age and obesity knowledge, with the current NFP leading to higher accuracy. The likelihood of consuming and purchasing healthier cereals varied as a function of nutrition knowledge, concern for healthy eating and self-reports of NFP usage, but purchasing did not depend on NFP format.
In terms of importance of nutrients, the top ranked nutrients were calories, sugar and total fat across the sample. These agree with results found by Grunert et al.( Reference Grunert, Fernández-Celemín and Wills 54 ). The greater emphasis of calories in NFP-1 and NFP-2 was not effective in increasing importance ratings or in curtailing amounts to eat of high-calorie cereals. In addition, individuals with health problems did not show effects supporting new NFP format changes. As discussed, NFP-2 has clear categories of good and bad nutrients but individuals with high blood pressure, for example, gave a better ranking to sodium when using the current NFP instead of the modified ones. A study of New York City residents diagnosed with hypertension showed that these individuals had a higher self-report rate of looking at sodium on the NFP; however, urine samples between high and low frequency NFP users demonstrated no differences in sodium intake( Reference Elfassy, Yi and Eisenhower 55 ). Hence, the validity of self-report is questionable and better measurement techniques, such as those advanced by Lens Model analysis, are in demand. Another aspect is whether individuals evaluate options individually or conjointly. It is well known that single evaluations do not always coincide with joint evaluations and comparative choices tend to favour more important dimensions( Reference González-Vallejo and Moran 56 ). Comparative choices may be more common in shopping activities, thus further tests of labels that emphasize good or bad nutrients are warranted. Finally we reiterate that people’s self-insights are not always in line with their behaviour( Reference Harries, JSBT and Dennis 57 ) and this further complicates the task of testing decision aids that can impact actions. We support outcome measures that go beyond self-report.
The FDA proposal faces some criticism. On 27 June 2014, Senior Vice President for Government Relations and Public Affairs of the American Bakers’ Association stated that changes must be supported by science that shows increased consumer understanding( 8 ). Frank and Silverglade of the OFW law firm( Reference Frank and Silverglade 58 ) stated that: ‘Even lawyers wince at triple indent in legal documents, how will a busy consumer comprehend the information when glancing at a food label in the grocery store? Will this be another misguided attempt by the administration and only confuse consumers more? Will it provide any long-term benefits to American’s health?’ The current study begins to answer these very pertinent questions, albeit in a controlled experimental setting, and shows that some of the proposed NFP changes may make little difference because the amount of information present in all NFP formats is large and individuals tend to use only a few pieces of data. Further studies are of course warranted.
The FDA efforts are not devoid of consumer-based research. Indeed, the FDA’s NFP proposal is based in part on recommendations from the Institute of Medicine and data from the National Health and Nutrition Examination Survey. Additionally, ongoing research by the International Food Information Council Foundation is concluding that changes to the NFP are favourable( 59 ). These conclusions are based on assessments that focus on the understanding of information such as Daily Values and caloric intake. Our focus is different because we address global appraisals of food nutrition rather than interpretation of NFP information. Thus, the fact that our results differ is not surprising. In combination, both studies provide useful data for the FDA and the public. In particular, our study taps into the important concept of assessing the overall nutrition of food, which, according to Dr Kessler, is missing in the new NFP proposed changes( Reference Kessler 6 ). To the extent that patterns of nutrients indexing overall nutrition quality are emphasized, perhaps via front-of-package labels, consumers would be aided. This information may be particularly relevant in a market in which health claims are abundant( Reference Legault, Brandt and McCabe 60 ), thus making nutrition evaluations via the NFP more challenging because this label is found on the back or side of packages instead of the front. Other aspects that may complicate evaluations of nutrition pertain to the quality of the process of production of ingredients such as organic v. non-organic. A recent study of a large sample of cereals in the USA found that the average NuVal of organic cereals did not differ from that of non-organic varieties( Reference Woodbury and George 61 ). Such findings are important because individuals may make erroneous inferences about a product high in sugar and sodium if it is labelled organic, even though it is not necessarily a healthier choice( Reference Schuldt and Schwarz 62 ).
In sum, in an ideal testing situation in which participants were given ample time and clear presentation of NFP, the new proposed NFP did not result in different evaluations. The average consumer in this sample was not highly educated nor of high economic means, but older individuals with greater knowledge of obesity had greater accuracy using the current NFP, perhaps due to their greater familiarity with it. Older adults with greater concern for healthy eating and nutrition knowledge, plus self-reported higher use of NFP had greater likelihood of consuming healthier cereals when using the current NFP; purchasing intentions, on the other hand, did not depend on NFP. Reported serving size consumption did not vary with design variables or with the quality of the foods. This insensitivity to nutrition in terms of consumption amount may be attributed to the hypothetical nature of the study as participants did not actually consume the foods. It could also be due to habits which greatly dictate the amounts of food eaten in specific categories such as cereals (i.e. about two cups). Further studies are needed to more clearly specify the link between knowing what is nutritious and knowing about desirable serving sizes that promote a balanced diet. As is well known, the ‘low-fat’ effect showed greater intake of snacks having this claim, blinding consumers to the increase of total calories consumed( Reference Wansink and Chandon 63 ). Thus, in the presence of such claims, clearer guidelines with regards to reasonable serving sizes for various food categories are desirable.
Acknowledgements
Acknowledgements: The authors thank an anonymous reviewer for helpful comments on an earlier version of this manuscript. Financial support: This research received support from The Diabetics Institute at Ohio University. The Institute provided the funds to pay participants. There was no role carried out by the Institute in terms of design, data collection, analysis, or interpretation of results. Conflict of interest: None. Authorship: Both authors contributed in all aspects of this research with C.G.-V. at the lead of data analysis and writing of the manuscript; B.D.L. assisting in the design of the study and data collection, her writing contributions further support her inclusion as an author. Ethics of human subject participation: The project was reviewed and approved by the IRB office of Ohio University. Participants were free to participate and could withdraw at any time. No personal information was recorded. Participants were not subjected to any activity that may be deemed unethical.
Appendix
General Nutrition Knowledge Questionnaire (GNKQ)
Parmenter K & Wardle J (1999) Development of a general nutrition knowledge questionnaire for adults. Eur J Clin Nutr 53, 298–308. Items in the GNKQ (response format true/false):
-
1. Experts advise that people eat three servings of fruit and vegetables a day (one serving could be, for example, an apple or a handful of chopped carrots).
-
2. The most important fat for people to cut down on is monounsaturated fat.
-
3. Some foods contain a lot of fat but no cholesterol.
-
4. A glass of unsweetened fruit juice counts as a helping of fruit.
-
5. Saturated fats are mainly found in dairy products.
-
6. Brown sugar is a healthy alternative to white sugar.
-
7. There is more protein in a glass of whole milk than in a glass of skimmed milk.
-
8. Polyunsaturated margarine contains less fat than butter.
-
9. White bread contains more vitamins and minerals than brown or whole grain bread.
-
10. Butter is higher in calories than regular margarine.
-
11. Coconut oil contains mostly monounsaturated fat.
-
12. Polyunsaturated fats are mainly found in vegetable oils.
Obesity Risk Knowledge Questionnaire (ORK)
Swift JA, Glazebrook C & Macdonald I (2006) Validation of a brief, reliable scale to measure knowledge about the health risks associated with obesity. Int J Obes (Lond) 30, 661–668. Items in the ORK (response format true/false):
-
1. A person with a ‘beer-belly’ shaped stomach has an increased risk of getting diabetes.
-
2. Obesity increases the risk of getting bowel cancer.
-
3. An obese person who gets diabetes needs to lose at least 40 % of their body weight for clear health benefits.
-
4. Obese people can expect to live as long as non-obese people.
-
5. Obesity increases the risk of getting breast cancer after the menopause.
-
6. Obesity is more of a risk to health for people from South Asia (e.g. India and Pakistan) than it is for White Europeans.
-
7. There is no major health benefit if an obese person who gets diabetes, loses weight.
-
8. Obesity does not increase the risk of developing high blood pressure.
-
9. It is better for a person’s health to have fat around the hips and thighs than around the stomach and waist.
-
10. Obesity increases the risk of getting a food allergy.
Concern for Healthy Eating Scale
Kähkönen P, Tuorila H & Rita H (1996) How information enhances acceptability of a low-fat spread. Food Qual Prefer 7, 87–94. How concerned are you about the following issues? ‘1=I am not concerned at all’; ‘9=I am extremely concerned’ (Cronbach’s α= 0·84 in the current sample):
-
1. Getting a lot of salt in my food.
-
2. Getting a lot of fat in my food.
-
3. Getting a lot of sugar in my food.
-
4. Getting many calories.
-
5. Getting sufficient energy from my food.
-
6. Food additives in my food.
-
7. Risk for high blood pressure.
-
8. Risk for coronary heart disease.
-
9. Getting a lot of cholesterol in my food.
-
10. Gaining weight.


