


Low socio-economic status (SES) is associated with higher morbidity and mortality figures in developed, developing and in-transition countries( Reference Mackenbach, Stirbu and Roskam 1 – Reference Chandola 3 ). For children, in particular, low SES is related to poorer health and development( Reference Spencer, Thanh and Louise 4 ). Unfavourable socio-economic circumstances may adversely affect the lifetime incidence of metabolic abnormalities, type 2 diabetes mellitus and obesity( Reference Tamayo, Christian and Rathmann 5 ). On the other hand, socio-economic inequalities are also associated with several lifestyle aspects, including dietary habits( Reference Fismen, Samdal and Torsheim 6 – Reference McCormack, Hawe and Perry 8 ) and physical activity( Reference McCormack, Hawe and Perry 8 – Reference Jimenez Pavon and Ortega 10 ) and, thus, weight status and obesity( Reference Tamayo, Christian and Rathmann 5 ). Mediating pathways have been proposed, such as differences in nutrition knowledge and food purchasing behaviours, and concerns regarding the price of healthy foods( Reference Ball, Crawford and Mishra 11 – Reference Turrell and Kavanagh 13 ).
In Greece, a Mediterranean country, the ongoing economic crisis has resulted in increased rates of unemployment, income reduction and economic insecurity, with the consequences being more pronounced in socio-economically vulnerable areas of the country( 14 ). Previous evidence from quantitative and qualitative studies indicates that economic crisis results in changes in children’s food consumption and nutrition worldwide, with particular impact on vulnerable populations( Reference Rajmil, Fernandez de Sanmamed and Choonara 15 ). It would therefore be reasonable to assume that a similar situation exists in Greece. Available data regarding dietary habits during crisis in this country are limited. Thus, evaluation of the diet quality of children as well as exploration of the important socio-economic factors that may undermine it are of utmost importance from a public health perspective and under the purpose of undertaking effective interventions.
The aim of the present work was to examine the role of potential socio-economic and lifestyle parameters in the diet quality of students and their families living in low-SES areas of Greece who were participating in a school-based food aid programme. Besides traditional statistical methods, the methodology applied includes classification–regression tree analysis (CART)( Reference Lemon, Roy and Clark 16 ). Decision-tree analyses, like CART, constitute a data-mining method with increasing appeal in the field of nutritional epidemiology, as they allow examination of relationships between factors, especially in large data sets, and provide a visual, translational presentation of results( Reference Hearty and Gibney 17 – Reference Tyrovolas, Tountas and Polychronopoulos 19 ). The CART tree-building technique employs binary recursive partitioning to better clarify complex associations between variables. Among its advantages, it is inherently non-parametric and simple to interpret, even by non-statisticians. Thus, CART was used in the present work to increase understanding of the associations between dietary habits, SES and mediating and/or confounding factors; the findings could provide a basis for the development of targeted, more cost-effective interventions in similar population groups.
Methods
Participants
The present work is part of the ‘DIATROFI’ programme (http://diatrofi.prolepsis.gr/en/), a school-based food aid programme targeting children (3–12 years old) and adolescents (13–18 years old) attending elementary and secondary schools in areas of low SES. Specifically, postal codes with an average per capita income, as depicted in the taxable income database of the Greek Ministry of Finance, below specific thresholds were considered areas of low SES. Different thresholds were set by wider geographical region (Attica, Central Macedonia, rest of Greece), so as to approximate the 25 % lower percentile of the regional income distribution. The thresholds were set a priori taking into account the available funding and the rate approximated the respective percentage of people in Greece living below the poverty line according to national figures provided by the Hellenic Statistical Authority.
After establishing initial contacts with all schools in low-SES areas, principals were asked to fill in an application for participation; a total of 394 principals declared their willingness to participate in the programme (corresponding to 67 394 students). Due to financial constraints, 162 schools (25 309 students) were selected to participate in the school year 2012–13. Several criteria were combined to locate the schools more in need among the applicants, namely relative income by region and specific information provided in the applications, such as the proportion of students estimated to be food insecure by the principals and special characteristics of schools (e.g. students from social institutions; proximity to social housing premises; Roma students – a vulnerable social group; fainting episodes recorded in the school due to hunger). All parents of the selected students were asked to fill in an anonymous restructured questionnaire, one per student. We received 15 897 questionnaires, in total, at the beginning of the programme (62·8 % response rate); however, 11 717 questionnaires were fully completed enabling us to calculate all the associated figures and scores of interest. To acquire results on the basis of the total sample as well, imputed values methods were also applied (more information is provided in the ‘Statistical analysis’ section).
Parents provided their signed consent and the programme received approval by the Ministry of Education. No financial incentives were given to the students or to their parents, and the provision of the meal was independent of whether they completed the questionnaires or not. No identification of the parent or the student was possible.
Assessment
Each parent received a questionnaire with written instructions and returned it to the school principal, who subsequently delivered all questionnaires from the school to the research team. The questionnaire included several thematic entities, i.e. basic demographics, family and household characteristics, eating and lifestyle habits. All questionnaires were completed anonymously.
Demographic and socio-economic characteristics
Parents provided information regarding children’s age, place of birth, weight and height, family status, and parental occupation, employment status and education level. Parental educational level was evaluated through school level and education years as follows: (i) low=illiteracy, primary and middle school (≤9 years); (ii) medium=high school or corresponding technical high school (10–12 years); and (iii) high=university or higher education (≥13 years).
In addition to parental educational level, the Family Affluence Scale (FAS) was used as a measure of SES( Reference Currie, Molcho and Boyce 20 , Reference Boyce, Torsheim and Currie 21 ). The FAS was developed in the context of the WHO Health and Behaviour in School-Aged Children (HBSC) study, carried out at regular intervals in many European and non-European countries, including Greece. It was introduced as an additional, non-occupational based indicator index in order to classify a greater proportion of the sample in terms of SES( Reference Currie, Elton and Todd 22 ). It was validated in all countries participating in HBSC as a measure of national wealth( Reference Boyce, Torsheim and Currie 21 ) and has been used in HBSC surveys for more than 10 years, to examine and explain socio-economic inequalities( Reference Currie, Molcho and Boyce 20 ). It is more ecologically valid than parental income data, as it is based on the family context of consumption. Specifically, FAS is conceptually related to four common indices of material deprivation and home affluence and it is composed of the corresponding items: (i) the number of cars in the family, widely used in health inequalities research; (ii) whether each child in the family has his/her own bedroom, as a simple proxy for overcrowding; (iii) the number of personal computers in the family, representing a measure of deprivation of home facilities; and (iv) the number of family vacations the previous 12 months, an item used to identify higher-SES families in affluent countries. A composite score was calculated for each family and participating student. For the present analysis, a three-point ordinal scale was used in which FAS score of 0–2, 3–5 and 6–9 indicated low, middle and high FAS affluence, respectively.
From self-reported weight and height, BMI was calculated (kg/m2) and children were then categorized as underweight, normal weight, overweight or obese, according to the International Obesity Task Force BMI cut-off points( Reference Cole, Bellizzi and Flegal 23 , Reference Cole, Flegal and Nicholls 24 ).
Dietary intake
Eating habits were assessed through a semi-quantitative FFQ. Consumption of selected food items was recorded, including fruits, vegetables (raw, cooked), dairy products (full-fat milk/yoghurt, low-fat milk/yoghurt, chocolate milk, low-fat cheese, full-fat cheese, feta cheese), cereals (breakfast cereals, white bread, wholemeal bread, pita bread, wholemeal pita bread, rice), potatoes (boiled/baked, French fries), eggs (boiled, scrambled), hamburgers, hot dog, pizza, souvlaki, savoury pies, cookies/cakes, croissants, chocolates, sodas (normal, low-fat, energy drinks), pasta, traditional dishes with pasta, legumes, traditional dishes with vegetables, fish and seafood, and meat (veal, pork, lamb, other meals). The respondents were asked how often they eat each of food items and the response categories were ‘never’, ‘seldom’, ‘at least once a week but not daily’, ‘once a day’ and ‘more than once per day’. Frequency (rarely, 1–2 times/week, 3–4 times/week, 5–6 times/week or every day) and composition (milk, yoghurt, cereal, fruit juice, honey/jam, bread, butter, margarine, cookies and fruit) of breakfast consumption was evaluated. Furthermore, the participants were asked to provide information regarding the number of meals (including snacks) their children consume daily.
From these responses, a score for a modified KIDMED version was calculated. KIDMED has been widely used for the assessment of diet quality in children and adolescents( Reference Naska and Trichopoulou 25 ). It was originally developed by Serra-Majem et al.( Reference Serra-Majem, Ribas and Ngo 26 ), in an attempt to combine the Mediterranean diet guidelines for adults as well as the general dietary guidelines for children (i.e. breakfast skipping) in a single index. It was based not only on the principles sustaining Mediterranean dietary patterns, but also on those that undermine it. Items denoting a negative connotation with respect to the Mediterranean diet were assigned a value of −1, and those with a positive aspect +1. The original index comprises sixteen items in the form of ‘yes’ or ‘no’. Our modified version contained fifteen items (consumption of nuts was not included in the FFQ; thus no item could be calculated). Total score ranged from −4 to 11; the higher the score the more children’s diet matches guidelines for a healthy, Mediterranean-type diet.
Physical activity assessment
Leisure-time physical activity was estimated through parents’ report of the mean weekly hours children spent on: (i) organized physical exercise (e.g. team sports, gym, dance, etc.); and (ii) sedentary activities (e.g. television viewing, computer or video games)( Reference Kontogianni, Vidra and Farmaki 27 ). Moreover, the number of days per week children go out for fun, pleasure and/or games was also recorded.
Statistical analysis
Descriptive characteristics of the participants are presented as means and standard deviations or as absolute and relevant frequencies. The χ 2 analysis or one-way ANOVA was used to examine the relationships among the categorical or scale variables and the FAS groups. Since the KIDMED score was not normally distributed, robust linear regression analysis was used to explore associations between diet quality and body weight status, sports/sedentary activities and sociodemographic factors (age, sex, parental education and FAS). Robust linear regression takes into account the presence of outliers by weighting the observations based on the Cook’s distance, thus producing more robust results and associated P values. For the interactive exploration of associations, the description and prediction of patterns and processes, we performed CART analysis, where data space is partitioned into homogeneous groups with respect to the dependent variable. Overfitting was avoided by using the default pruning parameter. The minimum number of cases was set to 600 for a root node and 400 for a leaf node.
As returned questionnaires contained several missing responses, all the aforementioned analyses were repeated after replacing missing values with imputed values (five imputed values were selected for each missing cell), under the missing at random assumption. The responses from the food frequency and the other nutrition questionnaires were included in the multiple imputation models along with students’ information, parents’ characteristics and FAS.
The χ 2 analysis, one-way ANOVA and CART analysis were performed using the statistical software package IBM SPSS version 21·0. Robust linear regression was performed in the statistical software package STATA version 12. Missing values imputation was implemented in the statistical program R and the package Amelia II( Reference Honaker, King and Blackwell 28 ).
Results
Characteristics of children and their parents according to FAS group are presented in Table 1. The education level of parents in the low or medium FAS groups was lower compared with that in the high FAS group (over 44 % of the parents in the high FAS group had high educational level, all P<0·01). As expected, significant differences were observed regarding the individual components of the score across the FAS groups. Regarding diet quality, KIDMED score increased significantly when moving from lower to higher FAS both in children and adolescents (P<0·001). Furthermore, fruit, vegetable and dairy product intakes and breakfast consumption were significantly related with the FAS in both age groups (P<0·001): the higher the FAS score, the greater the percentage of children and adolescents who reported to consume, on a daily basis, fruits and vegetables, dairy products and breakfast. The frequency of sedentary activities was significantly related to FAS in children (higher FAS was associated with lower engagement in sedentary activities, P<0·001), but not in adolescents (P=0·433). On the other hand, the hours spent on sports activities increased on average by half an hour per week for children in the high compared with the low FAS group (3·3 (sd 1·9) v. 2·7 (sd 2·4) h/week) and on average by an hour for adolescents in the high compared with the low FAS group (4·5 (sd 3·2) v. 3·1 (sd 3·0) h/week).
Table 1 Demographic, socioeconomic, dietary and lifestyle characteristics according to age and FAS group among children and adolescents attending elementary and secondary schools in low socio-economic areas, Greece, 2012–13 school year
FAS, Family Affluence Scale; PC, personal computer.
Values are presented as means and standard deviations or as absolute values and percentages.
P values refer to the significance of the difference among different FAS groups.
* Pearson’s χ 2 test.
† Kruskal–Wallis test.
Robust linear regression with forward stepwise variable selection was performed to examine the role of the factors influencing diet quality in children and adolescents (Table 2). After adjustment for parental education, students’ age, sex and engagement in sedentary or sports activities, FAS was significantly associated with KIDMED (P<0·001): KIDMED score is expected to increase by 0·50 units when FAS changes from low to medium and by 0·82 units when FAS increases from low to high (Table 2). KIDMED score was also positively related to sports activities (P=0·005) and negatively related to sedentary ones (P<0·001).
Table 2 Robust linear regression estimates for lifestyle and socio-economic factors affecting diet quality (KIDMED score) among children (3–12 years old) and adolescents (13–18 years old) attending elementary and secondary schools in low socio-economic areas, Greece, 2012–13 school year
FAS, Family Affluence Scale.
As potential regressors were considered body weight status, sports/sedentary activities, age, gender, parental education and FAS; statistically important variables were selected using forward stepwise model selection method.
The tree-building technique, CART, was used to further evaluate potential associations between lifestyle and socio-economic factors and KIDMED, as an index of diet quality (Fig. 1). As expected, the most important classification factor was the FAS group: children and adolescents in the medium or high FAS group had higher KIDMED score (increase by 5·6 %), compared with those in the low FAS group (decrease by 11·5 %). For the children and adolescents in the low FAS group (left branch), the KIDMED score is expected to increase by 12·4 % (from 4·1 to 4·7) when they spend more than 0·25 h/week in sports activities. Those who spent less than 0·25 h/week in sports activities had lower KIDMED score. On the other hand, for children and adolescents in the medium and high FAS groups (right branch), the education of the mother and father exerted a significant role, as students whose mother had a high level of education (whatever the father’s education was) had better diet quality (KIDMED increase by 8·3 %), whereas students whose mother had a low educational level had lower diet quality (decrease by 4·8 %). Besides that, the frequency of sports activities influenced the diet quality of children and adolescents with high maternal education level.
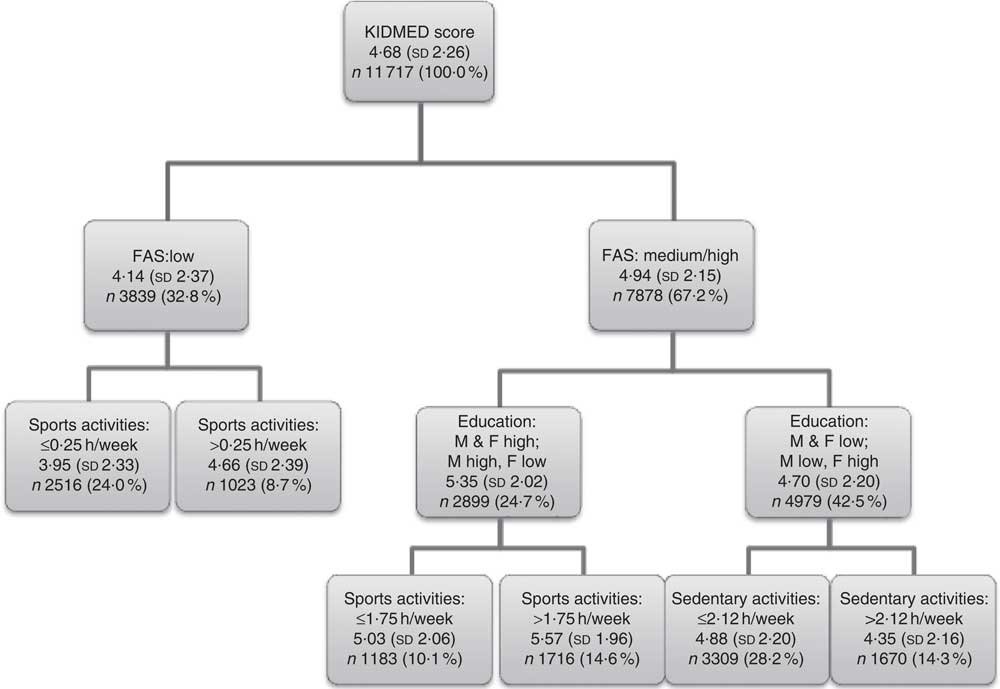
Fig. 1 Tree analysis (classification–regression tree analysis, CART) estimates for lifestyle and socio-economic factors affecting diet quality (KIDMED score) among children (3–12 years old) and adolescents (13–18 years old) attending elementary and secondary schools in low socio-economic areas, Greece, 2012–13 school year (FAS, Family Affluence Scale; M, mother; F, father)
Missingness on the fifteen items of the KIDMED score varied from 1·9 % to 16·5 % and the percentage of missing values for the KIDMED score was 26·3 %, as it is a summation-derived variable. Students with missing KIDMED information had lower FAS level; their parents had lower educational level and tended to spend more time on sedentary activities and less time on sports than those with KIDMED score available. The aforementioned analyses were, thus, repeated for the imputed data sets (including 15 897 cases compared with 11 717 analysed, on the basis of fully completed questionnaires). The robust linear regression model did not change in terms of significance and direction of the associations. Furthermore, for each imputed data set a CART was performed: the most important classification factor was still found to be the FAS level for all trees, followed by the frequency of sports activities and the education of parents (as in the original data set). The larger sample size of the imputed data allowed for further classification and, thus, students’ age and frequency of sedentary activities appeared as the next classification variables: among students with low frequency of sports activities and low FAS, children tended to have on average higher KIDMED score compared with adolescents. On the other hand, students with low FAS but higher frequency of sports activities had higher KIDMED score when they reported to spend less time on sedentary activities.
Discussion
The results of the present study indicate that diet quality is strongly influenced by socio-economic parameters in children and adolescents living in economically disadvantaged areas, with higher family affluence being associated with better diet quality. Specifically, KIDMED score is expected to increase by 0·50 units when FAS changes from low to medium and by 0·82 units when FAS increases from low to high. In practical terms, a 0·5-unit increase in KIDMED may correspond roughly to half a fruit or a portion of vegetables per day, or half a portion of dairy product for breakfast, or a portion of cheese/yoghurt per day.
There is previous research supporting the association between socio-economic status, assessed through family income and/or parental level of education and occupation, and dietary intake in terms of nutrient adequacy and food group intake( Reference Darmon and Drewnowski 29 – Reference Vereecken, Inchley and Subramanian 35 ). We advanced this knowledge by extending associations to the whole diet and diet quality, using the perspective of a priori defined dietary patterns( Reference Hu 36 ). Furthermore, we applied a more advanced analytical approach and depicted these associations schematically: the use of CART analysis allows for better understanding of the inter-correlations of the collected information and a more comprehensive presentation of the results.
Food choices are influenced by various interrelated factors, including economic status and food cost( Reference Darmon and Drewnowski 29 , Reference Drewnowski and Darmon 37 ). Lower affluence may promote low-cost diets, as these diets are more energy-dense, have longer shelf lives and satisfy hunger( Reference Darmon and Drewnowski 29 ). However, under current circumstances, they are also the least healthy and nutrient-dense diets( Reference Darmon, Briend and Drewnowski 38 ). Additionally, people in lower socio-economic groups have, in general, lower nutrition knowledge and are more indifferent towards nutrition guidelines( Reference Darmon and Drewnowski 29 ). Furthermore, neighbourhoods where economically disadvantaged and minority populations reside are more likely to have abundant sources of foods that promote unhealthy eating and, most importantly, have lower access to healthy food choices( Reference Hilmers, Hilmers and Dave 39 ). All of these elements may be dynamically interconnected with financial constraints and explain, to a great extent, diet and health inequalities. In countries like Greece where fruits, vegetables and pulses are widely available and relatively cheap, individuals of low SES could benefit more by nutrition-related health promotion programmes.
Equally important, time spent in sedentary and sports activities was significantly associated with the levels of FAS. These findings are in accordance with previous work, showing that low family affluence was associated with lower physical activity levels and increased hours of television viewing, for both boys and girls( Reference Hanson and Chen 40 , Reference Stalsberg and Pedersen 41 ). Personal and environmental parameters, such as safety, affordability and social support, may influence the aforementioned inequalities( Reference Humbert, Chad and Spink 42 ). Taking into account that engagement in sedentary activities tends to be associated with unhealthier dietary choices( Reference Pearson and Biddle 43 ), combined diet and physical activity interventions should be implemented in order to target a healthy lifestyle pattern.
The first node of the decision tree depicts FAS as the most important classification factor, verifying in a more comprehensive way the results of the linear regression. Only for those in the medium or high FAS group was the effect of maternal education evident, possibly due to the fact that low FAS was associated with a lower education level. Maternal education, as an indicator of SES, has been consistently shown to affect children’s food choice and disease risk( Reference Kontogianni, Vidra and Farmaki 27 , Reference Hu 36 – Reference Hanson and Chen 40 ). Given these findings, even families with medium/high FAS should be targeted for health promotion if the level of maternal education is low. These associations could be attributed to poorer maternal nutrition knowledge, unhealthier eating choices and to inappropriate feeding practices( Reference Cribb, Jones and Rogers 44 – Reference Vereecken, Keukelier and Maes 46 ). It is to be noted that, although the various socio-economic indicators (either simple ones, such as education, occupation and income, or more composite ones, such as affluence) may be interrelated, they are not interchangeable, but rather partially independent and interdependent determinants of health( Reference Lahelma, Martikainen and Laaksonen 47 ). Research to improve the measurement of socio-economic factors is essential for improving evidence; the present descriptive research, involving measurement of several factors in a specific population group (i.e. children in a socio-economically disadvantaged areas), may add information to the ongoing discussion( Reference Braveman, Egerter and Williams 48 ).
Body weight status was found to be of borderline significance when associated with the FAS scale, although higher obesity rates were observed for lower FAS levels (i.e. lower quality of life). However, body weight status was not a statistically significant factor when associated to the KIDMED score, either in the linear regression or in the CART analysis, even when using the imputed data. This issue needs more in-depth analysis in the future, using measured values of weight and height and/or other biological indices associated with overweight or underweight.
Due to the observational design, a potential limitation of the present study is the lack of causal interpretations: the cross-sectional analysis allows only for development of hypotheses, but future evaluation in longitudinal and interventional studies is needed. Misreporting of food items and other lifestyle characteristics, as well as over- or underestimation in reporting may also be present, due to the recall bias and the self-reported nature of the questionnaire. Dietary habits were assessed using a food frequency tool; however, nutrient intake was not assessed, as this questionnaire was not validated in children and adolescents for energy and macronutrients. For conformity reasons, we decided to use same tools and same methodology for both children and adolescents. This may add another limitation to the study, as parents may not accurately report adolescents’ eating. This can be also a problem with assessment of children’s dietary intake, as in modern societies children spend many hours outside home having access to food. However, according to a recent work, general agreement was observed between parents’ and children’s (aged 10–12 years) meal consumption reports( Reference Persson Osowski, Fjellstrom and Olsson 49 ). The issue needs further clarification. Finally, scores of FAS, KIDMED and levels of education may be overestimated, since a significant proportion of non-respondents could be those parents with minimal or no literacy or knowledge of the Greek language (refugees and immigrants). Multiple imputation method was used to examine the effect of the missing information for all the analyses presented. No socially and biologically important differences were found between the analyses in the original and in the imputed data.
As low-SES groups are more vulnerable to low diet quality, it is of crucial importance to take action through tailored programmes for the promotion of healthy dietary habits, directed to those who are more in need. In our view, programmes targeting such populations should have a special low cost–high nutrition value design. Evaluation studies of these programmes will enable identification of the most effective ways to promote healthy nutrition in children and parents belonging to vulnerable socio-economic groups.
Acknowledgements
The DIATROFI Program Research Team (in alphabetical order): Belogianni Katerina, MSc; Benetou Vassiliki, PhD; Dalma Archontoula, MSc; Giannikou Dafni MSc; Geograkopoulos Panagiotis, PhD; Gioti Natalia, BSc; Haviaris Anna Maria, MSc; Karagas R Margaret, PhD; Karnaki Pania, MA; Kastorini Christina Maria, PhD; Koutelidas Ioannis, MA; Linos Athena, MD, MPH, PhD; Linos Eleni, MD, MPH, DrPH; Linos Elisabeth, AB; Linos Natalia, MS, ScD; Lykou Anastasia, PhD; Mitraka Kalis, MA; Pantazopoulou Anastasia, MD; Papadimitriou Eleni, MD, PhD; Papalambrou Valentina, MA; Peppas Manolis, BSc; Petralias Athanassios, PhD; Riza Elena, PhD; Saranti Papasaranti Eirini, MSc; Spyridis Ioannis, MSc; Veloudaki Afroditi, MA, PhD; Yannakoulia Mary, PhD; Zagouras Alexia, BA; Zota Di. Financial support: The food aid and promotion of healthy nutrition programme was financed by the Stavros Niarchos Foundation. The Stavros Niarchos Foundation had no role in the design, analysis or writing of this article. Conflict of interest: None. Authorship: M.Y., A.Ly., A.P. and A.Li.: study design, data collection, data analysis, data interpretation, writing, literature search; C.M.K.: data interpretation, writing, literature search; E.S.P.: data collection, data analysis; A.V.: study design, data collection. Ethics of human subject participation: The food aid and promotion of healthy nutrition programme has been approved by and runs under the auspices of the Ministry of Education and Religious Affairs, Culture and Sport of the Hellenic Republic.


