Transparency has become an important regulatory tool( Reference Weil, Fung and Graham 1 ), and the provision of nutrition information on packaging is seen by policymakers as a means of increasing transparency between producers and consumers that therefore has the potential to support informed choice. In order to address the current and growing burden of diet-related disease, the World Health Organization's Global Strategy on Diet, Physical Activity and Health has highlighted nutrition as a key risk factor( 2 ). The concept of informed choice within the food domain has subsequently become synonymous with encouraging consumers towards healthier choices with the provision of nutrition information. The recently approved regulation of the European Parliament and the Council of 25 October 2011 on the ‘Provision of food information to consumers’( 3 ) requires all pre-packaged foods to be labelled with energy, fat, saturates, carbohydrates, sugars, protein and salt per 100 g or per 100 ml and, if desired, per portion, where the portion must be clearly stated on the pack. Additionally, expression as a percentage of daily reference values per 100 g/ml and per portion is permitted. Typically, manufacturers present this nutritional information in the form of a table on the back of the pack.
For some time, it has been suggested that supplementing the back of pack nutrition information table with a front-of-pack (FOP) label may be more effective in encouraging consumers to choose healthier foods when shopping( Reference Geiger, Wyse and Parent 4 – 6 ). In addition, FOP labelling is considered to have the potential to encourage food manufacturers to reformulate their products such that they may display more favourable FOP labels( Reference Roodenburg, Popkin and Seidell 7 ). Although the European Union regulation did not go so far as to make FOP nutrition labelling mandatory, if it is voluntarily included by the manufacturer, it must in the future conform to the specifications in the legislation, i.e. energy alone or in conjunction with per portion values for the four key risk nutrients. If desired, these may also be expressed in terms of a percentage of daily reference values( Reference Wiseman 8 ).
Over the past few years, a number of different FOP labelling systems have been developed and implemented in Europe by industry and organisations concerned with health promotion. The two most prevalent include values for energy and the four key risk nutrients, but they also include other elements, namely, percentages of guideline daily amounts (GDA) or traffic light (TL) colours to aid consumer understanding of the numerical content values given for each nutrient. More recently in the UK, a FOP system based on a hybrid (HYB) of both GDA and TL has been promoted as the optimal approach. A fourth approach does not display numerical information about the content of the food in the FOP label but instead involves the use of a simple visual symbol or health logo (HL) to indicate that the product is considered to be a healthier choice. These logo schemes are underpinned by a variety of nutritional profiling algorithms which take into account both risk and positive nutrients in order to determine whether a product is eligible to display the HL; however, these criteria are often not visible to the consumer. Despite the prevalence of the aforementioned FOP systems, food manufacturers in Europe will only be allowed to continue supplementing the specified nutrition information on the front of the pack with elements other than the percentages of daily reference values if they are shown to be both scientifically valid and not misleading for the consumer( 3 ). To date, there has been much debate amongst researchers, policymakers and stakeholders, but little consensus has been reached about the optimal FOP labelling system, principally because the various schemes differ in terms of what they are attempting to communicate to the consumer. In order to inform the debate further, we believed that a systematic exploration would be helpful for establishing the extent to which the inclusion of the most prevalent FOP elements impact consumer perceptions of healthiness over and above provision of a basic FOP label (BL) containing numerical nutritional information alone. However, it should be noted that FOP labels in this basic format do not currently exist in the marketplace.
An experiment was developed to assess the effect of overlaying a BL displaying only values for energy and the four risk nutrients (expressed in g/portion) with four separate elements or FOP systems: GDA, TL, HYB and HL. We explored the impact of these FOP systems on subjective healthiness ratings and compared them to the subjective healthiness ratings given for the BL format in four countries: the UK, Germany, Poland and Turkey. Recognising that the performance of the various FOP elements may vary across different food categories, different portion sizes and even foods of different levels of healthiness within a particular food category( Reference Wasowicz-Kirylo and Stysko-Kunkowska 9 ), we included in the study design three different food categories, two different portion sizes and three levels of healthiness for the foods within each of the food categories. An objective healthiness score was calculated for each of the foods in order to test whether any particular FOP system would result in participant healthiness ratings that were closer than the ratings for the BL to an objective healthiness rating. We hypothesise that the optimal FOP system will result in participant healthiness ratings closer than the ratings for the BL to an objective healthiness rating across all of the food categories, portion sizes and levels of healthiness of the foods.
Methods
Study design
The design had both within- and between-subjects factors. The within-subjects factors were: food (pizzas, yogurts and biscuits), healthiness of the food (high health, medium health and low health) and the repeated measurements first with the BL format and then with one of the test FOP label system formats. The between-subjects factors were: the FOP system (GDA, TL, HYB and HL), portion size (typical portion size and a 50 % reduction of a typical portion) and country (the UK, Germany, Poland and Turkey). Each participant provided healthiness ratings across nine foods, i.e. three pizzas, three yogurts and three biscuits, first in the BL format and then in one of the test FOP label system formats. Participants were randomly assigned to one of eight groups, which meant that they rated all three food categories and all three variants within each food category but only one test FOP label system and one portion size throughout. This resulted in each participant providing eighteen subjective healthiness ratings in total.
The study was conducted according to the guidelines laid down in the Declaration of Helsinki and in accordance with the University of Surrey's ethical procedures. The online survey itself was conducted by the professional market research agency GfK, in strict accordance with the International Chamber of Commerce/ESOMAR Code on Market and Social Research. Informed consent from the participants was required to access the survey.
Study sample
The sample consisted of 2068 participants from four European countries: 513 in the UK, 525 in Germany, 500 in Poland and 530 in Turkey. The UK has been shown to have a high prevalence of FOP labelling (about 63 %), whereas Turkey has a low prevalence (2 %), and Germany and Poland fall somewhere in between( Reference Storcksdieck genannt Bonsmann, Fernández Celemin and Larranaga 10 ).
Participants were recruited through GfK. All had some responsibility for their household grocery shopping and were regular purchasers of at least two of the test food categories: pizza, yogurts and biscuits. Quotas were applied for sex and education, and exclusions were made for colour-vision deficiencies, although post hoc tests revealed some differences between the country samples in terms of sex, education level, age and socio-economic status (Table 1).
Table 1 Participant characteristics

* χ2= 117·99, df = 3, P< 0·001, φ = 0·24.
† Low: secondary school (to age 15/16 years) or below; middle: secondary school/college (to age 17/18 years); high: university (graduate and post-graduate). χ2= 77·53, df = 9, P <0·001, φ = 0·19.
‡ χ2= 273·70, df = 15, P <0·001, φ = 0·36.
§ Group 1: managerial, professional and intermediate occupations; group 2: small employers and own-account workers; group 3: supervisory and technical operations workers; group 4: semi-routine and routine operations workers. χ2= 182·35, df = 12, P <0·001, φ = 0·30.
Study stimuli
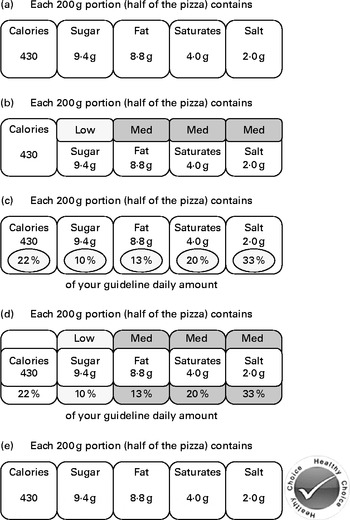
As the purpose of the study was to test the added value of the most prevalent FOP schemes over and above the provision of numerical nutritional information alone as an FOP label, a BL was developed. It contained numerical information on energy in calories and nutrient content in g (per portion) for four key nutrients; sugar, fat, saturated fat and salt. To create the labels representing the four test FOP label systems, GDA, TL, HL or HYB were overlaid onto the BL (see Fig. 1 for examples).

Fig. 1 Examples of the basic label and four test front-of-package label systems: (a) basic label, (b) traffic lights label, (c) guideline daily amounts label, (d) hybrid of guideline daily amounts+traffic lights label and (e) health logo label. To convert calories to kJ, multiply by 4·184. Examples here are shown in greyscale, but the colour versions that were seen by participants can be viewed in the online supplementary material. Med, medium.
The experiment included nine foods that represented three food categories and three levels of healthiness within each food category: high health (i.e. healthiest), medium health and low health (i.e. least healthy). When selecting the food categories to include, it was necessary to consider the different food cultures in the participating countries and to identify categories that were familiar in all four countries. Three food categories – pizza, yogurts and biscuits – were chosen because they satisfied this primary criterion. They also represented a wide range of portion sizes; biscuits are typically a snack food which tends to be presented in small portions or units, whereas pizza portions tend to be larger because it is a meal-type product, and yogurts fall somewhere in between. In addition, we considered that consumers' healthiness ratings may be impacted by their perceptions about the positive aspects or healthiness of a given food category (e.g. Ca in dairy products), and the inclusion of three different food categories within the design allowed us to assess the impact of the four test FOP label systems across different food types, one of which (yogurts) is more typically perceived as being healthy, as opposed to biscuits or pizza, which are perceived as being more indulgent foods. Following a review of the typical portion sizes on the market for each of the three chosen food categories, a typical portion was set: pizza at 200 g, yogurts at 150 g and biscuits at 18 g. The second portion condition tested was then set as a 50 % reduction of this typical portion condition to see if health inferences were impacted by a reduction in portion size under any of the label conditions.
To facilitate the final food stimuli selection within each food category, it was necessary to map the relative healthiness of the foods both within and across the food categories. This was achieved by applying the SSAg/1 nutrient profiling algorithm, one of the approaches that was considered to support the UK Food Standards Agency's initiative to address which foods should be advertised to children( Reference Rayner, Scarborough and Stockley 11 ), although it was not ultimately used for that purpose. However, this algorithm has been used in previous published research where an objective healthiness score was required to map directly onto the energy and risk nutrients that were communicated in the nutrition labels being tested( Reference Jones and Richardson 12 ). SSAg/1 scores start at 0 for the healthiest foods and increase in units of 1 for each 10 % increase in GDA of the energy, saturated fat, sugar (non-milk extrinsic) and salt contained in 100 g of a food, and they are therefore easily calculated from the nutritional information typically provided on a pack. Our use of the SSAg/1 algorithm should not be taken to suggest that it is the best possible model for nutrient profiling as a whole; the relative merits of the various models are explored elsewhere( Reference Scarborough, Payne and Agu 13 ). It was considered to be the most appropriate objective scoring model for the present study because it results in an absolute score for each food based only on energy and the main risk nutrients alone, without taking into consideration any positive aspects of the food, such as its levels of micronutrients or fibre. As the participants in the present study were only provided with FOP labels and did not base their healthiness ratings on the entire food pack, it was important that we used an objective healthiness score that reflected the information provided to them. Although it could be argued that HL systems do take positive nutrients into consideration in their algorithms, these are not communicated to the consumer in the FOP label; therefore, in reality the impact of HL systems on health perceptions is based on whether the consumer trusts the expert decision communicated by the logo.
The calculated SSAg/1 scores for each of the foods are detailed in Table 2. The final three food variants representing different levels of healthiness within each food category were selected by reviewing the nutritional values of real foods on the market and selecting those that represented a realistic upper, mid- and lower range within each category. Once the nine foods had been selected, the TL were applied to the nutritional values per portion based on the thresholds in the ‘Front of Pack Traffic Light Technical Guidance’ document from the Food Standards Agency( 14 ). The GDA values were simply calculated per portion according to published GDA criteria( 15 ). Application of the HL was based on criteria defined by the Choices International Foundation( 16 ), which specifies threshold values that a food must meet in order to display the logo. The specific criteria and threshold values vary between different product groups; for example, in the case of pizza, which is defined as a main course by the Choices International approach, the energy per serving, content of SFA, trans fatty acids, Na and added sugar must be lower than the set threshold values. In addition, the fibre content must be higher than the threshold value set for main courses. However, for biscuits, although there are threshold values for energy and the same risk nutrients, they are set at different levels than those of the main course product group, and there are no set thresholds for fibre. The process is similar for yogurts, although the criteria for this product group also does not include set thresholds for energy. Only four out of the nine foods were eligible to display an HL to supplement the numerical nutrition information on the test FOP labels; these included the highest health variants of the yogurt and biscuit categories and both the highest and medium health variants of the pizza category.
Table 2 Nutritional profile of label stimuli

* Foods eligible to display a health logo on the test front-of-pack labels.
Data collection
The labelling stimuli were presented to the participants and responses were recorded via Computer Assisted Personal Interviews. Initially, participants were required to provide subjective healthiness ratings for each of three product variants in a single food category shown in a BL format. They were then exposed to the same three foods in the test FOP label system format assigned to their group, and they rated the healthiness of the foods again. This sequence was repeated for the remaining two food categories (see Fig. 2). Participants were always exposed to groups of three stimulus labels of the same product category at once. However, the order in which the three food variants appeared on the screens was randomised. In addition, the sequence of the food categories shown was randomised across the sample. Each participant rated foods from all three food categories but in only one portion condition and one test FOP label condition, which resulted in a total of eighteen subjective healthiness ratings per participant.

Fig. 2 Flowchart of stimuli sequence within a subject. * Front-of-pack (FOP) label system and portion were manipulated between participants, so that any given participant saw only one portion size and one type of FOP label system throughout. All participants saw the same basic labels. † The order in which the foods were shown and the order in which the three labels appeared on each screen were fully randomised; however, participants were always shown the appropriate basic label set before being shown the corresponding set of FOP labels.
Measures
Perceived healthiness ratings were collected on a 15-point scale; these types of healthiness ratings have been successfully employed in other labelling studies( Reference Jones and Richardson 12 , Reference Byrd-Bredbenner, Alfieri and Kiefer 17 ). Participants were asked to rate the foods on a scale from 1 to 15 points, with 1 being the least healthy and 15 being the most healthy in the study. In contrast, the SSAg/1 objective health score scale starts at 0 for the healthiest foods, and foods with higher scores are considered less healthy. For ease of comparison between the dependent variable and the objective health score in the analysis, participants' healthiness ratings were reversed and rescaled by 1 unit to anchor at 0 (DV1). Thus, in the results of the present study, lower numbers represent healthier foods and higher numbers represent less healthy foods for both the DV1 and the SSAg/1 score.
We generated an additional dependent variable (DV2) by calculating the difference between the DV1 and the objective health score for each of the foods. This variable represents the distance of the participants' subjective healthiness ratings from the objective score for that particular food, or the ‘error’ in their healthiness ratings. Positive error scores indicated that participants underestimated the healthiness of a food (i.e. perceiving the food to be less healthy than it objectively was), and negative error scores indicated that participants overestimated the healthiness of the food (i.e. perceiving the food to be more healthy than it objectively was). Error scores of 0 would have indicated that participants rated the foods as per the objective health score.
Statistical analysis
A mixed-measures ANOVA was performed in IBM SPSS Statistics version 19.0( 18 ) using the participants' subjective healthiness ratings as the DV1. The level of significance was set at P <0·05. Greenhouse–Geisser corrections were utilised to correct for the violation of the sphericity assumption where appropriate throughout the analysis.
When interpreting these results a significant main effect for FOP labelling in the ANOVA would indicate that the provision of the FOP labelling system impacted the subjective healthiness ratings for the food as compared to the BL situation, where only energy information and nutrient information (in g) was provided. A significant interaction between FOP labelling and system (FOP × system) would indicate that the different FOP labelling systems had a differential impact on the subjective healthiness ratings for the foods. A further analysis utilising DV2 as the dependent variable was then performed to identify any potential significant effects of the different FOP labelling systems in terms of their impact on the distance of participants' subjective ratings from an objective healthiness score across the different conditions.
Results
The means and 95 % CI for the DV1 and DV2 main effects are provided in Table 3 for the sample as a whole and per country. Overall, the present analysis yielded sixty-four main effects and interactions for each of the two DV, and for the sake of brevity, we have only reported a subset in Table 4. A complete table of results can be viewed in the online supplementary material.
Table 3 Subjective healthiness ratings (dependent variable 1; DV1) and error scores (dependent variable 2; DV2) (Mean values and 95 % confidence intervals)

Table 4 Repeated measures ANOVA results for subjective healthiness ratings (dependent variable 1; DV1) and error scores (dependent variable 2; DV2)*

FOP, front-of-pack.
* For the sake of brevity, only a subset of the results are presented in this table. A complete table of the results can be viewed in the online supplementary material. Results for DV2 are only shown where the values differ from those of DV1.
It should also be noted that given the large sample size, even small effects were significant, and it was therefore important to consider the effect size in the analysis and interpretation of outcomes. For the purposes of the present paper, observed significances with an effect size of
 $$\eta _{p}^{2} $$
< 0·005 were not considered to be of any substantive interest, although some are discussed later in the paper for clarification and context purposes.
$$\eta _{p}^{2} $$
< 0·005 were not considered to be of any substantive interest, although some are discussed later in the paper for clarification and context purposes.
Utilising participants' perceived healthiness ratings (DV1) as the dependent variable
Although a significant main effect was observed for the presence of the FOP labelling systems (FOP), the very weak effect size demonstrates that the FOP labels shown to the participants had little effect on the perceived healthiness ratings of the foods over and above the provision of numerical information alone in the BL format. The lack of a significant interaction for FOP × system, that is, between one of the FOP systems and the different systems shown, demonstrates that all four test labelling systems – GDA, TL, HYB and HL – performed similarly to each other.
For the between-subjects factors, a significant country effect (country) was found, with participants from Turkey and Poland rating the foods as slightly healthier overall as compared to participants from the UK and Germany. Despite the significant portion effect (portion) that was observed, the small effect size demonstrates that presenting foods in two different portion sizes had little effect on participants' ratings overall.
In terms of the within-subjects factors, a much larger significant effect was observed for the different healthiness levels of the foods (healthiness), which demonstrates that participants were clearly able to differentiate between foods presented with differing levels of healthiness within a food category, regardless of which label format they were shown. The three-way interaction FOP × healthiness × system indicates that when the different FOP systems were applied, they had only small differential effects on the ratings across the different foods at the various levels of healthiness (Fig. 3).

Fig. 3 Front-of-pack × healthiness × system interaction utilising dependent variable 1 (DV1; mean healthiness ratings). F
1(5·9,3989·5) = 7·17, P≤ 0·001,
$$\eta _{p}^{2} $$
= 0·010. Within the different healthiness variant groups, the following statistically significant differences were observed. High health variant: basic label (BL) v. health logo (HL) (P≤ 0·001), guideline daily amounts (GDA) v. HL (P =0·014). Medium health variant: BL v. traffic lights (TL) (P =0·013), BL v. HL (P =0·005), BL v. GDA+TL hybrid (HYB) (P =0·023), GDA v. TL (P≤ 0·001), GDA v. HYB (P =0·004), TL v. HL (P≤ 0·001), HL v. HYB (P≤ 0·001). Low health variant: BL v. HYB (P =0·013).
The significant effect observed for the food category (Food) demonstrates that participants' ratings did differ between the three food categories, with pizza being rated as least healthy, followed by yogurts and then biscuits (Table 3). The significant two-way interaction food × healthiness demonstrates that this effect varied across the levels of healthiness (Fig. 4). The significant two-way interaction food × FOP and the significant three-way interaction food × FOP × system demonstrate that participants' ratings were differentially impacted across the food categories by the application of the FOP systems and that the different FOP systems had a differential impact across the food categories as compared to the BL ratings. This observed effect varied across countries, as is demonstrated by the interaction food × FOP × system × country, although for all three interactions, the effect sizes were again quite small.

Fig. 4 Food × healthiness interaction utilising dependent variable 1 (DV1; mean healthiness ratings). F
1(3·7,7542·3) = 1308·30, P≤ 0·001,
$$\eta _{p}^{2} $$
= 0·050.
Utilising error scores (DV2) as the dependent variable
Utilising the error scores as the DV in the same analytical approach as that in the previous section revealed further insight into how participants rated the various foods at the differing levels of healthiness. Results are shown in Table 4 for those cases where they differed from DV1. Of the within-subject factors, by far the largest effect was seen for the food categories (Food), which indicates that the distance of participants' ratings from the objective scores, i.e. error scores, for each food varied across the different food categories regardless of which label format they were shown. In addition, when utilising DV2, a larger effect size was observed in the two-way interaction food × healthiness than that which was observed for DV1. This demonstrates that the degree of healthiness of the foods influenced the distance of participants' ratings from the objective score (Fig. 5), with the healthiness ratings for the low-health variant in each category being further from the objective score than those for the high-health variant, although the extent of this differed across the food categories (Table 3). Overall, participants tended to underestimate the healthiness of the pizzas and yogurts and overestimate the healthiness of the biscuits with their subjective healthiness ratings. However, further exploration of the three-way interaction food × FOP × system demonstrated that when the FOP label systems were present, the overestimation of the healthiness of the biscuits and the underestimation of the healthiness of the pizzas and yogurts appeared to be slightly reduced, which is a promising outcome (Fig. 6).

Fig. 5 Food × healthiness interaction utilising dependent variable 2 (DV2; mean error scores). F
1(3·7,7542·3) = 106·54, P≤ 0·001,
$$\eta _{p}^{2} $$
= 0·391.

Fig. 6 Food × front-of-pack × system interaction utilising dependent variable 2 (DV2; mean error scores). F
1(6,4047·3) = 16·20, P≤ 0·001,
$$\eta _{p}^{2} $$
= 0·023. BL, basic label; GDA, guideline daily amounts; TL, traffic lights; HL, health logo; HYB, guideline daily amounts+traffic lights hybrid.
Discussion
The present results suggest that although the FOP label systems we tested did result in some small improvements to subjective understanding across different foods, portion sizes and levels of healthiness, there was little difference observed between these label systems and the provision of an FOP label containing basic numerical nutritional information alone and little difference between the various systems under these conditions. Therefore, our hypothesis that one of the FOP label systems would outperform the BL did not hold. In the study, participants were clearly able to differentiate between the high health, middle health and low health variants within each of the food categories in their ratings with both the BL and any of the test FOP labels. Therefore, we must conclude that any structured and legible presentation of key nutrient and energy information as an FOP label is sufficient to enable consumers to detect the healthier alternative within a food category should they wish to do so or perhaps are forced to do so within an experimental environment. However, it should be noted that within the present study, participants made decisions about healthiness between the foods within one FOP labelling system; the presence of multiple FOP label systems in the marketplace would make the task of comparing foods more difficult in real-life situations. The present results are in line with previous research( Reference Grunert, Wills and Fernández-Celemin 19 , Reference Malam, Clegg and Kirwan 20 ), which found that the vast majority of people can successfully identify healthier products using any of the prominent labelling formats; however, the novel aspect of the present research is its direct systematic comparison of the FOP label systems using the same food categories with foods at differing levels of health across different countries and its comparison of these to the provision of numerical nutrition information alone on the FOP label.
Although we only tested three food categories in the present study, it is clear from the results that people do rate different food categories differently, and the tendency of the participants to underestimate the healthiness of pizza and yogurt and to overestimate the healthiness of biscuits in their subjective healthiness ratings could be further explored in future studies that utilise different food categories.
When considering the implications of the present results on future FOP labelling policy, one must bear in mind that although basic nutritional information alone might be sufficient to enable consumers to detect the healthier alternative from a limited choice set when they are specifically asked to do so under experimental conditions, most consumers clearly do not have the motivation or the time to process nutritional information when they are shopping( Reference Gerrior 21 , Reference Van Herpen and Van Trijp 22 ). In the real world, the additional elements of TL colour, GDA or the presence of an HL may have a greater impact on engaging consumers with the nutritional implications of their food. Future research should therefore focus on a given FOP labelling system's potential to engage consumers' attention and effect behavioural change in real-world shopping environments. Overall, there is a lack of supporting evidence to suggest that the provision of FOP labels leads to better food choices in real-world situations. Although the ability of an FOP label to gain consumers' attention has been identified as a key bottleneck for healthier food choices made at the point of purchase, and recent research in a store environment demonstrated that consistency in FOP label presentation (i.e. consistent position on pack and full penetration) can increase visual attention to the FOP label( Reference Königstorfer and Gröppel-Klein 23 ), even this did not translate into healthier food purchases in the whole sample. A study in the Netherlands concluded that in a cafeteria environment, an HL scheme did not result in a significant increase in the sales healthier lunchtime foods( Reference Vyth, Steenhuis and Heymans 24 ), and a more recent study into purchase data from a large UK retailer found that the introduction of GDA labels did not increase the sales of healthier products( Reference Boztuğ, Juhl and Elshiewy 25 ). A UK study on the introduction of TL labelling( Reference Hawley, Roberto and Bragg 26 ) showed no impact on the healthiness of food purchases in the first 4 weeks after the TL labelling was introduced, although that study outcome may have been limited by its small range of food categories and the short time frame of the study. Another study in Poland showed that TL labelling is only effective when it is combined with HL (v. TL labelling only). However, no differences were found when compared to a BL condition( Reference Koenigstorfer, Wąsowicz-Kiryło and Styśko-Kunkowska 27 ).
In contrast to these findings, a significant effect in achieving healthier purchases was observed when an intervention in a hospital cafeteria introduced an overall product-level TL labelling scheme. However, in that study, the label introduction was supported by signage at the point of purchase and a dietitian who was on hand to answer customers' labelling queries during the first 2 weeks of the study period. The effect was then further enhanced by a second phase which involved manipulation of the architecture at the point of sale by placing healthier, ‘green’-labelled products at eye level( Reference Thorndike, Sonnenberg and Riis 28 ). This environmental manipulation approach, or ‘nudging’( Reference Marteau, Ogilvie and Roland 29 ), was also shown to be effective for increasing healthier food choices in another recent study which investigated the effect of nutrition label format and product assortment on the healthiness of food choices. However, in that study, as in the present study, no significant effects were found with regards to the different FOP labelling systems( Reference Aschemann-Witzel, Grunert and van Trijp 30 ).
Perhaps with hindsight policymakers and the health community in general have been somewhat naive to expect that simply providing nutritional information in the form of FOP labelling alone would result in healthier food choices. In their review, Weil et al. ( Reference Weil, Fung and Graham 1 ) concluded that ‘transparency policies are effective only when the information they produce becomes “embedded” in the everyday decision-making routines of information users’ (p. 1). In real-life settings, personal factors and context must also be considered( Reference Barker, Lawrence and Robinson 31 ), and these often take precedence over health considerations in driving choice. In other detrimental health behaviour arenas, such as smoking or alcohol consumption, experience has shown that changing behaviour is difficult to achieve and often requires intensive interventions that incorporate essential conditions, such as capability, opportunity and motivation( Reference Michie, van Stralen and West 32 ). If we are to achieve one single, effective FOP labelling system, future research should perhaps focus on developing a greater understanding of the psychological and contextual factors which impact the motivation and opportunity for people to use the various FOP labels in real-world shopping settings. In addition, the differential potential of the various predominant FOP systems to result in healthier product reformulation should not be ignored. This will assist with the identification of the optimal FOP system and enable the development of an intervention that achieves a desired outcome in which consumers are motivated to use FOP labels to aid them in making healthier decisions when they shop. In summary, although FOP labels have the potential to facilitate healthier choices, in reality they can only do so when the motivation and intention to shop more healthily has been established.
Conclusions
Under experimental conditions, any structured and legible presentation of key nutrient and energy information on the front of the pack is sufficient to enable consumers to detect a healthier alternative within a food category when they are provided with foods that have distinctly different levels of healthiness.
Supplementary material
To view supplementary material for the present article, please visit http://dx.doi.org/10.1017/S0007114515000264
Acknowledgements
The present research was supported by the Seventh European Union Framework Programme Small Collaborative Project FLABEL (contract no. 211905). The European Commission had no role in the experimental design, analysis or writing of the present paper. The content of the paper reflects only the views of the authors; the European Commission is not liable for any use that may be made of the information contained in the paper.
The authors' contributions are as follows: C. E. H., M. M. R., M. P., K. G. G., R. S., G. W., M. S.-K., A. G.-K., J. K., Y. G. and Y. K. contributed to the design of the study; C. E. H. conducted the statistical analysis with input from M. M. R., C. F.-S. and K. G. G.; C. E. H. wrote the manuscript. All authors reviewed, edited and approved the final manuscript.
M. M. R. and C. E. H.'s research centre provided consultancy to, and received travel funds to present research results from, organisations supported by food and drink companies. The other authors do not have any conflicts of interest to declare.