


The prevalence of type 2 diabetes mellitus (T2DM) is rising rapidly globally and is considered a public health problem( Reference Shaw, Sicree and Zimmet 1 ). The developing countries are expected to be more affected by the problem, with the Africa region predicted to have the largest proportional increase in the number of adults with T2DM by 2030( Reference Whiting, Guariguata and Weil 2 ). In South Africa T2DM is a significant health and economic burden( Reference Bradshaw, Norman and Pieterse 3 ). A prevalence of 6·5 % was reported for South Africa in 2011 in the Diabetes Atlas (5th edition)( 4 ) and levels of 8·5–8·8 % reported for a population in a rural resource-limited area( Reference Alberts, Urdal and Steyn 5 ).
Individuals of low socio-economic status are among the groups noted as experiencing worse long-term diabetes management outcomes( Reference Roper, Bilous and Kelly 6 – Reference Rotchford and Rotchford 8 ). This problem is attributed to more socio-economic barriers to self-care, including limited access to continuous quality care( Reference Eakin, Bull and Glasgow 9 ). Barriers to self-care may be particularly apparent for dietary self-care( Reference Cox, Carpenter and Bruce 10 ), an area cited as among the most difficult of diabetes self-care areas( Reference Glasgow, Hampson and Strycker 11 ). Poor dietary adherence is a recognised problem in people with T2DM( Reference Yannakoulia 12 – Reference Nthangeni, Steyn and Alberts 14 ). The barriers associated with the problem are also well documented in the literature( Reference Yannakoulia 12 , Reference Nthangeni, Steyn and Alberts 14 , Reference Vijan, Stuart and Fitzgerald 15 ), even for individuals in a resource-limited setting in South Africa( Reference Nthangeni, Steyn and Alberts 14 ). Therefore, people from resource-limited settings who are living with diabetes are an important target group for interventions – particularly dietary interventions.
Diabetes self-management education (DSME) empowers the person with diabetes with the knowledge, skills and motivation that are needed to perform appropriate self-care( Reference Funnell, Brown and Childs 16 ). DSME has been shown to be effective in improving knowledge, self-care behaviours, glycaemic control and other health outcomes( Reference Clark 17 , Reference Norris, Engelgau and Narayan 18 ). Medical nutrition therapy (MNT) is an integral component of DSME( 19 ). MNT, both as an independent variable and in combination with other components of DSME, has been shown to be effective in improving health outcomes in individuals with diabetes( Reference Pastors, Warshaw and Daly 20 ). However, despite the established role of MNT in enhancing diabetes control, its contribution to diabetes management in Africa, including South Africa, is not well established. There is a paucity of data on structured nutrition education (NE) programmes and their effects on dietary and health outcomes in individuals with diabetes. Education that addresses the needs, abilities and interests of participants is considered effective in improving health and related outcomes( Reference Clark, Hampson and Avery 21 , Reference Shafer, Gillespie and Lynn Wilkins 22 ).
The purpose of the present study was to implement an NE programme that was planned based on assessed needs and to evaluate its effect on glycated Hb (HbA1c), BMI, blood pressure, blood lipids and dietary behaviours of adults with T2DM in a resource-limited setting.
Methods
Study setting
The study was conducted in two community health centres (CHC) in Moretele sub-district, North West Province, South Africa. The CHC are primary health-care clinics that are nurse managed. General physicians conduct consultations three times per week with referred patients. Patients with diabetes visit the clinics on a monthly basis for routine blood glucose monitoring and collection of medication. Health education at the CHC (including nutrition) is mainly the work of nursing professionals, since one dietitian serves the whole sub-district. There is no structured diabetes education offered at the CHC. Moretele sub-district is characterised by a high unemployment rate (45 %)( 23 ). The average annual household income was R35 467 (~$US 4430) in the year 2011. Approximately 30 % of adults aged 20 years and above had an education level up to grade 12 and only 5 % in the same age bracket had an educational level beyond grade 12( 23 ). The study site fits our definition of a ‘resource-limited setting’ as it has limited infrastructure (facilities and services) and lacks a highly skilled labour force such as health professional specialists. The majority of individuals from the setting have low literacy levels, low income and low material wealth.
Study design and participants
This was a 1-year randomised controlled study with two parallel groups. Study participants were men and women aged 40–70 years with T2DM and attending the two CHC. They were recruited face to face during their monthly clinic attendance while they were waiting to see a health professional. Recruitment was done over a period of 8 months from April 2010. A two-stage process was used to select the convenience sample. In the first stage, all consecutive patients who met the following criteria were selected: at least 1 year of living with diabetes; blood sugar levels of 10 mmol/l or above on two occasions in the previous 6 months; not on insulin therapy; regular attendance at the diabetic clinic; not pregnant or in full-time employment; and not planning to move from the study area during the study period. In the second stage the selected patients were screened for HbA1c and only those with levels ≥8 % were included in the final sample.
The study was conducted according to the guidelines laid down in the Declaration of Helsinki and all procedures involving human patients were approved by the Research Ethics Committee, Faculty of Health Sciences, University of Pretoria (protocol number 215/2009). Study participants gave written informed consent or verbal consent documented in the presence of a witness.
Sample size
For the primary outcome we needed to enrol at least forty participants per arm to detect a difference of 1 % in HbA1c (at 6 months) with 80 % power at the 5 % level of significance, assuming a standard deviation of 1·5 % and allowing a 10 % dropout rate. Since HbA1c measurements are not routinely done at the CHC, the standard deviation was based on our assessment of previous studies in our local context. We used the Stata® statistical software package version 11·1 to compute the sample size.
Randomisation
Participants were randomised to the intervention or control group with the use of random permuted blocks (block sizes of 2, 4 and 6) generated by a computer. Randomisation was done by participant irrespective of clinic. To allow equal chances for participants in both CHC, we alternated the clinic visits during recruitment. Randomisation was stratified on the basis of sex and age (four strata). Sealed sequentially numbered opaque envelopes per each stratum were used. Upon confirmation of a participant’s eligibility, the next envelope in sequence was opened and the treatment allocation entered on a randomisation list. Treatment allocation was done by the principal investigator.
Blinding
The health professionals serving the participants at the CHC and those involved in collection and analysis of blood specimens were masked to the treatment groups. The participants, the investigators and the fieldworker could not be blinded.
Intervention
The control group participants received education materials (pamphlet and wall/fridge poster) and continued with the usual medical care at their respective CHC. The intervention group received the same education materials and also participated in an NE programme. The NE programme consisted of three components: (i) the curriculum (eight weekly sessions, 2 to 2·5 h each; Table 1); (ii) follow-up sessions (four monthly meetings and two bi-monthly meetings each lasting 1·5 h); and (iii) vegetable gardening (demonstration of sowing/transplantation of vegetables). The NE sessions were offered in five groups of six to ten participants. The groups were formed on the basis of recruitment time; therefore the NE sessions were staggered over the study period. The first group commenced in June 2010 and the last group completed in November 2011. Participants were restricted to their clinics as they receive their medication at a particular clinic and the NE sessions were offered at participants’ respective CHC. The total NE programme contact time was 26·5 h per group for the combined weekly and monthly meetings.
Table 1 Nutrition education programme curriculum
* Achieved for one group only.
† Attendance of family members.
We (two dietitians included) developed the NE programme on the basis of previously assessed needs and preferences for NE in the target group( Reference Muchiri, Gericke and Rheeder 24 ). Briefly, the needs assessment involved adults with T2DM and the health professionals serving them at the two CHC. Qualitative methods were used to generate information on the desirable characteristics of an NE programme for patients; their dietary practices; the barriers and facilitators to their dietary adherence; and their knowledge about diabetes and its treatment. The findings revealed diabetes knowledge deficits and inappropriate dietary practices (food portion control problems, inadequate intake of vegetables and fruits, unbalanced diets). Financial constraint was found to be the major barrier while social support was found to be the major facilitator to dietary adherence. Education at the clinic, group education, involvement of family and the provision of education materials were among the recommendations for the NE programme. We endeavoured to incorporate the suggestions for the NE as well as to address some of the identified problems/barriers to dietary adherence. For example, the vegetable gardening component was a strategy to improve access to vegetables through growing one’s own vegetables with the aim of improving participants’ vegetable consumption. The NE was developed on the underpinnings of well-established health behaviour models, namely the Social Cognitive Theory( Reference Baranowski, Perry and Parcel 25 ), the Health Belief Model( Reference Baranowski, Cullen and Nicklas 26 ) and the Knowledge Attitude Behaviour( Reference Baranowski, Cullen and Nicklas 26 ) model. Figure 1 details the selected constructs of the behaviour models and their application in the study as well as the NE programme components.
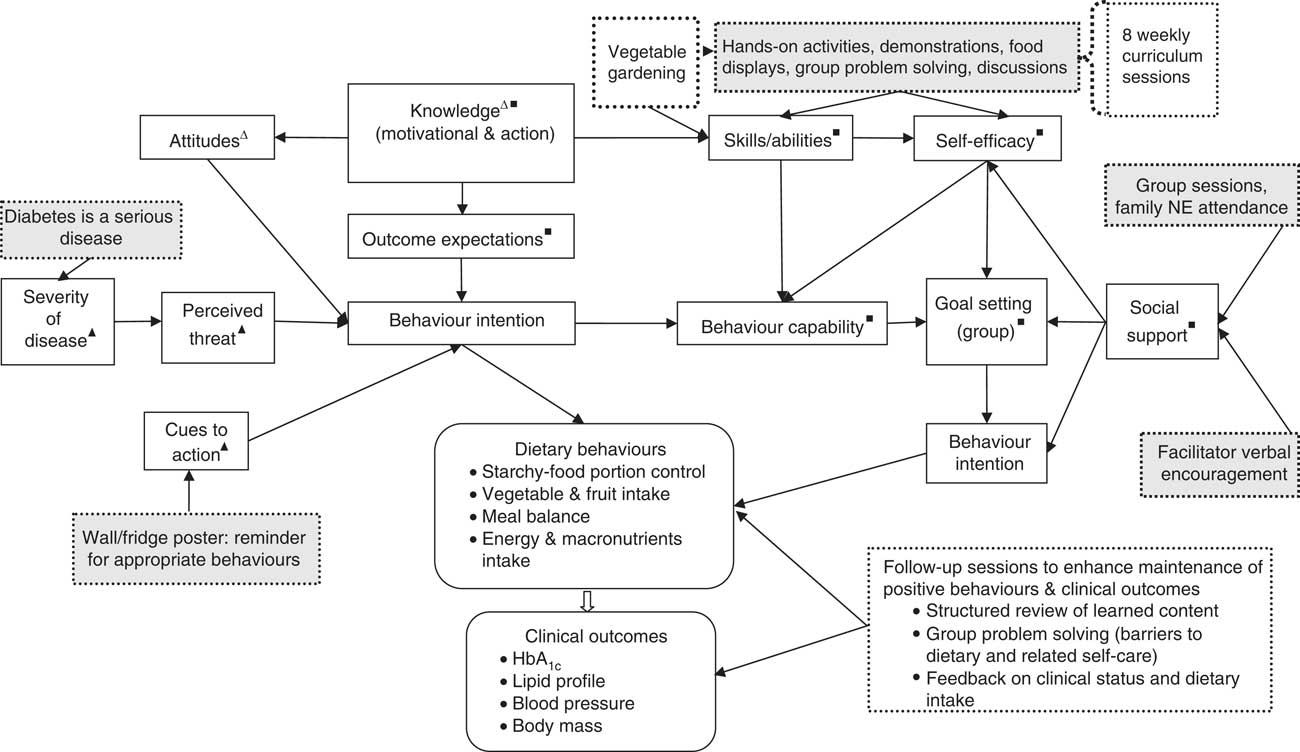
Fig. 1 Nutrition education (NE) programme components (![]() ) and selected constructs of the behaviour models (Δ, Knowledge Attitude Behaviour model; ▲, Health Belief Model; ■, Social Cognitive Theory) and their application in the study (
) and selected constructs of the behaviour models (Δ, Knowledge Attitude Behaviour model; ▲, Health Belief Model; ■, Social Cognitive Theory) and their application in the study (![]() )
)
The overall goal of the NE programme was to improve glycaemic control (HbA1c) and other clinical outcomes (BMI, blood lipids, blood pressure) through improved dietary behaviours (dietary intake including portions of starchy foods) and behaviour-mediating factors (knowledge, beliefs and attitudes, self-efficacy and goal setting). The behaviour-mediating factors (knowledge and attitudes) are reported elsewhere (JW Muchiri, GJ Gericke and P Rheeder, unpublished results), while the rest (self-efficacy and goal setting) were not measured. Although all aspects of diet for people with diabetes were addressed, the main behaviours focused on were reducing intake of starchy foods (aiming at 6–11 servings/d), increasing the consumption of vegetables and fruits (4–5 servings/d) and improving meal balance as reflected by intakes of macronutrients within the acceptable macronutrient distribution range (AMDR); i.e. carbohydrate 45–65 %, protein 10–35 % and fat 20–35 %( 27 ).
The NE programme curriculum covered content on diabetes pathophysiology, risk factors, symptoms, complications, treatment goals and modalities, and dietary principles, which included food groups and meal balance, portion control and planning meals on a limited budget (Table 1). The Zakhe diabetes education flip chart (adapted with modification)( Reference Gill, Price and Shandu 28 ) and the South African food-based dietary guidelines flip chart( 29 ) were used to teach the content on diabetes and the dietary guidelines, respectively. The facilitation of the programme was done as follows: the sub-district dietitian (25 % of weekly sessions); a final-year nutrition and food science university student from the study site (65 % of weekly and 90 % of follow-up sessions); the principal investigator, an experienced dietitian (10 % of weekly and follow-up sessions); and the sub-district horticulture officer (vegetable gardening demonstration). The local language was used in the majority of the sessions (90 %). The rest were offered in English by the principal investigator with local language translations carried out. The sub-district dietitian and the student (appointed fieldworker) had been trained by the principal investigator to deliver the sessions and a training manual was used during the sessions.
To prevent/minimise contamination between the intervention and control groups, patients were asked not to share information with other patients( Reference Keogh-Brown, Bachmann and Shepstone 30 ). Outcome assessments were carried out on different days for each of the groups and the NE sessions were conducted in different CHC blocks from where patient consultations were done.
Outcomes
The primary outcome was the change in HbA1c at 6 months. The secondary outcomes were changes in other clinical outcomes (BMI, blood pressure and blood lipids), HbA1c and dietary behaviours at 12 months.
Hypothesis
We hypothesised that an NE programme customised to the expressed needs and preferences for NE would induce significant improvements in the investigated outcomes in the intervention group at 6 months and that these improvements would be sustained at 12 months.
Clinical outcomes
Non-fasting venous blood samples were analysed for HbA1c and full lipid profile (total cholesterol, LDL-cholesterol, HDL-cholesterol and TAG) at the Steve Biko Academic Hospital Core laboratory of the National Health Laboratory Services (Pretoria). SYNCHRON LX® in conjunction with Unicel® DxC 600/800 system(s) (Beckman Coulter, Fullerton, CA, USA) were used for the analysis. The HbA1c results are traceable to those of the International Federation of Clinical Chemistry (IFCC) calibrators.
Weight and height were measured using standard techniques with participants barefooted and in light clothing( Reference Lee and Nieman 31 ). Weight was determined to the nearest 0·1 kg using a calibrated electronic scale (Seca 208). Height was measured to the nearest 0·1 cm using a portable stadiometer (Seca 214). Two measurements each of the weight and height were taken and the average of each used for calculations. BMI (kg/m2) was calculated by dividing the participant’s average body weight by the square of his/her average height. Blood pressure was measured according to standard guidelines( Reference Atkinson and Veriava 32 ) using a digital pressure monitor (Omron 705CP). Two measurements were taken and in cases where there was a difference of more than 5 mmHg between the readings, one or two more measurements were taken. The mean of the two closest measurements was used to determine mean blood pressure.
Data on medication prescribed for the treatment of diabetes were collected at baseline and reviewed during each of the post-intervention outcome assessments. A medication increase was defined as an increase in the dose or number of oral glucose-lowering agents. A medication decrease was defined as a reduction in the number or quantity of the oral agents.
Dietary outcomes
Three face-to-face 24 h dietary recalls (two weekdays and one weekend day) on non-consecutive days assessed dietary intake. Bean bag mounds( 33 ) fruit models and standardised commonly used household measures (cups, glasses, spoons, bowls, spoons, etc.) were used to assist participants in estimating consumed food/fluids portions. The South Africa Medical Research Council FoodFinder3® diet analysis software was used to analyse the 24 h diet recalls. Data on growing one’s own vegetables (yes/no) and how the participants used the vegetables were also collected.
Statistical analysis
Stata® version 12·1 was used for all statistical analyses. We analysed the data according to an intention-to-treat analysis using the last observation carried forward( Reference Hollis and Campbell 34 ). We used ANCOVA to compare the intervention group and control group on the measured outcomes post-intervention, using the baseline values, age, sex and clinic as covariates. Rank ANCOVA( Reference Koch, Carr and Amara 35 ) was used for dietary intake as the majority of the data were skewed. TAG values were normalised through logarithmic transformation( Reference Bland and Altman 36 ). The level of significance for all tests was set at α<0·05 for a two-tailed test.
Results
Participants
Figure 2 shows the flow of participants through the study. Out of eighty-two (eleven males) participants who were randomised, seventy-six (92·7 %; eleven males) completed the study. The mean age of participants at baseline was 58·8 (sd 7·7) years. Table 2 shows the participants’ sociodemographic characteristics and diabetes medication use for the intervention and control groups at baseline. All participants were black Africans. The majority in both groups were unemployed (>80 %) with a high proportion depending on a pension (>45 %) or on other forms of grants (>14 %) for their livelihood. More participants in each group, 43·9 % and 39·0 % for the intervention group and control group, respectively, had 7–9 years of schooling. All participants were on oral hypoglycaemic agents, with the majority in both groups (>70 %) being on a combination of biguanides and sulfonylureas.
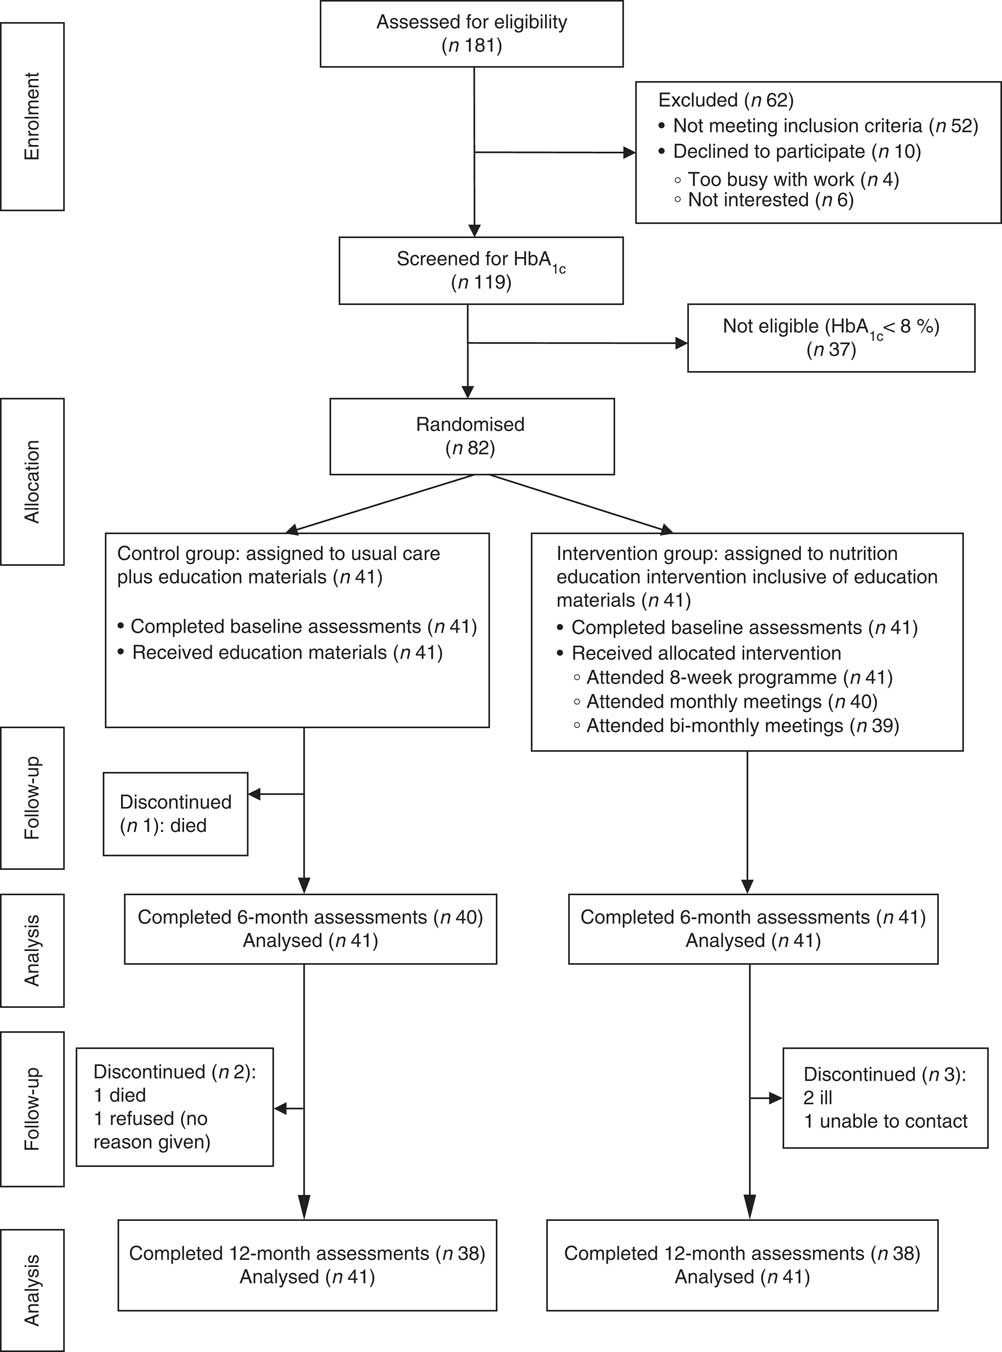
Fig. 2 Flow of participants through the study
Table 2 Demographic characteristics and diabetes medication at baseline: comparisons between the intervention and control groups of adults aged 40–70 years with type 2 diabetes mellitus, Moretele sub-district (North West Province), South Africa, April 2010–November 2011
* Data presented are mean and standard deviation.
† Data presented are median and interquartile range (IQR).
‡ Data presented are number and percentage.
Programme session attendance
Thirty-three (80·5 %) intervention-group participants attended six or more sessions of the eight weekly meetings, of whom sixteen (39·0 %) attended all the meetings. The average attendance at monthly and bi-monthly follow-up meetings was more than 80 %.
Diabetes medication changes
At 6 months, three (7·3 %) intervention-group participants decreased their diabetes medication while one (2·5 %) control-group participant increased his medication (P=0·26). At 12 months, three (7·9 %) v. seven (18·4 %) intervention- and control-group participants, respectively, increased their diabetes medication. One (2·6 %) control-group participant decreased her medication (P=0·11).
Clinical outcomes
Table 3 shows the mean baseline data and the baseline-, age-, sex- and clinic-adjusted 6- and 12-month clinical outcomes. There were no significant group differences in the clinical variables at baseline. Post-intervention, mean difference between the intervention and control groups for HbA1c was −0·64 % (95 % CI −0·19, 1·50 %; P=0·13) at 6 months and −0·63 % (95 % CI 0·26, 1·50 %; P=0·16) at 12 months. Few participants achieved the targets for HbA1c (<7 %): four (9·8 %) v. one (2·4 %; P=0·20) at 6 months and five (12·2 %) v. one (2·4 %; P=0·20) at 12 months for the intervention and control groups, respectively (data not shown).
Table 3 Clinical outcomes: differences at baseline and at 6 months and 12 months (adjusted) between the intervention and control groups of adults aged 40–70 years with type 2 diabetes mellitus, Moretele sub-district (North West Province), South Africa, April 2010–November 2011
HbA1c, glycated Hb.
* Based on Student’s t test.
† Adjusted for age, sex, clinic and baseline measurements.
‡ Based on log-transformed variable.
§ Data presented are geometric mean and 95 % confidence interval.
|| Ratio of the means.
There were no significant between-group differences for mean BMI, mean total cholesterol, mean LDL-cholesterol, mean HDL-cholesterol and mean TAG at 6 and 12 months, although the parameters tended to be higher in the control group. Systolic and diastolic blood pressures were not significantly different between the groups at 6 months and 12 months, but tended to be lower in the control group at 6 months. Adjustment showed high baseline values to influence all clinical outcomes (P<0·001) at both 6 and 12 months, HbA1c at 6 months to be influenced by age −0·06% (P=0·032) and female sex +1·56% (P=0·013), and clinic to influence BMI at 12 months −0·82kg/m2 (P=0·027; clinic 2).
With regard to the effects of non-adjustment and minimum adjustment (baseline only) models on clinical outcomes (data not shown), only HbA1c was significantly higher in the control group for the non-adjusted model at both 6 months, +1·11 % (95 % CI 0·05, 2·10 %; P=0·04), and 12 months, +1·03 % (95 % CI 0·01, 2·60 %; P=0·048). With the minimum adjustment model, only TAG was significantly higher in the control group (P=0·001) and (P=0·024) at 6 and 12 months, respectively.
Dietary outcomes
Table 4 presents the baseline data, 6-month and 12-month dietary outcomes (values are unadjusted medians; P value is for outcome adjusted for baseline, age, sex and clinic). The dietary variables were similar at baseline, apart from the median percentage of energy from total fat and polyunsaturated fat, which were significantly higher in the control group. Post-intervention, both the intervention and control groups reduced their intake of starchy foods (number of servings). The intervention group had a greater reduction and significantly lower median intake compared with the control group at 6 months (9·3 v. 10·8 servings/d, P=0·003) and at 12 months (9·7 v. 11·8 servings/d, P=0·01). The intervention group had a significantly lower median energy intake at 12 months (5988 v. 6946 kJ/d, P=0·017) compared with the control group. There were no significant group differences in the intake of energy from macronutrients and all fatty acids at 6 and 12 months. However, the intervention group had a higher and close to significant intake of energy from protein at 6 months. Absolute macronutrient intakes (g/d) were significantly lower for carbohydrate in the intervention group at 12 months (P=0·04) and significantly higher for protein for the control group at 12 months (P=0·032). There were no significant group differences in the intakes of vegetables and fruits and fibre at 6 and 12 months.
Table 4 Dietary outcomes: differences at baseline and at 6 months and 12 months (adjusted) between the intervention and control groups of adults aged 40–70 years with type 2 diabetes mellitus, Moretele sub-district (North West Province), South Africa, April 2010–November 2011

Data presented are median and interquartile range (IQR) unless otherwise stated.
* Based on Mann–Whitney test.
† Based on rank ANCOVA; adjusted for age, sex, clinic and baseline values.
‡ 1 serving=1 standard ½ cup.
With respect to effects of minimum adjustment (baseline only) and non-adjustment (data not shown), the non-adjusted model showed significant results for only intakes of starchy foods (P=0·031) and protein (P=0·021) at 6 months. The baseline-adjusted model showed significant effects for protein (P=0·045) at 6 months and starchy foods at both 6 months (P=0·003) and 12 months (P=0·009).
Discussion
In the present study we hypothesised that an NE programme customised to the expressed needs and preferences for NE would lead to significantly better outcomes in the intervention group at 6 months and that the improved outcomes would be sustained at 12 months. The results do not support this hypothesis for HbA1c and the other clinical outcomes. HbA1c levels were lower in the intervention group but not significantly lower than in the control group. Non-significant changes in HbA1c results have been reported in other dietary interventions offered in group format( Reference Yannakoulia, Poulia and Mylona 37 , Reference Anderson-Loftin, Barnett and Bunn 38 ). Other group-based interventions, notably those offered by registered dietitians (RD)( Reference Miller, Edwards and Kissling 39 – Reference Shabbidar, Fathi and Shirazifard 41 ) or with a dietitian as a member of a multidisciplinary team, have reported significant improvements in HbA1c ( Reference Wolf, Conaway and Crowther 42 ). In our study, the majority of the sessions were facilitated by a final-year university student not fully qualified in the field of nutrition or dietetics. The reason for using this person was that the sub-district dietitian was not fully available because of other work demands. The investigators were not conversant with the local language and the NE was planned to be culturally appropriate. The facilitation of the NE by the student, and not an RD, might have impacted on its delivery, even though every effort was made to ensure delivery as intended. Given the complexity of nutrition issues and behaviour change( Reference Nestle, Wing and Birch 43 ), it could be that the role of a dietitian, the professional considered most suitable to provide diabetes nutrition therapy( Reference Evert, Boucher and Cypress 44 ), would be crucial in this study population, who indicated they had not previously participated in any diabetes-specific education. NE offered by an RD or where the RD is part of a team has been shown to significantly improve glycaemic control( Reference Wilson, Brown and Acton 45 ). There are limited data on studies that have used students in dietary interventions for people with diabetes. In one study where nutrition students (master’s level) were used, significant improvement in HbA1c was observed( Reference Goldhaber-Fiebert, Goldhaber-Fiebert and Tristán 46 ).
Factors that may have contributed to the improvements in HbA1C in the control group and hence diluted the NE effects on HbA1c include: the two-stage recruitment process that made participants aware that inclusion in the final sample would be based on higher values of HbA1c (after screening); the participants’ awareness that they were being studied (the so-called ‘Hawthorn effect’); and the feedback given on their laboratory results (since the participants wanted this information). These factors could have motivated them to make behaviour changes. In addition, an increase in glucose-lowering medication (dosage and number), although non-significant, was higher in the control group.
Overall, the NE reduced HbA1c levels by 0·64 % at 6 months and 0·63 % at 12 months. This reduction is comparable with Deakin et al.’s study that reported a significant reduction of 0·6 % at 14 months in the intervention group( Reference Deakin, Cade and Williams 40 ). The magnitude of reduction is higher than that reported by Coppell et al. of 0·4 % in a study that achieved significant group differences in patients on optimal drug treatment( Reference Coppell, Kataoka and Williams 47 ). The reduction is also higher than the net reduction of 0·26 % (95 % CI −0·05, −0·48 %) expected for DSME of duration of four or more months in the meta-analysis by Norris et al.( Reference Norris, Lau and Smith 48 ). The reduction in HbA1c levels in our study was, however, lower than that reported for MNT (0·9 %) offered by RD in individuals with T2DM with an average duration of 4 years( Reference Pastors, Franz and Warshaw 49 ). Although the reduction in HbA1c was not statistically significant, it may be of clinical importance in reducing the risk of diabetes-related complications. According to the United Kingdom Prospective Diabetes Study (UKPDS)( Reference Stratton, Adler and Neil 50 ), a 1 % decrease in HbA1c resulted in a reduction of 37 % for microvascular complications and 21 % for deaths related to diabetes. If risk reduction is proportional to HbA1c reduction, then based on the UKPDS, the present study would reduce the risk for microvascular complications by 25 % and deaths by 14 %. In addition, a reduction of at least 0·5 % in HbA1c in 6 months is considered a beneficial metabolic response( 51 ).
The limited improvements in BMI have been reported in some other studies( Reference Deakin, Cade and Williams 40 , Reference Huang, Hsu and Wang 52 ), further confirming the problem with losing weight in people with T2DM as reported in the meta-analysis by Norris et al.( Reference Norris, Zhang and Avenell 53 ). A positive finding in our study was that lower than the baseline levels of BMI were achieved in the intervention group at the end of the study while in the control group they tended to increase. The lack of significant improvement in BMI despite a reduction in energy intake could in part be due to under-reporting of food intake that is common with obese T2DM individuals( Reference Sallé, Ryan and Ritz 54 ) and those of low socio-economic status( Reference Olendziki, Ma and Hebert 55 ) and/or improvements in glycaemia accompanied with the resolution in glycosuria( Reference Ma, Olendziki and Merrima 56 ) as participants had poorly controlled diabetes.
Non-significant improvements in the full lipid profile have been reported in other studies( Reference Shabbidar, Fathi and Shirazifard 41 , Reference Huang, Hsu and Wang 52 ), even in low-income and underserved settings( Reference Anderson-Loftin, Barnett and Bunn 38 , Reference Brown, Garcia and Kouzekanani 57 ) and studies involving diet and physical activity with weight loss as the primary outcome( Reference Wolf, Conaway and Crowther 42 , Reference Mayer-Davis, D’Antonio and Smith 58 ). Despite the non-significant improvements in the lipid profile our study showed some positive effects. First, the mean total cholesterol and TAG levels were within the recommendations of the Society of Endocrinology, Metabolism and Diabetes of South Africa of <4·5 mmol/l and <1·5 mmol/l, respectively( Reference Amod, Motala and Levitt 59 ), at 6 months for the intervention group. Second, total cholesterol, LDL-cholesterol and TAG tended to be lower in the intervention group at the two time periods – a finding also observed by Anderson-Lofting et al. ( Reference Anderson-Loftin, Barnett and Bunn 38 ). The non-significant improvements in blood pressure may be explained by the limited improvements in BMI.
The NE programme significantly reduced the intake of energy at 12 months and servings of starchy foods at 6 and 12 months. The significant reduction of starchy-food intake in the intervention group is likely to have occurred for the following reasons. First, the importance of controlling the amounts of food consumed, especially starchy foods, was emphasised. Second, guidelines for portioning various food groups in a meal were provided, with the use of simple visual approaches, namely the plate model( Reference Camelon, Hådell and Jämsen 60 ) and the Zimbabwe hand jive( 61 ). In addition flip charts, demonstrations and displays of sample meals using culturally appropriate foods were used. Finally, participants had a chance to practise the portioning of foods with the use of the guidelines. No published studies assessing starchy-food intake (servings) in people with diabetes were found.
The levels of energy decline in the intervention group are comparable to those reported by Huang et al.( Reference Huang, Hsu and Wang 52 ). The greater decline in the intervention group appears to have been affected by the greater reduction in starchy-food intake (servings), as the percentage of energy from fats and protein changed only slightly during the study. The reasons for the non-significant changes in the percentage of energy from fat and fatty acids could be a result of the fact that even at baseline the intakes were far below the recommendations, implying that it would be more difficult to reduce the levels.
Percentage intake of energy from carbohydrate at baseline and post-intervention in both groups was above the guideline of 45–65 %( Reference Bantle, Wylie-Rosett and Albright 62 ) used in the present study (not prescribed). The levels (>65 %) would be classified as ‘high carbohydrate’ according to Wheeler et al.( Reference Wheeler, Dunbar and Jaacks 63 ). Wheeler et al.’s( Reference Wheeler, Dunbar and Jaacks 63 ) review indicated a non-unanimous agreement on the percentage of energy from carbohydrates shown to confer optimal glycaemic control due to conflict in results for various levels of carbohydrate in the reviewed studies. Therefore, it cannot be concluded that the high carbohydrate intake in our study contributed to the non-significant changes in glycaemic control. The high carbohydrate intake among people with T2DM seems to be typical in black communities in resource-limited settings in South Africa( Reference Nthangeni, Steyn and Alberts 14 ). This observation could be explained by the fact that carbohydrate-rich foods are often cheaper( 64 ).
Post-intervention fibre intakes were close to the baseline levels and they did not meet the study guidelines (25 g/d). The intakes were similar to those reported in people with T2DM in South Africa( Reference Nthangeni, Steyn and Alberts 14 ). The non-significant results in vegetable and fruit intake are in agreement with findings from a study by Yannakoulia et al.( Reference Yannakoulia, Poulia and Mylona 37 ). The limited improvement in vegetable and fruit intake in our study, despite the reported increase in the number of intervention participants growing their own vegetables (17/41 v. 5/41, P=0·003, at 6 and 12 months) and mainly using them for home consumption (data not shown), is an unexpected result that warrants further investigation.
In regard to the goal of enhancing meal balance based on the AMDR, there were no significant group differences from baseline to post-intervention. Carbohydrate intakes were higher than the AMDR throughout the study for both groups, despite the decrease in absolute amounts. The proportion of energy contributed by protein was within the AMDR and improved slightly through the study although the absolute amounts generally decreased. Fat contribution to energy was much lower than the AMDR. While under-reporting of dietary intake cannot be ruled out( Reference Sallé, Ryan and Ritz 54 ), the pattern of macronutrient contributions to energy in the present study is similar to that observed in the South African study( Reference Nthangeni, Steyn and Alberts 14 ).
The following factors could likely have contributed to the non-significant improvements in vegetable and fruit intake and meal balance. A lack of participation in personal goal setting by the intervention group members was observed. This problem could be related to the low literacy levels of the study participants. The absence of personalised goal setting might have interfered with the commitment to attaining the group goals. The participants may also not have improved their self-efficacy for these two dietary behaviours. Self-efficacy was not, however, measured in the study. Goal setting( Reference Shilts, Horowitz and Townsend 65 ) and self-efficacy( Reference Mishali, Omer and Heymann 66 ) have been shown to facilitate dietary and related behaviour changes and even to influence glycaemic control in individuals with diabetes( Reference Nyunt, Howteerakul and Suwannapong 67 ).
Several aspects of the present study contributed to its strength. These include the randomised study design, the low attrition rates and the monitoring of the changes in glucose-lowering medication. The 12-month study period was long enough to observe changes in the measured outcomes and their subsequent stability beyond 6 months. Other strengths included the tailoring of the NE to participants’ expressed needs and preferences. The use of facilitators from the study setting in the majority of the sessions was an additional strength as they had the same cultural orientation as the participants. The study also had limitations. The study power was lower than initially planned as a result of a higher standard deviation than anticipated (sd=2·0 instead of 1·5), implying that a minimum of 126 participants were needed. Challenges with recruitment, however, made it difficult to obtain additional participants. The initial aim of achieving a 1 % (we based this value on previous MNT studies) difference in HbA1c was also probably over-optimistic and, with hindsight, the sample size should have been planned on a minimal clinical significant difference of 0·5 %. Sample size for the secondary outcomes was not calculated nor adjustment for the type 1 error rate done. This makes it uncertain as to whether the study was adequately powered for the secondary outcomes and hence the results on these outcomes should be viewed with this issue in mind. However, we regarded these analyses exploratory to investigate, for example, by which possible means the intervention could determine change in the primary outcome. Whereas measures were taken to prevent contamination between the participants in the intervention and control groups, such an occurrence cannot be ruled out. Information sharing between participants could have occurred during their monthly CHC attendance. However, the effect, if any, would likely not be significant. According to expert consensus, interventions focusing on behaviour are less vulnerable to contamination compared with knowledge focused ones( Reference Howe, Keogh-Brown and Miles 68 ), and in our study knowledge scores were significantly higher in the intervention group (JW Muchiri, GJ Gericke and P Rheeder, unpublished results). In addition, given the scope (intensity and duration) of the NE programme the ‘dose’ exposure on the control-group participants would be low, as the whole NE package was unlikely to be transferred( Reference Keogh-Brown, Bachmann and Shepstone 30 ).
The use of non-fasting blood samples could have influenced the accuracy of the evaluated lipids – particularly TAG, which remain elevated for several hours postprandial( Reference Nigam 69 ). However, asking participants to fast before assessments was seen as a factor that could lead to non-compliance in some participants or discourage participation. The greater number of women compared with men could limit the generalisation of the results. This scenario seems to be typical of the study population as previously observed( Reference Muchiri, Gericke and Rheeder 24 ). The occurrence is likely due to the relatively small number of males observed to attend the CHC. It could also be associated with the lower diabetes prevalence rates in males in comparison with females reported in South Africa( Reference Bradshaw, Norman and Pieterse 3 ). The facilitation of most of the NE by a student rather than an experienced dietitian could be viewed as a limitation. The non-optimal application of goal setting and self-efficacy constructs of the Social Cognitive Theory was also a limitation in the study.
Conclusions
We conclude that the NE programme did not significantly improve glycaemic control or other clinical outcomes. However, a positive trend was observed in that HbA1c, BMI, total cholesterol and LDL-cholesterol decreased more in the intervention group.
The NE programme significantly improved two dietary outcomes: reduction in the intakes of starchy foods (servings) and energy. However, it did not achieve the objective of improving vegetable and fruit intake and enhancing meal balance in the study population.
The findings from the study demonstrate that an NE programme that is customised to the participants’ needs and preferences for NE can improve specific dietary behaviours and has the potential for improving HbA1c and other clinical outcomes. Nevertheless, delivering such a programme as part of routine practice in the study setting would be a challenge due to inadequate personnel and infrastructure. Future studies should explore the use of other trained personnel such as community health workers if structured NE is to be offered routinely in resource-limited settings. In addition, in order to maximise the benefits from NE interventions for people with T2DM in resource-limited settings, such studies should optimally apply individualised goal setting and self-efficacy skills training and the assessment thereof.
Acknowledgements
Acknowledgements: The authors thank Barbara English for her assistance with language editing. Kemmone Mashishi, Keabestwe Kodi and Ronald Thobejane are also thanked for facilitating the nutrition education sessions. The support of the staff from the two community health centres and the cooperation of the patients involved in the study are greatly appreciated. Financial support: This study was supported by research grants from the South African Sugar Association (grant number 212) and Nestlé Nutrition Institute Africa. These organisations had no role in the design, analysis or writing of the article. Conflict of interest: None. Authorship: All authors contributed to the conception and design of the study. P.R. and G.J.G. supervised the study. G.J.G. provided theoretical expertise on the NE curriculum and critically revised the first draft of the manuscript. J.W.M. was involved in the implementation of the intervention and data collection, performed statistical analysis and drafted the manuscript. P.R. computed the sample size, provided the statistical expertise and contributed to the analysis. All authors contributed to the interpretation of the results. All authors read and approved the final manuscript. Ethics of human subject participation: The study was approved by the Research Ethics Committee, Faculty of Health Sciences, University of Pretoria (protocol number 215/2009).


