


Many developing countries are currently undergoing a rapid nutrition transition characterized by changes in dietary habits towards more energy-dense, processed foods and more sedentary lifestyles( Reference Pingali 1 ). A conspicuous result are rising rates of overweight and obesity with serious negative implications for people’s health( Reference Hawkes, Chopra and Friel 2 – Reference Rtveladze, Marsh and Barquera 4 ). In 2008, 34 % of all adults in the world were overweight or obese( Reference Finucane, Stevens and Cowan 5 ). While average overweight rates are still higher in most industrialized countries, many developing countries are rapidly catching up. The nutrition transition is driven by demand and supply factors( Reference Hawkes, Chopra and Friel 2 , Reference Popkin, Adair and Ng 3 , Reference Mergenthaler, Weinberger and Qaim 6 ). On the demand side, income growth, improved education and urbanization entail major changes in food demand and lower levels of physical activity. Globalization also contributes to preference shifts towards Western-style diets( Reference Popkin 7 ).
On the supply side, food systems are becoming more international, the influence of multinationals is growing, and the retail sector is modernizing and consolidating( Reference Pingali 1 , Reference Hawkes, Chopra and Friel 2 ). Supermarkets are gaining ground in developing countries( Reference Timmer 8 ). In some countries, supermarkets have spread so rapidly that the term ‘supermarket revolution’ has been coined( Reference Reardon, Timmer and Barrett 9 ). Studies show that – when entering a new market – supermarkets initially target high-income segments of the population, but later also reach out to a much wider customer base( Reference Reardon, Timmer and Berdegué 10 ). Supermarkets usually start in the larger cities, before expanding into smaller towns and rural areas( Reference Reardon and Timmer 11 ).
The retail format has an influence on the types of products offered, as well as on sales prices and shopping atmosphere, which may affect consumer food choices( Reference Timmer 8 , Reference Hawkes 12 – Reference Banwell, Dixon and Seubsman 14 ). Compared with traditional retail formats, such as wet markets, smaller shops and kiosks, supermarkets tend to have a wider variety of processed and highly processed foods and drinks, often in larger packaging sizes and combined with special promotional campaigns( Reference Pingali 1 , Reference Reardon, Timmer and Barrett 9 , Reference Reardon, Timmer and Berdegué 10 , Reference Hawkes 12 ). Hence, one important question is whether the expansion of supermarkets contributes directly to rising overweight and obesity in developing countries. Here, we address this question using observational data collected in Kenya.
Recent research has analysed effects of supermarkets in developing countries. Several studies suggest that the spread of supermarkets leads to dietary changes for urban consumers( Reference Hawkes 12 , Reference Asfaw 15 – Reference Tessier, Traissac and Maire 17 ). Most of this work shows that supermarket purchase is associated with increased consumption of energy-dense, processed foods( Reference Hawkes 12 , Reference Asfaw 15 , Reference Asfaw 16 ), although in one case supermarkets were found to increase dietary quality( Reference Tessier, Traissac and Maire 17 ). Research on the impact of supermarkets on consumer nutritional status in developing countries is rare. Studies in the USA show that access to supermarkets is nowadays often associated with lower obesity rates( Reference Drewnowski, Aggarwal and Hurvitz 18 – Reference Morland, Diez and Wing 21 ), but the situation in developing countries is different. We are aware of only one study that has looked at the impact of supermarkets on nutritional status in a developing country, namely Guatemala( Reference Asfaw 15 ). In that study it was found that food purchase in supermarkets was positively associated with the BMI of consumers. However, the research for Guatemala built on a household living standards survey that was not specifically designed for analysing the nutritional impact of supermarkets. Hence, a few variables of interest, such as food quantities purchased in different retail outlets, were not properly captured. Moreover, the impact on BMI was analysed jointly for all individuals in the sample, masking possible differences between adults and children. BMI is a suitable indicator of nutritional status only for people who have reached their final body height. For children and adolescents, it is recommended to use indicators such as BMI-for-age or height-for-age Z-scores, which set individual measures in relation to a reference population of the same age( Reference de Onis, Onyango and Borghi 22 ).
We address these shortcomings in the previous literature by using data from a survey of Kenyan consumers that was specifically designed for this purpose. We analyse effects of supermarket purchase on nutritional status separately for adults and children, using suitable indicators. Beyond these methodological improvements, it is also important to better understand the implications in different geographical contexts. Due to economic, social and cultural differences, the nutritional effects of supermarkets may also differ between Guatemala and Kenya or other countries in Africa.
Kenya has recently witnessed a rapid spread of supermarkets that now account for about 10 % of national grocery sales( 23 ). Most supermarkets in Kenya are domestically owned; the role of international chains is still limited. While large hypermarkets so far only exist in major cities of Kenya, medium-sized supermarkets have also spread to smaller towns over the last couple of years( Reference Rischke, Kimenju and Klasen 24 ). The retail share of supermarkets in Kenya is lower than in many middle-income countries, but it is already higher than in most other low-income countries in sub-Saharan Africa and Asia. Hence, trends observed in Kenya may be helpful to predict future developments in other poor regions.
Methods
We use cross-sectional data collected with a quasi-experimental survey design to compare the nutritional status of people of different age cohorts with and without supermarket purchases. As nutritional status can be influenced by many other factors, such as socio-economic status, education and physical activity levels, we control for such other factors in regression models to identify the net supermarket impact. With cross-sectional data, one needs to be careful not to overinterpret effects as causal, even when controlling for a number of possible confounding factors, because unobserved differences between supermarket buyers and non-buyers may potentially lead to biased estimates. However, such bias can be reduced when using instrumental variable (IV) econometric techniques for estimation. With valid instruments, interpretation of causal effects is possible also with cross-sectional data( Reference Imbens and Wooldridge 25 – Reference Newhouse and McClellan 27 ). We use IV techniques, details of which are described below.
Survey design
We conducted a survey of 453 households to collect observational data at household and individual levels. The survey was carried out in July and August 2012 in Central Province of Kenya. Central Province has the second highest prevalence of overweight and obesity in Kenya after Nairobi. About 35 % of the women aged 15–49 years are overweight or obese in Central Province( 28 ). We decided to sample households from small towns, some of which already have a supermarket, while others do not. This provided a quasi-experimental setting, which we exploit for our analysis. Three towns were purposively selected: (i) Ol Kalou, where a supermarket has been operating since 2002; (ii) Mwea, where a supermarket was opened in 2011; and (iii) Njabini, where no supermarket had yet been established at the time of the survey. The three towns are comparable in general characteristics, such as size of the urban catchment area and infrastructure, as well as in terms of financial and social institutions. We deliberately did not choose bigger towns and cities for the survey, because all of them already have one or more supermarket(s). Hence, it would have been impossible to identify comparable control locations without a supermarket.
Systematic random sampling was used to select households for interview within the urban and peri-urban areas of the three towns. Since recent census data did not exist, we used available population statistics and the help of local administrators. At first, all neighbourhoods (residential estates) in each town were listed. Then, household lists were compiled for each neighbourhood, from which we randomly selected the required number of households. We selected households from all neighbourhoods, in order to avoid clustering and obtain a representative sample at the town level.
A group of eight local interviewers was involved in the survey; we used the same interviewers in all three towns. Prior to data collection, the interviewers were trained thoroughly in all aspects of administering the questionnaire, including anthropometric measurements. Data on socio-economic characteristics, including food consumption and expenditure, were collected at the household level. Details on food consumption at home were collected using a 30 d recall period( Reference de Haen, Klasen and Qaim 29 ), which allowed us to also capture purchases that are undertaken by households only once per month. Each household was visited once; during these visits the respondents reported about all foods consumed by the household in the previous 30 d. Data on food consumption quantities, expenditures and place of purchase were collected in disaggregated form for 170 food items. Thus, we could also differentiate between similar products of different qualities and processing levels.
In addition to the household-level data, we collected individual-level data such as food eaten away from home as well as work- and leisure-related physical activity from household members. In each household, up to three household members were randomly selected for anthropometric measurement: one male adult, one female adult and one child or adolescent in the age range 5–19 years. Children below 5 years of age were not chosen for measurement since we hypothesized that supermarkets are more likely to influence the diets of adults and older children. Participation was voluntary. Prior to taking anthropometric measures we obtained written consent from all adults through signatures for themselves and their children. In total, we took individual data from 615 adults and 216 children and adolescents. Approval by an institutional review board was not required for the survey because it was not associated with any risk for participants.
Procedures and variable definitions
The main nutritional outcome variable for adults is BMI, defined as weight in kilograms divided by the square of height in metres. Adults with a BMI ≥25 kg/m2 are classified as overweight or obese( 30 ). For children, we use two nutritional outcome variables, namely BMI-for-age Z-score (BAZ) and height-for age Z-score (HAZ), which were calculated based on the WHO growth reference for school-aged children and adolescents( Reference de Onis, Onyango and Borghi 22 ). Childhood overweight/obesity is defined as a BMI-for-age >1 sd from the median of the reference population (BAZ >1)( 31 ). Stunting is defined as HAZ <−2, mild stunting as HAZ <−1 and severe stunting as HAZ <−3.
The exposure variable for the impact assessment is food purchase in supermarkets. We refer to supermarkets as large modern retail formats with two or more cash counters and occupying a space of at least 150 m2. As mentioned above, there is one supermarket in two of the towns and no supermarket in the third town. Compared with traditional retail outlets, these supermarkets offer more processed foods, also including cooled and frozen items. Unlike supermarkets in large cities, fresh fruits and vegetables are not yet on offer. The town supermarkets also sell various non-food items, such as clothing, electronic devices and furniture. We measure supermarket purchase in two different ways: (i) as a dummy variable that takes a value of 1 for households that purchased at least some of their food in supermarkets; and (ii) as a continuous variable measuring the share of supermarket food purchases in total household food expenditure. Households that did not buy in supermarkets (i.e. the dummy and the supermarket share are equal to 0) obtained all of their food from traditional sources.
Other factors that may influence nutritional status and for which we collected data include age, gender, education and household socio-economic status. We measure socio-economic status in terms of consumption expenditure per adult equivalent, which is a common way to capture living standards in the development economics literature( Reference Deaton 32 ). Consumption expenditure includes food expenditure derived from the 30 d recall, as well as expenditures on major categories of non-food goods and services.
Nutritional knowledge and awareness may also play a role. While we had a few questions on nutritional knowledge included in the survey, we could not use these variables in the regression models because of endogeneity issues. Hence, we decided to use a more exogenous proxy. In Kenya, district hospitals are responsible for coordinating nutrition awareness programmes. Such programmes are administered through community health workers who are assigned different geographical areas. Community health workers either organize educational sessions for households in their area, or they visit households with certain messages and to answer questions. As the frequency of the interactions with the community health worker tends to decrease with distance, we use household distance to the nearest district hospital as a proxy for nutritional awareness.
Furthermore, physical activity may affect nutritional status. Physical activity during leisure time is measured in terms of the number of hours spent on all non-work exercises related to household chores, gardening, walking, biking and sports. In addition, we captured physical activity during school and work. For children, we measure the weekly hours of physical education in school. For adults, we asked for the type of occupation; based on these responses we constructed a variable differentiating between heavy and light physical work.
In addition to nutritional status, we also analyse the impact of supermarkets on food energy consumption measured in joules. We look at total energy consumption, as well as energy from processed and unprocessed foods, following common classifications in the literature( Reference Asfaw 16 ). Foods were considered processed if any industrial method was used to develop food products from fresh whole foods. We hypothesize that the share of joules from processed foods is higher among supermarket buyers and that this difference may contribute to differences in nutritional status. We acknowledge that our simple classification has limitations, because the effects may differ by type and level of processing. Recent research has shown that ultra-processed, ready-to-consume foods are particularly obesogenic( Reference Monteiro, Levy and Claro 33 , Reference Monteiro, Moubarac and Cannon 34 ). While the consumption of ultra-processed foods is still relatively low in Kenya( Reference Rischke, Kimenju and Klasen 24 ), further disaggregation might be useful when observed developments continue.
Quantities of food consumed in the household were converted to joules using food composition tables developed for Kenyan foods( Reference Sehmi 35 , 36 ). A few foods that could not be found in these local food composition tables were converted using international values( 37 ). To get from household-level to individual-level consumption values, joules were allocated to household members based on adult equivalence scales for energy requirements, assuming light physical activity( 38 ). We also considered food away from home. Survey respondents reported dishes consumed in restaurants, canteens, food stalls or similar outlets. To determine the energy consumed from food away from home, we engaged local cooks to prepare the dishes mentioned, which helped us to determine ingredients and typical serving sizes. We adjusted for edible portions and weight changes during cooking( 39 ). This worked well for adult household members. Unfortunately, the data on food away from home for children and adolescents contained several missing values, so that for this group only joules from foods consumed at home were considered. Since all supermarket purchases fall into the ‘consumed at home’ category, this limitation should not affect our analysis much.
Statistical analysis
Our main objective is to analyse the impact of supermarket purchase on nutritional status of adults and of children and adolescents. We estimate models of the following type:
 $$N_{i} =\beta _{0} {\plus}\beta _{1} S_{i} {\plus}\beta _{2} {\bi Z}_{i} {\plus}{\varepsilon}_{i} ,$$
where N i is the outcome variable characterizing nutritional status of individual i, S i is supermarket purchase, Z i is a vector of control variables, including individual and household characteristics, and ε i is a random error term.
In this model, the supermarket purchase variable may potentially be endogenous, since there could be unobserved factors that determine supermarket purchase and nutritional status simultaneously. This could lead to biased impact estimates. To avoid this problem, we use an IV estimation approach. The IV approach creates a kind of pseudo randomization in the data, thus allowing causal inferences similar to those from randomized controlled trials( Reference Deaton 26 , Reference Newhouse and McClellan 27 ). IV approaches have been used previously to measure causal effects of nutrition and health programmes using cross-sectional observational data( Reference Newhouse and McClellan 27 , Reference Lawlor, Timpson and Harbord 40 , Reference Yen, Andrews and Chen 41 ). For IV estimation, we instrument supermarket purchase with the household distance to the nearest supermarket (measured through Global Positioning System coordinates), which can be located in the same town or, in the case of Njabini, also in a different town. Distance to supermarket fulfills the statistical conditions for a valid instrument( Reference Newhouse and McClellan 27 ): this variable is exogenous, significantly correlated with supermarket purchase and not directly correlated with nutritional status.
Concerns that distance to supermarket could be correlated with socio-economic status might be justified in larger cities but not in the small towns analysed here. In large cities, social stratification of neighbourhoods is common and supermarket chains choose the location of new stores using data on the characteristics of potential customers. Yet in the small towns, only one supermarket exists, which is located in the town’s centre where other retailers are also found. To test, we performed the regression of supermarket distance v. household consumption expenditure, our measure of socio-economic status, and found no significant effect.
For the continuous outcome variables (such as BMI or HAZ), we use an IV two-stage least-squares estimator to estimate the model in equation (1). For the binary outcome variables (such as overweight/obese or stunted) we use an IV probit estimator. Marginal effects from the IV probit are evaluated at sample mean values.
In addition to the reduced-form models in equation (1), we also analyse possible pathways through which supermarkets affect nutritional outcomes of adults and children/adolescents by estimating structural models with simultaneous equations. On the one hand, supermarket purchase may influence the quantity of joules consumed. On the other hand, dietary composition and the types of joules consumed may also be affected. The available literature suggests that the share of joules from processed foods may increase BMI even after controlling for the total amount of energy consumed( Reference Asfaw 16 ). We model a causal chain, hypothesizing that supermarket purchase affects total joule consumption and the share of joules from processed foods, and that these two variables both affect nutritional status. The causal chain is modelled as follows:
 $$N_{i} =\beta _{0} {\plus}\beta _{1} J_{i} {\plus}\beta _{2} P_{i} {\plus}\beta _{3} {\bi T}_{i} {\plus}{\varepsilon}_{{i1}} ,$$
 $$J_{i} =\alpha _{0} {\plus}\alpha _{1} S_{i} {\plus}\alpha _{2} {\bi U}_{i} {\plus}{\varepsilon}_{{i2}} ,$$
 $$P_{i} =\delta _{0} {\plus}\delta _{1} S_{i} {\plus}\delta _{2} {\bi V}_{i} {\plus}{\varepsilon}_{{i3}} $$
and
 $$S_{i} =\gamma _{0} {\plus}\gamma _{1} D_{i} {\plus}\gamma _{2} {\bi W}_{i} {\plus}{\varepsilon}_{{i4}} ,$$
where N i is the nutritional status of individual i, J i is joule consumption of the same individual, P i is the share of joules from processed foods, S i is supermarket purchase and D i is distance to the nearest supermarket. T i , U i , V i and W i are vectors of individual and household characteristics, while ε i1 to ε i4 are random error terms. This system of simultaneous equations is estimated using a three-stage least-squares estimator. We estimate separate models for adults and for children and adolescents.
Results
While 41 % of the adults in our sample are classified as either overweight or obese, only 10 % of the children and adolescents fall into this category. On the other hand, 21 % of the children in our sample are affected by stunting, a common indicator of child undernutrition (see Tables 1S and 2S in the online supplementary material). Table 1 compares nutrition-related variables between individuals from households that buy and do not buy in supermarkets.
Table 1 Comparison of nutrition variables by supermarket purchase among 615 adults and 216 children and adolescents, Central Province of Kenya, July and August 2012

Ksh, Kenyan shillings; AE, adult equivalent.
Mean value is significantly higher than that of the other group: *P<0·1, **P<0·05, ***P<0·01.
Adults in households with supermarket purchase have a significantly higher BMI and are more likely to be overweight or obese. They also consume significantly more joules and a greater share of their joules comes from processed foods. For children and adolescents, the patterns are different. While there is a slight difference in mean BAZ between supermarket buyers and non-buyers, this difference is not statistically significant. Yet we observe significantly higher HAZ among children from households that buy in a supermarket and a lower prevalence of stunting. This points at possible differences between adults and children.
Impact of supermarket purchase on nutritional status
The mean differences in Table 1 are a first indication that buying food in a supermarket may contribute to increasing BMI and a higher prevalence of overweight among adults. To test this hypothesis, we estimate the model explained in equation (1). Estimation results are shown in Table 2. The first two models have BMI as dependent variable. The two models differ only in terms of how the supermarket purchase variable is defined: as a dummy in model 1 and as a continuous variable measuring the share of supermarket purchases in total household food expenditure in model 2. Models 3 and 4 both have an overweight/obese dummy as dependent variable, again with different definitions of the supermarket purchase variable.
Table 2 Impact of supermarket purchase on adult nutrition, Central Province of Kenya, July and August 2012
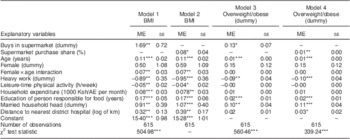
ME, marginal effect; se, robust standard error; Ksh, Kenyan shillings; AE, adult equivalent.
Results of instrumental variable regression models are presented, with dependent variables shown in the column headings (first-stage results are presented in Table 3S in the online supplementary material). Models 1 and 2 differ only in terms of how supermarket purchase is defined, as shown in the first two rows; likewise for models 3 and 4.
*P<0·1, **P<0·05, ***P<0·01.
Independent of the exact specification, supermarket purchase has significant effects on nutritional outcomes. Controlling for socio-economic status and other confounding factors, buying in a supermarket is associated with a 1·7 kg/m2 (P=0·018) higher BMI and a 13 percentage point (P=0·057) higher probability of being overweight or obese. Similarly, an increase in the share of supermarket purchases by one percentage point increases BMI by 0·08 kg/m2 (P=0·072) and the probability of being overweight or obese by one percentage point (P=0·04). Most of the control variables have the expected signs, with age and living standard contributing to higher BMI and physical activity to lower BMI.
Table 1 did not reveal significant differences in overweight and obesity between children/adolescents from households that buy and do not buy in supermarkets. The regression results in model 1 of Table 3 confirm that supermarket purchase does not affect BAZ in a significant way. Models 2 and 3 of Table 3 show the effects of supermarket purchase (dummy) and supermarket purchase share (continuous) on HAZ. Controlling for other factors, supermarket purchase is associated with 0·63 (P=0·017) higher HAZ. Similarly, a one percentage point increase in the supermarket purchase share increases HAZ by 0·03 (P=0·005). This suggests that supermarkets contribute to reducing problems of undernutrition among children and adolescents.
Table 3 Impact of supermarket purchase on child/adolescent nutrition, Central Province of Kenya, July and August 2012
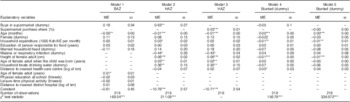
BAZ, BMI-for-age Z-score; HAZ, height-for-age Z-score; ME, marginal effect; se, robust standard error; Ksh, Kenyan shillings; AE, adult equivalent.
Results of instrumental variable regression models are presented, with dependent variables shown in the column headings (first-stage results are presented in Table 4S in the online supplementary material). Models 2 and 3 differ only in terms of how supermarket purchase is defined, as shown in the first two rows; likewise for models 4 and 5.
*P<0·1, **P<0·05, ***P<0·01.
The supermarket coefficients in the models with stunting as dependent variable (models 4 and 5 of Table 3) are negative, but not statistically significant. This may be related to the relatively small sample of children/adolescents. Moreover, how many individuals can be lifted above a threshold depends on the variable distribution and the magnitude of the threshold. The standard threshold for stunting is HAZ <−2, which is what we used for the estimates in Table 3. Using common thresholds for mild stunting (HAZ <−1) and severe stunting (HAZ <−3), we do find significant effects as shown in Table 5S in the online supplementary material. Buying in a supermarket is associated with a 23 percentage point lower probability (P<0·001) of severe stunting.
Control variables for these child/adolescent models were chosen based on the broad nutrition and health literature( Reference Asfaw 16 , Reference Lear, Gasevic and Schuurman 19 , Reference Black, Victora and Walker 42 – Reference Simon, Kellou and Dugas 46 ). Factors that contribute to overnutrition may be somewhat different from factors that contribute to undernutrition, which is why model specifications in Table 3 are not uniform for the different nutritional outcome variables. Most of the control variables show the expected signs. Household living standard, height and age of the mother, and treated drinking water increase HAZ and thus reduce child undernutrition, while recent episodes of infectious diseases have a significantly negative effect on HAZ.
Impact pathways
We have shown that buying in supermarkets contributes to higher BMI and a higher probability of being overweight or obese among adults. Now we explore possible impact pathways, estimating the causal chain models explained in equations (2) to (5). Estimation results for the adult sample are summarized in Table 4. The estimates confirm the hypothesis that total joule consumption and the share of joules from processed foods both play a significant role. An increase in the supermarket purchase share by one percentage point entails a consumption increase of 64·61 kJ/d (P=0·07) and an increase in the share of joules from processed foods by 0·33 percentage points (P=0·002). Furthermore, both variables significantly contribute to higher BMI.
Table 4 Impact pathways of supermarket purchase on adult BMI, Central Province of Kenya, July and August 2012

ME, marginal effect.
Estimates are based on causal chain model, full results of which are presented in the online supplementary material (Table 6S).
*P<0·1, **P<0·05, ***P<0·01.
For children and adolescents, supermarkets do not seem to increase overweight and obesity, but we found that supermarket purchase contributes to reduced undernutrition in terms of higher HAZ. Like overnutrition, undernutrition is determined by the quantity and types of foods consumed, among other factors. Hence, we estimated a causal chain model similar to the one used for adults, but with child/adolescent HAZ as nutritional outcome variable. The main results are shown in Table 5. While the effect of supermarket purchase on joule consumption is positive, it is not statistically significant. Yet, supermarket purchase has a significantly positive effect on joules from processed foods, indicating changes in dietary composition. An increase in the supermarket purchase share by one percentage point increases the share of joules from processed foods by 0·45 percentage points (P=0·015). The amount of joules and the share of joules from processed foods both have positive and significant effects on individual HAZ.
Table 5 Impact pathways of supermarket purchase on child/adolescent HAZ, Central Province of Kenya, July and August 2012
HAZ, height-for-age Z-score; ME, marginal effect.
Estimates are based on causal chain model, full results of which are presented in the online supplementary material (Table 7S).
*P<0·1, **P<0·05, ***P<0·01.
Discussion
In the present study we have used cross-sectional survey data to analyse the effects of supermarket purchase on adult and child nutrition in three towns of Kenya. For the identification of supermarket impacts, we employed a quasi-experimental survey design and collected data from households in towns with and without supermarkets. However, supermarkets are not randomly allocated to towns. Those towns that have a supermarket may be richer or differ in other ways from towns that do not yet have a supermarket (in Njabini, the town that did not have a supermarket in 2012, a supermarket was built in 2014 and is likely to open in 2015). Hence, we used regression models to control for the socio-economic status of households, educational levels and a number of other possible confounding factors. Furthermore, we employed IV estimation techniques to control for unobserved differences. When valid instruments are available, IV methods allow causal inference also with cross-sectional data( Reference Imbens and Wooldridge 25 – Reference Newhouse and McClellan 27 , Reference Lawlor, Timpson and Harbord 40 , Reference Yen, Andrews and Chen 41 ). We used distance to the nearest supermarket as instrument for supermarket purchase and performed various tests to confirm instrument validity. Nevertheless, more reliable impact estimates can be obtained with panel data over a longer period of time, so that follow-up studies would be useful to verify our results.
In spite of the cross-sectional nature of our data, the findings add to the existing literature. The estimates suggest that buying in supermarkets contributes to higher BMI and a higher probability of being overweight or obese among adults in Kenya. These effects remain robust also after controlling for socio-economic status, education, physical activity level and other known determinants of BMI. This result is consistent with the scant literature on the relationship between supermarkets and consumer nutritional outcomes for adults in developing countries( Reference Asfaw 15 ). In the USA, supermarkets were shown to reduce adult obesity( Reference Lear, Gasevic and Schuurman 19 , Reference Michimi and Wimberly 20 ), underlining that impacts depend on the context. One important question is what type of food products supermarkets offer. In developing countries, supermarkets tend to specialize in processed foods first, adding fresh foods only at a later stage of market development( Reference Mergenthaler, Weinberger and Qaim 6 , Reference Timmer 8 , Reference Reardon, Timmer and Barrett 9 ).
For children and adolescents, our data suggest that buying in supermarkets does not contribute to higher overweight and obesity. Rather, supermarket purchase tends to reduce child undernutrition through a positive effect on HAZ. Supermarkets also seem to reduce the probability of severe stunting.
The analysis of impact pathways suggests that supermarket purchase increases adult BMI through more joules consumed and also through a higher share of joules from processed foods. The impact pathways for child HAZ are similar, although the effect of supermarkets on total joule consumption is not statistically significant, possibly due to the smaller sample size. Why do supermarkets cause consumers to eat more and change their dietary composition? A comprehensive analysis of this question is beyond the scope of the paper, but a brief discussion may be useful. While some of the supermarkets in larger Kenyan cities offer fresh products, such as fruits and vegetables or whole grains, this is not yet the case for supermarkets in smaller towns, as analysed here( Reference Rischke, Kimenju and Klasen 24 ). Hence, small-town consumers who buy a lot in supermarkets will automatically increase the share of processed food in their diet. Packaging sizes, prices and shopping atmosphere may also play an important role for consumer food choices( Reference Hawkes 12 , Reference Chandon and Wansink 47 , Reference Schipmann and Qaim 48 ). When asked why they buy in supermarkets, 65 % of the respondents in our sample reported lower food prices as the most important reason (Fig. 1). Indeed, our data show lower mean prices of joules purchased in supermarkets as compared with joules purchased in traditional outlets.

Fig. 1 The most important reason for shopping in supermarkets, based on household survey responses, Central Province of Kenya, July and August 2012. Only households that buy in a supermarket are included
The fact that the same mechanisms lead to nutritional outcomes that differ by age cohort is interesting and emphasizes the need for disaggregated analysis. For adults who have already reached their final body height, increasing joule consumption can only lead to higher BMI when other factors are held constant. Waistlines will increase especially when levels of physical activity are low, as is the case with more sedentary lifestyles. For children and adolescents, the situation is different, because higher joule consumption can also lead to gains in body height, as observed in our study. Moreover, children and adolescents in our sample are more physically active than adults (see online supplementary material, Tables 1S and 2S). Concerning effects on body height, it should be mentioned that – beyond joules – certain micronutrients also play an important role for child growth( Reference Martorell, Khan and Schroeder 49 ). While not analysed here, dietary changes through buying in supermarkets may potentially be associated with higher micronutrient consumption. This could be true especially for children from poor households who otherwise have relatively low dietary diversity.
Clearly, the impact of expanding supermarkets in developing countries will much depend on people’s initial nutritional status. In Kenya, we observe relatively high overweight rates among adults, while stunting is a more widespread problem among children and adolescents. This so-called dual burden of malnutrition is common in many developing countries( Reference Roemling and Qaim 45 , Reference Doak, Adair and Bentley 50 ), implying that some of our results may also be of relevance for other settings. Reducing child stunting and controlling the global obesity pandemic are both important public health objectives.
The results suggest that the supermarket revolution in developing countries is not just a business response to the rapid nutrition transition, but that supermarkets also contribute to changing food consumption habits and nutritional outcomes. Yet the types of outcomes can be diverse, depending on many factors. Hence, simple conclusions on whether supermarkets are good or bad for nutrition and health are not justified. It should also be noted that impacts may change over time. Rates of child undernutrition will decrease and childhood obesity may increase when household incomes rise. Furthermore, supermarkets may gradually offer a greater variety of products, including more fresh and healthy foods, which can contribute to nutritional improvements, as shown in the USA( Reference Lear, Gasevic and Schuurman 19 , Reference Michimi and Wimberly 20 ).
Conclusion
We showed that buying in a supermarket is associated with a 1·7 kg/m2 higher BMI and a 13 percentage point higher probability of overweight or obesity among adults. For children and adolescents, we did not find a significant effect on overweight. Instead, buying in a supermarket tends to decrease child undernutrition through a positive effect on HAZ and a negative effect on severe stunting. For both adults and children, the nutrition impacts occur through higher food energy consumption and changes in dietary composition induced by supermarkets and their sales strategies. Our analysis should not be seen as the final judgement about the nutritional impacts of supermarkets in developing countries, but as early evidence from a particular case. More research, especially with panel data from different settings and collected over longer time periods, is needed to further improve our understanding of this complex and emerging theme.
Acknowledgements
Acknowledgements: The authors are grateful to the University of Nairobi, particularly Dr Jonathan Nzuma and his students, for support in fieldwork coordination. Financial support: This work was supported by a grant from the German Research Foundation (Deutsche Forschungsgemeinschaft, DFG). DFG had no role in the design, analysis or writing of this article. Conflict of interest: None. Authorship: All authors contributed to the design of the research; S.C.K. and R.R. performed the research; S.C.K. undertook data analysis; S.C.K. and M.Q. wrote the manuscript; R.R. and S.K. reviewed and commented on the manuscript; all authors approved the final version. Ethics of human subject participation: No ethical approval was required. Written informed consent was obtained from all adult subjects for themselves and their children.
Supplementary material
To view supplementary material for this article, please visit http://dx.doi.org/10.1017/S1368980015000919


