


Alcohol consumption is one of the most important – and potentially one of the most avoidable – risk factors for chronic disease and injury, but it is increasingly becoming a serious problem worldwide. It has been documented that chronic heavy ethanol consumption directly impairs glucose tolerance and insulin sensitivity, which are the major pathogenic features of type 2 diabetes mellitus (T2DM)( Reference Hodge, Dowse and Collins 1 , Reference Risinger and Cunningham 2 ). This is also verified by our previous study( Reference Feng, Song and Guan 3 ). Although the precise mechanism or mechanisms underlying the effect of alcohol on the pathogenesis of T2DM has not been well elucidated as of yet, recent findings indicate that there is a clear link between T2DM and the alcohol-elicited dysfunction of white adipose tissue (WAT)( Reference Markowski, Thies and Gottlieb 4 ).
Traditionally, WAT has been considered only a passive reservoir for energy storage, but the discovery of a number of adipokines( Reference Trayhurn and Wood 5 – Reference Rosen and Spiegelman 9 ) has led to a modern conception of WAT as the largest endocrine organ. Therefore, it is conceivable that the dysfunction of WAT might be attributable to the pathophysiology of a variety of metabolic diseases. Indeed, research has shown that during the development of obesity, adipocytes become hypertrophic and can increase in size to 200 μm in diameter( Reference Skurk, Alberti-Huber and Herder 10 ), but the diffusion limit of oxygen is at most 100 μm( Reference Helmlinger, Yuan and Dellian 11 ). In this regard, hypertrophic adipocytes might endure hypoxia. Of note, hypoxia-inducible factor-1α (HIF-1α) and GLUT1, which play a pivotal role in the response to hypoxia( Reference Trayhurn, Wang and Wood 12 ), are regarded as the master regulators of O2 homoeostasis. Increasing evidence suggests that hypoxia in adipose tissue (AT) leads to chronic inflammation within the tissue( Reference Trayhurn and Wood 5 ), which subsequently results in the dysregulation of the production of inflammation-related adipokines, such as leptin, adiponectin, TNF-α, IL-6 and vascular endothelial growth factor (VEGF)( Reference Hosogai, Fukuhara and Oshima 13 , Reference Wang, Wood and Trayhurn 14 ), which are viewed as central to the development of insulin resistance and metabolic syndrome( Reference Rajala and Scherer 7 , Reference Rosen and Spiegelman 9 , Reference Hotamisligil 15 ).
Previously, we found that rats who consumed ethanol for a long period of time exhibited an expansion in visceral adipose tissue (VAT) mass and hypertrophic adipocytes( Reference Feng, Song and Guan 3 ). This finding prompted us to explore whether chronic ethanol consumption leads to AT hypoxia and, consequently, the occurrence of low-grade inflammation. Therefore, the present study was designed to measure the expression of HIF-1α and GLUT1 as well as leptin, TNF-α, IL-6 and VEGF in both epididymal AT and OP9 adipocytes in response to ethanol consumption. The goal of the project was to gain new insight into the molecular mechanism responsible for ethanol's effects on glucose metabolism.
Materials and methods
Animal feeding
A total of twenty-four male Wistar rats (weight, 160–180 g; age, 4–6 weeks) were purchased from the Laboratory Animal Center at Shandong University. After 1 week of acclimatisation, the rats were randomly assigned to either the control group or the ethanol feeding group, with twelve subjects in each group. The diets were purchased from the Laboratory Animal Center. In terms of energy, the diet contained 10 % fat, 70 % carbohydrates and 20 % protein (total 17·74 kJ/g (4·24 kcal/g)). Rats in the ethanol feeding group received edible ethanol (Beijing erguotou; Beijing Erguotou Company) once a day at a dosage of 5 g/kg per d, and rats in the control group received distilled water by gastric tubes. Body weights were monitored, and ethanol volumes were adjusted every week. All of the treatments lasted for 8 weeks.
During the period of treatment, rats were housed in individual cages in a temperature-controlled room (24°C) and were exposed to a 12 h light–12 h dark cycle. Water was available ad libitum. The study was approved by the Shandong University Institutional Animal Care and Use Committee.
Oral glucose tolerance test
An oral glucose tolerance test (OGTT) was carried out after the 8-week treatment was complete. Rats were fasted overnight, and then their blood glucose was measured in samples that were obtained by tail bleeding both before glucose administration (2 g/kg body weight) and 30, 60 and 120 min after glucose load. Blood glucose (BG) concentrations were determined using a One Touch SureStep Meter (LifeScan, Inc.). AUC was calculated to assess glucose tolerance using the following formula:
 $$\begin{eqnarray} AUC = 1/4BG (0\hairsp min) + 1/2BG (30\hairsp min) + 3/4BG (60\hairsp min) + 1/2BG (120\hairsp min). \end{eqnarray}$$
Tissue collection
All of the rats were allowed to recover from the OGTT for 3 d before they were killed. Rats were anaesthetised by an intraperitoneal injection of sodium pentobarbital (0·1 ml/100 g body weight) after a 10 h fast. Blood samples and epididymal and perirenal fat pads were obtained as described previously( Reference Feng, Gao and Guan 16 ).
Biochemical analysis and evaluation of insulin sensitivity
Plasma glucose was measured using the glucose oxidase method. Insulin was measured by RIA (Northern Bioengineering Institute). The homeostasis model assessment of insulin resistance (HOMA-IR) was calculated using the following formula:
 $$\begin{eqnarray} Fasting\ plasma\ glucose\ (mmol/l)\times fasting\ insulin\ (microunits/ml)/22\cdot 5. \end{eqnarray}$$
Cell culture
The OP9 cell line was established from the calvaria of newborn mice genetically deficient in a functional macrophage colony stimulating factor( Reference Nakano, Kodama and Honjo 17 ) and was used as a pre/mature adipocyte model( Reference Wolins, Quaynor and Skinner 18 ). The cells had the potential to rapidly differentiate into adipocytes. The OP9 cells (ATCC) were seeded in a twelve-well plate and divided into three groups: controls (A); ethanol (100 mm) supplied during the differentiation (B); and ethanol (100 mm) supplied 10 d after differentiation was initiated (C). OP9 cells were cultured in minimum essential medium (MEM)-α (Invitrogen) containing 20 % (v/v) fetal bovine serum (Invitrogen) and 1 % penicillin–streptomycin (Sigma) at 37°C under 10 % CO2. At confluence, differentiation was induced by exposing the cells to a cocktail containing 0·5 mm-3-isobutyl-1-methylxanthine (IBMX) (Sigma), 1 μm-dexamethasone (Sigma) and 20 % fetal bovine serum in Dulbecco's minimum essential medium α (DMEM-α) for 3 d. The medium was replaced with DMEM-α supplemented with 20 % fetal bovine serum and 1 μg/ml insulin for an additional 2 d. Afterwards, the medium was changed every 2 d with DMEM-α supplemented 20 % fetal bovine serum and antibiotics. Ethanol was supplemented to group B each time the medium was changed. The images of adipocytes in group B were acquired using a microscope 10 d after differentiation was initiated, and the percentage of differentiated adipocytes was calculated. Adipocytes in group C were incubated in ethanol for 48 h at a concentration of 100 mm 10 d after differentiation was initiated. Then the medium was used to measure adipokines, and the cells were used for protein analysis.
Western blot analysis
Western blot analysis was performed as described previously( Reference Feng, Gao and Guan 16 ). Total proteins were extracted from the AT and adipocytes by using a radioimmunoprecipitation assay lysis buffer supplemented with 1 mm-phenylmethanesulfonyl fluoride. HIF-1α primary antibody was bought from Cell Signaling Company. GLUT1, leptin, TNF-α, IL-6 and VEGF primary antibodies were bought from Santa Cruz Biotechnology, Inc. The expression of β-actin, as an internal control, was verified by reblotting the same membranes with mice anti-rat β-actin monoclonal antibody (Abcam Ltd.). The relative target protein levels were normalised with β-actin.
Adipokines analysis
The concentration of TNF-α and IL-6 in serum and conditioned media was measured using mouse-specific ELISA kits (R&D Systems) according to the manufacturer's instructions.
Statistical analysis
All of the results were expressed as means with their standard errors. Data were analysed by GraphPad Prism version 6 (GraphPad Software, Inc.). The statistical significance of differences between the groups was determined by a t test. The results were considered to be significant when the P value was < 0·05.
Results
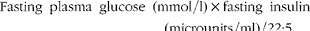
Chronic heavy ethanol feeding impaired glucose tolerance and insulin sensitivity
To determine the effects of long-term ethanol consumption on glucose metabolism and insulin sensitivity, we performed OGTT on the rats and calculated HOMA-IR. The results showed that the glucose levels 30 min after glucose administration in the ethanol-treated group were much higher than those in the control group (Fig. 1(a), P< 0·05), and they were then reduced to normal levels at 60 and 120 min after glucose load (Fig. 1(a)). The OGTT AUC of ethanol-fed rats was significantly increased relative to the rats in the control group (Fig. 1(b)). The HOMA-IR was elevated by 40·6 % in the ethanol-treated group (Fig. 1(c), P< 0·05). These results indicate that 8 weeks of ethanol consumption impaired glucose tolerance and insulin sensitivity in rats.
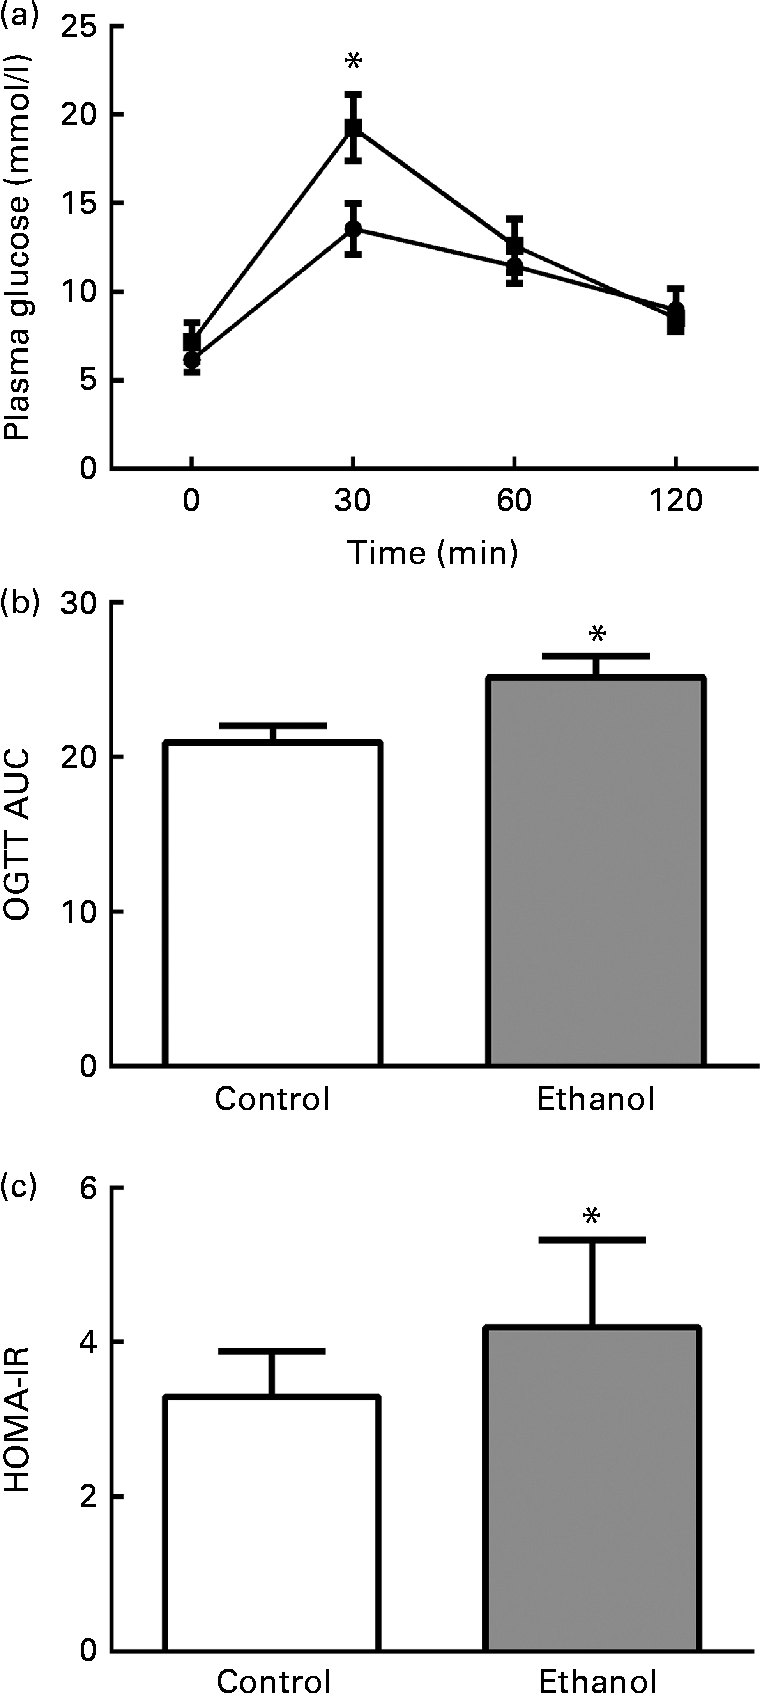
Fig. 1 Chronic ethanol consumption impaired rat glucose tolerance. After 8 weeks of ethanol feeding (5 g/kg per d), an oral glucose tolerance test (OGTT) was carried out. Rats were fasted overnight, and then their blood glucose (BG) was measured by tail bleeding both before glucose administration (2 g/kg body weight) and 30, 60 and 120 min after glucose load (a). ![]() , Control;
, Control; ![]() , ethanol. AUC was calculated using the following formula (b): AUC = 1/4BG (0 min)+1/2BG (30 min)+3/4BG (60 min)+1/2BG (120 min). Fasting plasma glucose and insulin were measured after the rats were killed. The homeostasis model assessment of insulin resistance (HOMA-IR) was calculated using the following formula: fasting plasma glucose (mmol/l) × fasting insulin (microunits/ml)/22·5. Values are means, with their standard errors represented by vertical bars. * Mean value was significantly different from that of the control group (P <0·05).
, ethanol. AUC was calculated using the following formula (b): AUC = 1/4BG (0 min)+1/2BG (30 min)+3/4BG (60 min)+1/2BG (120 min). Fasting plasma glucose and insulin were measured after the rats were killed. The homeostasis model assessment of insulin resistance (HOMA-IR) was calculated using the following formula: fasting plasma glucose (mmol/l) × fasting insulin (microunits/ml)/22·5. Values are means, with their standard errors represented by vertical bars. * Mean value was significantly different from that of the control group (P <0·05).
Chronic heavy ethanol feeding led to visceral adipose tissue accumulation
The body weights of rats were monitored every week. Body weights at the end of final week are not shown because of the 10 h of fasting before the OGTT. In the ethanol-treated group, the rats' body weights showed a slight decrease at the end of 2nd week, but they subsequently recovered to the same level as the control group (Fig. 2(a)). At the end of the treatment, the body weights in both groups showed no significant differences. However, both the epididymal and perirenal AT weights were markedly increased in the ethanol-treated group as compared to the control group (Fig. 2(b), P< 0·05, P< 0·05, respectively), which indicates that long-term ethanol treatment led to a deposit of VAT regardless of body weight.
Fig. 2 Chronic ethanol consumption led to rat visceral adipose tissue (AT) accumulation without influencing body weight. A total of twenty-four male Wistar rats received edible ethanol once a day at a total dosage of 5 g/kg per d (ethanol: (a) ![]() , (b)
, (b) ![]() ) or distilled water by gastric tubes (control: (a)
) or distilled water by gastric tubes (control: (a) ![]() , (b)
, (b) ![]() ). Body weights were monitored every week (a). At the end of 8 weeks, epididymal and perirenal AT were collected and weighed (b). Values are means, with their standard errors represented by vertical bars. * Mean value was significantly different from that of the control group (P <0·05).
). Body weights were monitored every week (a). At the end of 8 weeks, epididymal and perirenal AT were collected and weighed (b). Values are means, with their standard errors represented by vertical bars. * Mean value was significantly different from that of the control group (P <0·05).
Ethanol treatment induced adipocytes differentiation and increased lipid accumulation
The images of adipocytes were acquired 10 d after differentiation was initiated to evaluate the effect of ethanol on adipocytes differentiation. The results showed that both the cells and the lipid droplet sizes after ethanol treatment were larger than those in the controls (Fig. 3(a)–(d)); moreover, the differentiation rate in the ethanol group was much higher than that in control group (Fig. 3(e), P< 0·01). These results suggest that ethanol induced adipocytes differentiation and increased lipid accumulation in adipocytes.

Fig. 3 The induction effect of ethanol on adipocyte differentiation. OP9 mouse stromal cells were seeded in a twelve-well plate. At confluence, OP9 cells were differentiated with a dexamethasone+3-isobutyl-1-methylxanthine+insulin (DEX+IBMX+INS) cocktail supplemented with (b, magnification 100 × ; d, magnification 200 × ) or without (a, magnification 100 × ; c, magnification 200 × ) ethanol (100 mm). The differentiation rate was calculated 10 d after differentiation was initiated (e). These figures are representative of four independently replicated experiments. Values are means, with their standard errors represented by vertical bars. * Mean value was significantly different from that of the control group (P <0·05).
Ethanol increased hypoxia-inducible factor-1α and GLUT1 expression in adipocytes
With the enlargement of VAT mass in ethanol-treated rats, we speculated that hypoxia might be observed in AT. We measured the expression of HIF-1α and GLUT1, the key hypoxia marker genes. As we hypothesised, the rats that were exposed to ethanol showed increased HIF-1α protein expression in epididymal AT (Fig. 4(a), P< 0·05). Consistent with the results we observed in vivo, the expression of HIF-1α in OP9 adipocytes exposed to 100 mm of ethanol was also elevated significantly as compared to the control group (Fig. 4(b), P< 0·05). Simultaneously, chronic ethanol feeding led to a 25·9 and 95 % increase of GLUT1 in epididymal AT and OP9 adipocytes, respectively, as compared to the control group (Fig. 4(c) and (d), P< 0·01). These data indicate that hypoxia occurred in adipocytes after long-term ethanol exposure.

Fig. 4 Chronic ethanol treatment increased adipocyte hypoxia-inducible factor-1α (HIF-1α) expression both in vivo and in vitro. A total of twenty-four male Wistar rats were fed with or without ethanol (5 g/kg per d) for 8 weeks. Then epididymal adipose tissue (AT) was obtained for measuring HIF-1α and GLUT1 protein expression (a and c). The OP9 cells were then incubated in ethanol 10 d after differentiation was initiated at a concentration of 100 mm for 48 h. Total protein was extracted from the cells and used for HIF-1α and GLUT1 protein analysis (b and d). The experiments were performed at least three different times. Values are means, with their standard errors represented by vertical bars. Mean value was significantly different from that of control: * P <0·05, ** P <0·01.
Ethanol increased inflammation-related adipokines levels in vivo and in vitro
Given the important role of chronic, low-grade inflammation in the development of insulin resistance( Reference Hotamisligil 15 , Reference Dandona, Aljada and Bandyopadhyay 19 ), we measured the effect of ethanol on the inflammation-related adipokines TNF-α and IL-6. As shown in Fig. 5(a)–(d), ethanol treatment increased TNF-α and IL-6 protein expression significantly (P< 0·01 for Fig. 5(a) and (c), P< 0·05 for Fig. 5(b) and (d)) both in vivo and in vitro. Both TNF-α and IL-6 in rat serum (Fig. 5(e) and (g), P< 0·01 and P< 0·05, respectively) and OP9 cell culture medium (Fig. 5(f) and (h), P< 0·01 and P< 0·05, respectively) were markedly increased after long-term ethanol administration (5 g/kg per d) and ethanol treatment (100 mm). These results indicate that chronic inflammation occurred after ethanol treatment, and this is the most probable mechanism for insulin resistance.

Fig. 5 Ethanol increased inflammation-related adipokine levels in vivo and in vitro. After rats were fed with ethanol at a dosage of 5 g/kg per d for 8 weeks, epididymal adipose tissue (AT) and blood samples were obtained for measuring TNF-α and IL-6 protein expression and serum levels (a, c, e and g). The OP9 cells were then incubated in ethanol 10 d after differentiation was initiated at a concentration of 100 mm for 48 h. Then the adipocytes and medium were used to measure adipokines with Western blot analysis and ELISA (b, d, f and h). The in vitro experiments were performed at least three different times. Values are means, with their standard errors represented by vertical bars. Mean value was significantly different from that of the control group: * P <0·05, ** P <0·01.
Chronic ethanol feeding increased leptin and vascular endothelial growth factor expression in epididymal adipose tissue
To confirm the inflammation within VAT, we next measured the expression of leptin and VEGF, the key inflammation-related adipokines whose expression was hypoxia-sensitive via HIF-1α. Consistent with the changes in HIF-1α, leptin expression in ethanol-fed rat AT was increased by 133·4 % relative to the control group (Fig. 6(a), P< 0·01). Simultaneously, VEGF expression was also increased by 52·9 % as compared to the control group (Fig. 6(b), P< 0·01). This further confirmed our supposition that low-grade inflammation occurred within VAT after ethanol consumption.
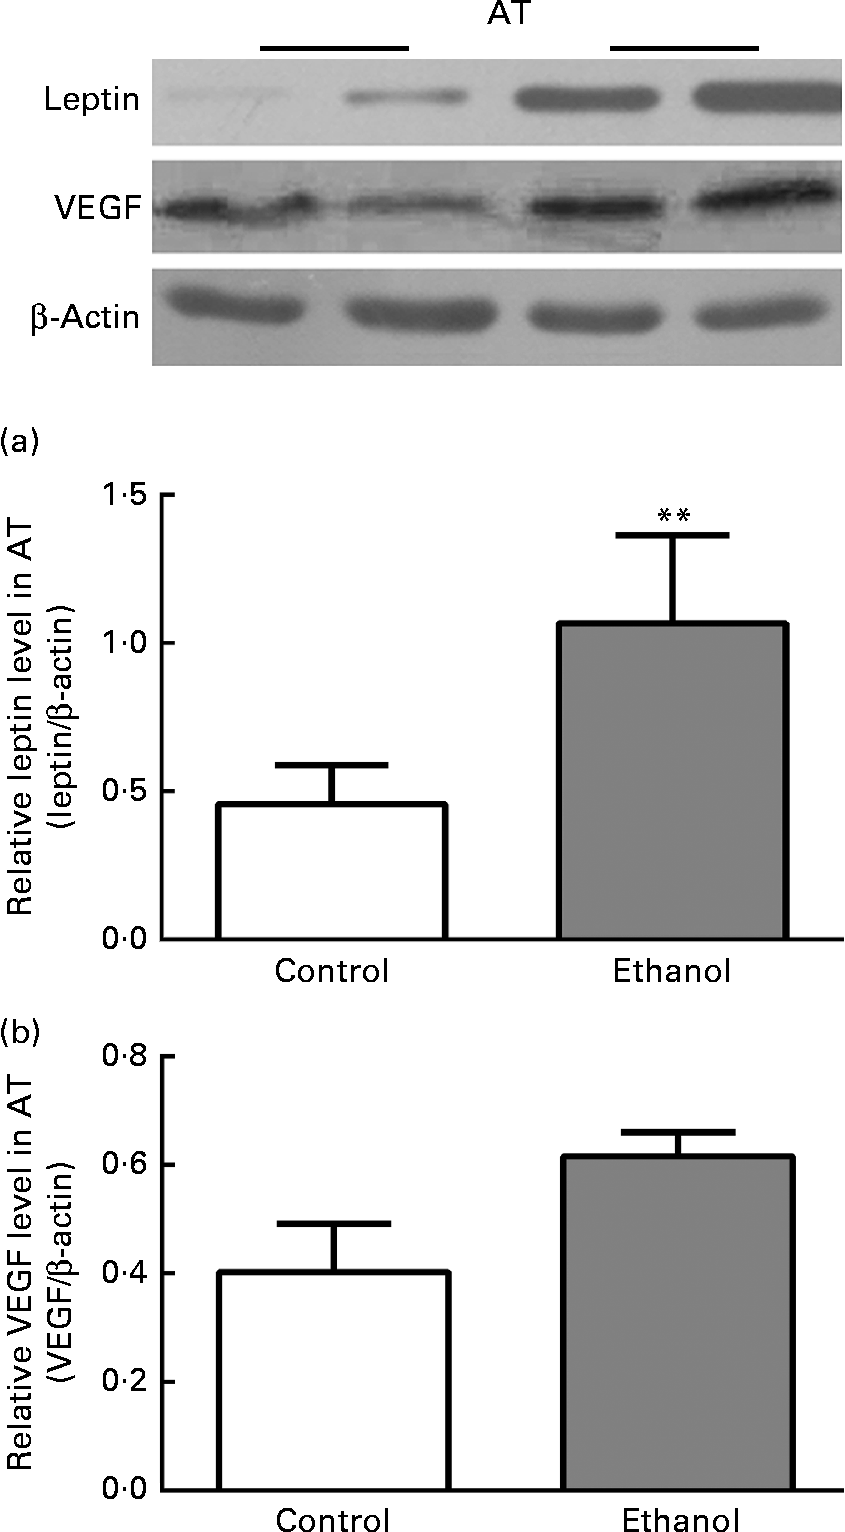
Fig. 6 Chronic ethanol feeding increased leptin and vascular endothelial growth factor (VEGF) expression in epididymal adipose tissue (AT). A total of twenty-four male Wistar rats were fed with or without ethanol (5 g/kg per d) for 8 weeks. Then epididymal AT was obtained for measuring leptin and VEGF protein expression (a and b). Values are means, with their standard errors represented by vertical bars. ** Mean value was significantly different from that of the control group (P <0·01).
Discussion
The present study is the first to provide evidence that chronic ethanol consumption impaired glucose tolerance and resulted in VAT accumulation. In addition, we found that the expression of HIF-1α and GLUT1 increased significantly both in epididymal AT and OP9 adipocytes after ethanol treatment, which indicates hypoxia within the tissue. As a result of hypoxia, the secretion of inflammation-related adipokines, such as leptin, TNF-α, IL-6 and VEGF, was subsequently increased, and this might be one possible mechanism underpinning ethanol-related diabetes.
Epidemiological studies suggest that the effects of ethanol are biphasic, that is, chronic light or heavy ethanol consumption leads to insulin resistance, whereas moderate ethanol consumption results in increased insulin sensitivity( Reference Bell, Mayer-Davis and Martin 20 – Reference Zilkens, Burke and Watts 24 ). However, the definitions of ethanol dosage as light, moderate or heavy are not uniform. We previously reported blood ethanol concentrations of 870 mg/l in rats using this paradigm( Reference Feng, Song and Guan 3 ). In the present study, after referring to several earlier studies( Reference Feng, Song and Guan 3 , Reference Feng, Han and Wang 25 – Reference Szabo, Puppolo and Verma 32 ), we adopted 5 g/kg per d in vivo and 100 mm in vitro as heavy ethanol dosages.
Under the ethanol challenge of such a concentration, the results from the OGTT exhibited marked differences between the ethanol-treated rats and the control rats after 8 weeks, which suggests that chronic heavy ethanol consumption leads to glucose intolerance in rats (Fig. 1).
With the present in vitro study, OP9 cells, but not 3T3-L1 cells, were employed to observe the adipocytes' response to ethanol. Although both cells have the potential to differentiate into mature adipocytes, they have quite different characteristics. 3T3-L1 cells have several limitations, including a requirement of 2 weeks to generate adipocytes and the waning of their adipogenic potential in culture. On the other hand, when OP9 cells are given any one of three adipogenic stimuli, they rapidly accumulate TAG, assume adipocyte morphology and express adipocyte late marker proteins. Thus, OP9 cells can differentiate into adipocytes within 2 d( Reference Wolins, Quaynor and Skinner 18 ). Based on the characteristics of the two cell lines, we preferred to use OP9 cells instead of 3T3-L1 cells.
Up until now, the mechanism responsible for the alcohol-attributable development of diabetes has still not been fully elucidated. WAT – in particular VAT, which is increasingly considered to be a functional endocrine organ( Reference Yasmin, Balen and Barth 33 – Reference McGown, Birerdinc and Younossi 36 ) – plays an important role in regulating whole organism-level insulin sensitivity( Reference Oda 37 – Reference Fox, Massaro and Hoffmann 39 ). In the present study, we demonstrated that both epididymal and perirenal AT weights significantly increased in ethanol-treated rats as compared to the control group. This finding, together with our previous data( Reference Hotamisligil 15 ), confirms that the occurrence of diabetes after long-term heavy ethanol consumption is firmly correlated with VAT deposition (Fig. 2), and this concurs with other studies that have investigated human subjects( Reference Vadstrup, Petersen and Sorensen 40 – Reference Schroder, Morales-Molina and Bermejo 44 ).
It has been reported that abdominal obesity is a considerable risk factor for developing insulin resistance and T2DM( Reference Fox, Massaro and Hoffmann 39 , Reference Freemantle, Holmes and Hockey 45 – Reference Wang, Rimm and Stampfer 47 ). In the present work, we revealed that ethanol treatment induced adipocyte differentiation and increased lipid droplet accumulation (Fig. 3), which is most probably a mechanism for VAT accumulation after ethanol consumption. However, Greenfield et al. ( Reference Greenfield, Samaras and Jenkins 48 ) reported that a smaller waist circumference was related to high alcohol consumption in healthy female twins. The discrepancy might be explained by the differences in total ethanol consumption.
Next, we investigated whether hypoxia occurs in alcohol-induced accumulated VAT or OP9 cells. First, we measured HIF-1α and found a 39·1 and 16·5 % increase in ethanol-fed rats' AT and ethanol-treated OP9 cells, respectively. The small difference in HIF-1α between the two groups might be the result of individual animal variation per se. In addition, the HIF-1α protein is not always a perfect marker of hypoxia. To further confirm hypoxia within the AT, we then measured another key marker of hypoxia, GLUT1. GLUT1 was also significantly increased after ethanol treatment (Fig. 4(c) and (d)), which indicates that long-term ethanol exposure indeed results in the occurrence of hypoxia in adipocytes. On the basis of these findings, we believe that AT hypoxia after ethanol treatment contributes to glucose intolerance in rats. To our knowledge, the present study is the first study to focus on AT hypoxia as the mechanism that underlies the action of ethanol on diabetes. Hitherto, the precise mechanism of hypoxia has not been well elucidated. One possible mechanism is that has been suggested involves the enlargement of adipocytes after ethanol treatment( Reference Feng, Song and Guan 3 ); the hypertrophic adipocytes can increase in size to 200 μm in diameter( Reference Skurk, Alberti-Huber and Herder 10 ), but the maximum diffusion of oxygen is only 100 μm( Reference Helmlinger, Yuan and Dellian 11 ). Hodson et al. ( Reference Hodson, Humphreys and Karpe 49 ), however, possessed the completely opposite opinion: they thought that although delivery of O2 to the obese AT is reduced, VO2 is low and the metabolic signatures of human AT do not support the notion of a hypoxic state in obesity. Further research needs to be carried out on this issue.
AT hypoxia is the deprivation of adequate oxygen from AT, which then results in widespread systemic inflammation( Reference Tkacova, Ukropec and Skyba 35 ); this inflammation is characterised by the secretion of numerous proinflammatory cytokines( Reference Hodson, Humphreys and Karpe 49 , Reference Varma, Yao-Borengasser and Bodles 50 ). Of these, IL-6 and TNF-α play a leading role in the development of insulin resistance and diabetes( Reference Pradhan, Manson and Rifai 51 – Reference Tanko and Christiansen 54 ). TNF-α can modulate insulin signalling and induce insulin resistance in adipocytes( Reference Kern, Ranganathan and Li 55 ). Moreover, membrane-associated TNF-α is an autocrine regulator of IL-6 and thus is an amplifier of signals during the development of insulin resistance( Reference Coppack 56 ). AT expression and serum levels of IL-6 are closely related not only to glucose tolerance and insulin resistance but also to an increased incidence of type 2 diabetes( Reference Pradhan, Manson and Rifai 51 ). In the present study, we demonstrated that the levels of TNF-α and IL-6 in VAT and cultured adipocytes were dramatically increased after ethanol treatment, and their circulating levels were subsequently elevated (Fig. 5). This might indicate that low-grade inflammation occurred in ethanol-treated rats and cultured adipocytes, which can then result in diabetes. The present findings are partly consistent with previous reports( Reference Fernandez-Real and Ricart 57 , Reference Winkler, Kiss and Keszthelyi 58 ).
The findings show that chronic ethanol treatment induced inflammation within AT by increasing the expression of TNF-α and IL-6. However, TNF-α production was not directly stimulated by hypoxia, and IL-6 expression as a result of low oxygen occurred through an HIF-1 independent pathway. To verify whether AT inflammation was associated with changes in HIF-α after the ethanol treatment, we then measured the expression of leptin and VEGF, the key inflammation-related adipokines, whose expression was hypoxia-sensitive via HIF-1α( Reference Yla-Herttuala, Rissanen and Vajanto 59 – Reference Thangarajah, Yao and Chang 61 ). Leptin is also considered to up-regulate pro-inflammatory cytokines, such as TNF-α and IL-6, which are associated with insulin resistance and T2DM( Reference Lopez-Jaramillo, Gomez-Arbelaez and Lopez-Lopez 62 ). As we expected, the expressions of both leptin and VEGF in rat epididymal AT were elevated after the ethanol treatment (Fig. 6). These results imply that the occurrence of inflammation within AT might be a secondary effect of hypoxia after long-term heavy ethanol consumption, and it can eventually lead to whole-body insulin resistance( Reference Girman, Rhodes and Mercuri 63 , Reference Solymoss, Bourassa and Campeau 64 ).
Lastly, although we considered GLUT1 as a hypoxia marker gene in the present study, it is most famous as a glucose transporter. The present results showed that the expression of GLUT1 was increased after ethanol consumption, which suggests that glucose disposal in VAT should be enhanced. However, we and others have found that chronic heavy ethanol impaired glucose disposal in both skeletal muscle and AT( Reference Feng, Song and Guan 3 , Reference Feng, Han and Wang 25 , Reference Wan, Liu and Guan 29 ). The reason for this discrepancy was that the main GLUT in skeletal muscle and AT is GLUT4, not GLUT1. GLUT4 expression was dramatically decreased after heavy ethanol consumption. Furthermore, GLUT1 is only responsible for basal glucose transport, whereas GLUT4 mainly subserves the insulin-responsive glucose transport function( Reference Ganguly and Devaskar 65 ). Thus, GLUT4 contributes more to glucose disposal in skeletal muscle and AT than GLUT1 does.
In conclusion, chronic heavy ethanol consumption causes VAT deposit, which subsequently results in hypoxia and inflammation within the tissue. This might be a new mechanism for understanding ethanol's effect on glucose metabolism.
Acknowledgements
The authors thank Professor Jianfeng Li for helping with the English writing of the manuscript.
The present work was supported by grants from the National Natural Science Foundation of China (grant no. 81000323) and the Natural Science Foundation of Shandong Province, China (grant no. ZR2009CM067). The National Natural Science Foundation of China and the Natural Science Foundation of Shandong Province had no role in the design, analysis or writing of the present article.
The authors' contributions are as follows: L. F. formulated the research question, designed the study and wrote the article. Z. H. and M. L. carried out the experiments, analysed the data and wrote the article. D. Z., Q. C. and W. L. carried out the experiments.
The authors have no conflicts of interest.


