


Food ingestion and energy expenditure maintain body weight and energy reserves for the adaptation of an organism to its environment and to respond to sudden changes of food scarcity( Reference Luquet and Cruciani-Guglielmacci 1 ). Eating behaviour is modulated by several factors such as palatability, odour and texture of foods, and also by emotional situations such as stress and anxiety( Reference Denis, Cansell and Castel 2 ). High consumption of palatable and energy-rich food largely contributes to eating behaviour disorders. Hence, food intake responds to hedonic requirement in addition to hunger signals, and consequently, an organism develops overeating that might contribute to obesity and type 2 diabetes, known to be associated with a perturbation in hypothalamic satiety and hunger centres( Reference Eckel, Grundy and Zimmet 3 ).
At present, there are 1·6 billion overweight subjects and 400 million obese subjects( Reference Karra and Batterham 4 ). The prevalence of diabetes in Algeria has increased from 6·8 % in 1990 to 12·29 % in 2005, but is quite higher among certain groups and areas of the country( Reference Lamri, Gripiotis and Ferrario 5 ). This disease affects all population groups, especially 35- to 70-year-olds, who constitute a large segment of the working population in Algeria( Reference Lamri, Gripiotis and Ferrario 5 ). Although the susceptibility to develop type 2 diabetes is based, in part, on genetic predisposition( Reference Esparza-Romero, Valencia and Martinez 6 ), dietary habits play a key role in its pathogenesis. The Mediterranean diet has been shown to be associated with better glycaemic control in patients with newly diagnosed diabetes( Reference Esposito, Maiorino and Ciotola 7 ). Another study has shown that the Mediterranean diet had a protective effect against diabetes( Reference Salas-Salvado, Bullo and Babio 8 ).
The concept of restrained eating is originally introduced to define a type of eating behaviour pattern (EBP) governed by cognitive processes rather than by physiological mechanisms such as hunger and satiety( Reference Herman and Mack 9 ). As measured by the activation of corticotropic axis (CA) during behaviour disorders related to eating pattern/habits, restrictive eating has been found to be a causal factor for high secretion of cortisol( Reference McLean, Barr and Prior 10 ). Boullu-Ciocca et al. ( Reference Boullu-Ciocca, Verger and Bocquier 11 ) reported that activation of CA might contribute to the development of insulin resistance and metabolic syndrome in the EBP. Brindley & Rolland( Reference Brindley and Rolland 12 ) proposed that there might be a relationship between stress-induced hormones and the metabolic syndrome. In stressful conditions, glucocorticoids (GC), released by CA, might decrease energy expenditure and, together with insulin, promote energy deposition. These observations provide a partial explanation for the metabolic changes that can accompany the risk factors for diabetes and atherosclerosis. Duong et al. ( Reference Duong, Cohen and Convit 13 ) explored the relationship between cortisol levels, poor blood glucose control and food quality choice in diabetic patients. These authors reported that there exists a relationship between glycosylated Hb (HbA1c) concentrations and low-quality food choice that is mediated by cortisol via poor control of hypothalamic–pituitary–adrenal axis in diabetic patients( Reference Duong, Cohen and Convit 13 ).
GC have been shown to exert either stimulatory or inhibitory actions on growth hormone (GH) secretion by influencing both hypothalamic and pituitary functions( Reference Thakore and Dinan 14 ). GC exert negative effects via hypothalamus by inhibiting growth hormone-releasing hormone (GHRH), and stimulating synthesis and release of somatostatin( Reference Senaris, Lago and Coya 15 ). In contrast, GC via pituitary have been shown to stimulate GH( Reference Evans, Bimberg and Rosenfeld 16 ) and GHRH receptor gene expression( Reference Korytko and Cuttler 17 ). High concentrations of cortisol have been shown to decrease peripheral GH levels( Reference Allen, Julius and Breen 18 ), and small increases in cortisol concentrations exert a stimulatory effect on GH secretion by increasing GH mRNA levels( Reference Miller and Mayo 19 ). GC therapy perturbs GH/insulin-like growth factor 1 axis by decreasing hepatic GH receptor and plasma levels of GH binding proteins( Reference Hochberg 20 ). However, no study is available on the interrelationship between activation of CA, GH secretion and type 2 diabetes along with obesity. In the present study, we, therefore, tried to shed light on the implication of CA in obese and diabetic Algerian participants in relation with EBP.
Materials and methods
Subjects
The present study included age-matched 410 participants who were divided into four groups, i.e. 170 patients with type 2 diabetes (seventy-six normal-weight diabetics and ninety-four overweight diabetics), 130 obese participants and 110 healthy participants. The study was followed-up in the Diabetology Department, Mohamed-Seghir Nekache Hospital, Algiers. The exclusion criteria were cardiovascular or renal or any other complications, smoking habits and any medical treatment that may alter feeding behaviour. All participants were followed-up for the nutritional education in a daily hospital consultation. The diabetics received a treatment as per indication of HbA1c levels. Subjects with HbA1c level < 7 % were given metformin (twice, 850 mg/d), and those with HbA1c level >7 % were given metformin (twice, 850 mg/d) plus Daonil (twice, 2·5 mg/d). A fact sheet was prepared for the diagnosis of any complications in the recruited participants. The participants were interrogated for any family history of obesity and diabetes. Drug dosages were stable for at least 3 months. Throughout the study, no microbial infections were noticed. The duration of diabetes varied between 5 and 15 years. The study was conducted between 1 January 2010 and 31 March 2013. The clinical protocol was approved by the ethics committee of the Algerian Ministry of Public Health according to the Declaration of Helsinki.
Three-Factor Eating Questionnaire
The test of Three-Factor Eating Questionnaire (TFEQ) was considered as the most reliable approach for the evaluation of EBP( Reference Stunkard and Messick 21 ). The TFEQ contains fifty-one questions or test items, twenty-one questions represent the cognitive restriction (R), sixteen represent disinhibition (D) and fourteen correspond to ‘susceptibility’ to hunger (H). As per scores, R, D and H were considered as low if the values were 0–10, 0–8 and 0–7, respectively( Reference Stunkard and Messick 21 ). The values >10, >8 and >7 of R, D and H, respectively, were considered to be high( Reference Stunkard and Messick 21 ). The results are presented as mean scores.
The TFEQ is based on distinct components of eating behaviour: restraint; disinhibition; hunger. Restraint reflects the degree to which a person exerts behavioural control over his own eating behaviour. Dietary restraint refers to limit the food intake in order to maintain the body weight. It represents the cognitive control of eating behaviour, contrary to physiological control, such as hunger and satiety. Disinhibition is an eating behaviour trait associated with overeating and eating opportunistically. Dietary disinhibition is usually prevalent in subjects who are food restricted but lose control in response to certain stimuli such as food palatability( Reference Polivy, Herman and Coelho 22 ), anxiety or depressed mood( Reference Calderon, Forns and Varea 23 ). Hunger, in relation to the TFEQ, reflects a person's stable underlying sensitivity to hunger feelings and predisposition to eat( Reference French, Mitchell and Finlayson 24 ).
Metabolic syndrome criteria
In the present study, the definition of metabolic syndrome followed the criteria of the National Cholesterol Education Program-Adult Treatment Panel III (NCEP-ATPIII) as described by Athyros et al. ( Reference Athyros, Ganotakis and Elisaf 25 ). These metabolic syndrome criteria apply if three out of five risk factors are met in the subjects( Reference Balkau, Valensic and Eschwègea 26 ), i.e. (1) TAG: ≥ 1·69 mmol/l (1·50 g/l); (2) HDL-cholesterol: men, < 1·04 mmol/l (0·40 g/l); women, < 1·29 mmol/l (0·50 g/l); (3) blood pressure: systolic ≥ 130 mmHg, diastolic ≥ 85 mmHg; (4) fasting glucose: ≥ 6·1 mmol/l (1·10 g/l); (5) abdominal obesity, as measured by waist circumference (WC). Abdominal obesity was confirmed if the WC was >102 cm for men and >88 cm for women. The state of insulin resistance in obese and diabetic participants was determined by homeostasis model assessment, determined by the following formula( Reference Matthews, Hosker and Rudenski 27 ):
 $$\begin{eqnarray} insulin\,(mU/l)\times glucose\,(mmol/l)/22.5. \end{eqnarray}$$
Sampling and analysis
Venous blood samples were taken after an overnight fast (12 h). Serum glucose, TAG, total cholesterol, HDL and LDL levels were analysed by spectrophotometric techniques (Roche). Fructosamine was determined by colorimetric method using the technique of Flückiger et al. ( Reference Flückiger, Woodtli and Berger 28 ). Insulin, cortisol, GH and adrenocorticotropin hormone (ACTH) levels were determined in the plasma. The hormones were quantified by RIA (BioMérieux). Anthropometric measurements were taken in order to calculate BMI according to the formula:
 $$\begin{eqnarray} BMI = weight\,(kg)/height\,(m^{2}). \end{eqnarray}$$
Statistical analysis
Statistica 10·0 software was used for statistical calculations. ANOVA test was used for comparisons between all groups and controls. The results are presented as means and standard deviations, with a significance level, P< 0·05. For the study of EBP, the data were processed by multivariate analysis to assess the contribution of three factors of the TFEQ. The Pearson correlation coefficient was used to quantify associations between BMI and WC, and each of the three test factors.
Results
Eating behaviour pattern in healthy, obese and diabetic participants
Obese participants had a higher disinhibition, associated with hunger, compared with healthy participants (Table 1). However, these participants show a low restraint score. Interestingly, there was no significant correlation between BMI and restraint in obese participants (Table 2). Disinhibition trait was correlated with BMI and WC in obese participants (Table 3).
Table 1 Eating behaviour pattern in healthy, obese and diabetic participants (Mean values and standard deviations)

TFEQ, Three-Factor Eating Questionnaire.
Mean values were significantly different from that of the healthy participant group: * P< 0·05, ** P< 0·01.
Table 2 Eating behaviour pattern correlation with BMI in obese and diabetic participants

TFEQ, Three-Factor Eating Questionnaire; r, correlation coefficient.
* P< 0·05.
** P< 0·01.
Table 3 Correlation of disinhibition with BMI and waist circumference (WC) in obese and diabetic participants

r, correlation coefficient.
** P< 0·01.
* P< 0·05.
*** P< 0·001.
The normal-weight and overweight diabetic participants exhibit a significant degree of restriction compared with controls (Table 1). The diabetics clearly exhibited three types of EBP, i.e. restraint, disinhibition and hunger (Table 1). We further observed that disinhibition was correlated with BMI and WC in diabetic participants; however, disinhibition was highly correlated with WC in overweight diabetics v. normal-weight diabetics. Overweight diabetics show a stronger correlation between BMI and disinhibition (Table 3).
Anthropometric status
BMI is more than 30 kg/m2 in the obese group (Table 4). WC confirms an abdominal adiposity in obese participants (Table 4). WC parameters show that diabetic patients exhibit abdominal adiposity which is more pronounced in overweight diabetics than normal-weight diabetics.
Table 4 Anthropometric status in obese and diabetic participants (Mean values and standard deviations)

WC, waist circumference.
Mean values were significantly different from that of the healthy participant group: ** P< 0·01, *** P< 0·001.
Glucose tolerance and insulin resistance
Obese participants are normoglycaemic (Table 5). However, diabetic patients had fasting hyperglycaemia level more than 7 mmol/l. Fructosamine (exceeding to 0·31 mmol/l) followed the same pattern. This reflects the chronic state of hyperglycaemia in diabetic patients. In obese participants, fructosamine levels are normal, concomitant with normoglycaemia levels in fasting state.
Table 5 Metabolic parameters in obese and diabetic participants (Mean values and standard deviations)
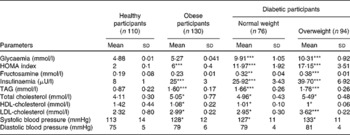
HOMA, homeostasis model assessment.
Mean values were significantly different from that of the healthy participant group: * P< 0·05, ** P< 0·01, *** P< 0·001.
In obese and diabetic patients, hyperinsulinaemic state was observed, comparatively with healthy participants (Table 5); this state was exacerbated in overweight diabetics. Insulin levels are significantly higher in these participants than in controls. Homeostasis model assessment values are very high in both diabetic and obese participants, the highest being in the overweight diabetic group (Table 5).
Haemodynamic and atherogenic lipid status
Table 5 shows that dyslipidaemia is apparent in both obese and diabetic patients, particularly in overweight diabetics. TAG and total cholesterol levels are enhanced significantly compared with healthy participants. Systolic blood pressure was significantly higher in obese and all diabetic participants than in healthy controls.
Cortisol, adrenocorticotropin hormone and growth hormone concentrations
Serum cortisol and ACTH concentrations are altered in obese and diabetic patients. Table 6 shows that cortisol level is higher in obese and diabetic participants than in controls (an increase of 22·22 % in obese participants and 33 % in normal-weight diabetics), overweight diabetics show a highest increase. ACTH levels are decreased by 41·66 % in obese participants, 57 % in normal-weight diabetics and 70 % in overweight diabetics compared with healthy participants. The GH secretion shows a decrease of 53·42 % in obese participants and 64 % in overweight diabetic participants, compared with control participants. No significant difference was observed in GH secretion between normal-weight diabetic and healthy participants (Table 6).
Table 6 Hormone levels in obese and diabetic participants (Mean values and standard deviations)

ACTH, adrenocorticotropin hormone; GH, growth hormone.
*** Mean values were significantly different from that of the healthy participant group (P< 0·001).
Discussion
Food consumption is a behavioural aspect that regulates energy metabolism of the organism. In the present study, we observed the absence of dietary restraint, although disinhibition and hunger were increased in obese participants, indicating the presence of hyperphagic type of EBP in these individuals. Disinhibition predicts the compulsive type of food intake( Reference Galanti, Gluck and Geliebter 29 ). Generally, individuals with high disinhibition have the tendency to overeat in response to different stimuli. In obese and type 2 diabetic participants, we observed a significant correlation between disinhibition scores and BMI, and WC, although overweight diabetics showed the strongest correlation. The present study corroborates several reports that have demonstrated a relationship between disinhibition and high BMI in obese participants( Reference French, Epstein and Jeffery 30 – Reference Wadden, Foster and Sarwer 37 ). Our observations strengthen the notion that disinhibition, a key component of obesity, would be a predictor of weight gain( Reference Bellisle, Clément and Le Barzic 33 , Reference Chaput, Leblanc and Perusse 38 , Reference Yanovski 39 ). With regard to the physiological explanation of disinhibition, it is possible that there might be low circulating concentrations of YY peptide in obese participants( Reference Bottcher, Sjolund and Ekbad 40 ). Martins et al. ( Reference Martins, Robertson and Morgan 41 ) demonstrated that decreased YY peptide concentrations in the postprandial state might create a susceptibility to over-consumption of food and increased risk for weight gain( Reference Martins, Robertson and Morgan 41 ).
All the diabetic patients exhibited three types of eating patterns, as reported by Ryan et al. ( Reference Ryan, Gallanagh and Livingstone 42 ). Diabetics seem to deliberately restrict their food intake to control their weight gain and blood glucose levels. While rigid restraint has been associated with a greater tendency to overeat and poorer weight control, flexible restraint predicts better weight control and reduced overeating( Reference Westenhoefer, Von Falck and Stellfeldt 43 ). We observed that diabetic patients controlled their food intake to avoid pathological complications. It has been proposed that the food restraint should be considered as a cognitive causal factor in weight gain( Reference Allen, Byrne and La Puma 44 ) and onset of EBP( Reference Rigaud 45 ).
WC was positively correlated with obesity and diabetes in the present study. An increase in WC has been shown to contribute to the pathogenesis of the metabolic syndrome( Reference Tartaglia, Dembski and Weng 46 ). Freedland( Reference Freedland 47 ) showed that obesity was positively correlated with the expansion of the volume of visceral adipose tissue, and visceral obesity was strongly associated with the metabolic syndrome. In the present study, the homeostasis model assessment index confirms the state of insulin resistance in obese and diabetic groups. The relationship between homeostasis model assessment, WC and insulin resistance in these subjects is consistent with previous literature( Reference Ribeiro-filho, Faria and Kohlmann 48 ). Nevertheless, glucose and fructosamine were normal in obese participants. Obese and diabetic participants exhibited elevated TAG levels, associated with a decrease in HDL concentrations, and an increase in LDL concentrations. Low HDL concentration has been reported to be associated with a subsequent risk of type 2 diabetes, with a greater effect in the presence of obesity( Reference Gautier, Balaku and Lange 49 ). The metabolic syndrome and type 2 diabetes have been associated with decreased HDL concentrations, hypertriacylglycerolaemia and obesity( Reference Vergès, Brun and Vaillant 50 ).
With regard to the concentrations of cortisol and ACTH which are, respectively, higher and lower in obese and diabetic, particularly overweight diabetic, participants than controls, we can state that the former might exert a negative feedback control on the latter during these pathologies. In addition, high circulating cortisol may not be secreted from the adrenal glands as ACTH is low; however, other peripheral tissues, such as adipose tissue, may be the site of its production as suggested elsewhere( Reference Iovino, Paquot and Scheen 51 ). In view of anthropometric and metabolic alterations associated with insulin resistance in diabetic participants, we suggest that GC might be involved in the genesis of the metabolic syndrome, as reported by Iovino et al. ( Reference Iovino, Paquot and Scheen 51 ), in type 2 diabetic patients. Growing evidence suggests that the metabolic syndrome and central obesity may result from an increased availability of GC at the tissue level (mainly the liver and the adipose tissue)( Reference Anagnostis, Athyros and Tziomalos 52 ). GC have been reported to exert an action on the differentiation of preadipocytes into adipocytes, which might aggravate adiposity( Reference Paulmyer-lacroix, Boullu-ciocca and Oliver 53 ). Conversely, GC may also increase the activity of 11β-hydroxysteroid dehydrogenase-1 (11β-HSD-1)( Reference Baudrand, Dominguez and Carvajal 54 ). Hence, 11β-HSD-1 will produce cortisol that will either induce the proliferation of preadipocytes or promote the differentiation of these cells into adipocytes( Reference Weaver, Thaventhiran and Noonan 55 ). The present results on the decrease in GH levels in obese and overweight type 2 diabetic participants indicate that reduced GH might be responsible for high 11β-HSD-1 activity and would contribute to high GC levels as reported elsewhere in obese participants( Reference Bujalska, Walker and Hewinson 56 ).
In conclusion, the present findings show the implication of EBP in obesity and diabetes, where disinhibition was strongly associated with weight gain and insulin resistance. EBP may lead to obesity and metabolic syndrome, associated with hyperactivity of pancreatic β cells and adrenal and pituitary glands. The counselling of EBP may improve metabolic, hormonal and anthropometric parameters. Different strategies, oriented to the cognitive control of food intake, should be considered key tools in controlling obesity and associated pathologies.
Acknowledgements
The present study was supported by grants from the National Research Program (PNR no. 208 and 41/ANDRS/2011), the National Administration of Algerian Higher Education and Scientific Research (DG-RSDT) and a bilateral Franco-Algerian collaborative project ‘Tassili’ (grant no. 12MDU855). This study received no specific grant from any commercial or not-for-profit sectors. The funders had no role in the design and analysis of the study or in the writing of this article.
The authors' contributions are as follows: N. A. K. and E. A. K. designed the study (project conception, development of overall research plan and study oversight); H. B. conducted the study (hands-on conduct of the experiments and data collection); N. A. K., E. A. K. and H. B. wrote the manuscript; E. M. H. and G. K., B. O. provided the facilities in the sample collections. All authors have read and approved the final content of the manuscript.
None of the authors has any conflict of interest to declare.


