


Many theories in political science rely on ideology at their core, whether they are explanations for individual behavior and preferences, governmental relations, or links between them. However, ideology has proven difficult to explicate and measure, in large part because it is impossible to directly observe: we can only examine indicators such as responses to survey questions, political donations, votes, and judicial decisions. One problem with this patchwork of indicator measures is the difficulty of studying ideology across domains. Although we have established reliable techniques for measuring ideology among individuals and legislators, such as survey measures and roll-call vote analysis, methods for jointly estimating the ideologies of ordinary citizens and elite actors have only recently been developed.
To understand the relationship between elite ideology and beliefs of ordinary citizens, we need measures of ideology that allow us to place ordinary citizens and elites in the same ideological space. For example, a longstanding debate in political science concerns whether the American public has become more ideologically polarized in the last 40 years (e.g., Abramowitz and Saunders Reference Abramowitz and Saunders2008; Fiorina, Abrams, and Pope Reference Fiorina, Abrams and Pope2006). If so, does mass polarization drive elite polarization, or vice versa? To test these theories, we need joint ideology measures that put elite actors and ordinary citizens on the same scale.
The lack of comparable ideological estimates for individuals and elites can be attributed in part to a paucity of suitable data. Although scholars continue to develop methods that use text as data to measure ideology (Laver, Benoit, and Garry Reference Laver, Benoit and Garry2003; Monroe, Colaresi, and Quinn Reference Monroe, Colaresi and Quinn2009; Monroe and Maeda Reference Monroe and Maeda2004), text data have problems that are yet unsolved—in addition to problems related to human language’s high dimensionality, more fundamental problems can confound such efforts: not only are data on how ordinary citizens talk about issues related to ideology sparse, but also the context of communication for elites and ordinary citizens often differs, and each may use different language to describe the same underlying ideological phenomena (polysemy), or use the same language to describe different things (synonymy). While complex data such as human language may one day provide a superior measure of something as complex as ideology, further tools need to be developed to address these issues.
The most promising avenues for estimating ideology comprise discrete behavioral data that reveal preferences, including roll-call votes (Poole and Rosenthal Reference Poole and Rosenthal1997), cosponsorship records (Aleman et al. Reference Aleman, Calvo, Jones and Kaplan2009), campaign finance contributions (Bonica Reference Bonica2013), and—as in this article—expressions of support for elites by ordinary citizens. Previously, obtaining sufficiently large behavioral datasets about ordinary citizens’ political preferences has been cost prohibitive. Using large data sources, such as campaign contributions and online data, we are now able to use methods similar to those used on political elites to estimate the ideology of a broader set of political actors. These large-scale data sources allow researchers to view ideology at a more “macro” level, with the ability to couple the ideological estimates produced with other data sources. Using vast, emerging data sets like these allows political scientists to study ideology from new perspectives (Lazer et al. Reference Lazer, Pentland, Adamic, Aral, Barabasi, Brewer, Christakis, Contractor, Fowler, Gutmann, Jebara, King, Macy, Roy and Alstyne2009).
Although methods for jointly scaling elites and masses using campaign finance records are promising (Bonica Reference Bonica2013), they should constitute the beginning of our efforts to produce measures that allow us to place elites and ordinary citizens on the same scale. While estimates based on campaign finance (or CFscores) extend available data beyond law-makers, they are restricted to a particular type of ideological expression—giving money to campaigns, a behavior limited to class of individuals who have substantial financial resources and who choose to express their ideological preferences with money. Only donors who give at least $250 to a particular campaign are named in campaign finance reports, though many give to campaigns in much smaller amounts—46% of Barack Obama’s 2008 presidential campaign donations were $200 or less (Malbin Reference Malbin2009). While CFscores extends our ability to estimate ideological positions from politicians to PACs, the citizen-level estimates it produces cover an elite class of private donors who give large amounts to campaigns. Our ability to use such estimates to draw inferences about the ideological preferences for the voting public at large is limited.
In this article, we contribute to the effort to jointly measure elite and mass ideology using social media data. In contrast to donations, candidate endorsements in social media do not entail any financial outlay; any individual with an account may endorse any political entity she wishes. Furthermore, individuals can endorse any political entity that has a presence on the platform, meaning that such data allow for joint estimation of ideology for individuals and a broad range of political actors. This ideology measure is not fully representative—individuals who endorse political entities in social media have higher levels of political interest than average citizens, while individuals who are active in social media generally have higher levels of education and income. Nonetheless, this approach offers significant advantages. For instance, individuals in this data set need not overcome costly structural barriers to express their support of political candidates, nor do they comprise a limited, homogenous group of donors—instead they are drawn from a much broader swath of society. The potential generalizability of these data provides a compelling reason to examine and validate the ideological estimates it produces.
We proceed as follows: first we review the extant literature on methods for measuring ideology, both in populations of elites and for ordinary citizens. Following that, we explain how our social media endorsement data are structured and the how they are applicable to estimating ideology. Next, we describe our estimation technique and the resulting estimates. We then validate our estimates against other measures of ideology for both the elite and mass populations. The next sections apply the measure, investigating the relationship between age and ideology, ideology’s structure in social networks, and whether having friends with more distant ideologies decreases the likelihood of voting. Last, we conclude with a discussion of how this technique opens directions in the study of ideology and suggest future work using these data.
MEASUREMENT OF IDEOLOGY
Political scientists have generally measured ideology by asking individuals to place themselves on a 7-point liberal-conservative scale.Footnote 1 Although this measure’s ubiquity allows us to compare ideology across studies and across time, recent work has shown that it has a number of methodological problems. It cannot account for the multidimensionality of ideology (Feldman Reference Feldman1998; Treier and Hillygus Reference Treier and Hillygus2009)—respondents might place themselves on a social, political, or economic ideology scale, or perhaps some combination thereof. The measure is recorded as an interval rather than a continuous measure (Jackson Reference Jackson1983; Kinder Reference Kinder1983), making it difficult to analyze with conventional statistical techniques. The measure also lacks reliability. Survey respondents may interpret the question differently, particularly respondents with liberal ideologies who are hesitant to be labeled “liberal” (Ansolabehere, Rodden, and Snyder Reference Ansolabehere, Rodden and Snyder2008; Schiffer Reference Schiffer2000). Although these issues are not so problematic that the measure should be abandoned, and researchers have proposed methods for addressing these concerns (Wood and Oliver Reference Wood and Oliver2012), they suggest that other measures should be explored.
Techniques to measure the ideology of political elites frequently use the choices that elites make as data from which an ideology measure may be deduced. The most well known of these techniques is the NOMINATE method of ideal point estimation using roll-call votes for members of Congress (Poole and Rosenthal Reference Poole and Rosenthal1997). Methods of ideal point estimation have been examined further in Congress (Clinton, Jackman, and Rivers Reference Clinton, Jackman and Rivers2004), and extended to other types of elite actors, such as members of the Supreme Court (Martin and Quinn Reference Martin and Quinn2002) and European Parliament (Hix, Noury, and Roland Reference Hix, Noury and Roland2006). These techniques have provided researchers with estimates of the ideal points of actors within a given institution, but have largely left researchers without tools to compare the ideology of actors across them.
Typically, one cannot estimate the ideologies of a diverse set of political actors because they make disjoint choices. In order to jointly estimate the ideologies of actors with (primarily) disjoint choice sets one must have some set of choices that “bridges” choice divides (Bafumi and Herron Reference Bafumi and Herron2010; Bailey Reference Bailey2007; Gerber and Lewis Reference Gerber and Lewis2004; Poole and Rosenthal Reference Poole and Rosenthal1997). As with campaign contributions, Facebook’s data on which users support which candidates represent the bridge actors necessary to jointly estimate the ideology of politicians and ordinary citizens. Users are able to “like” pages regardless of their political institution, meaning that all pages are part of the same choice set. Bridge actors, such as Facebook users or donors, serve two important purposes. First, they bridge actors that otherwise would not be connected, such as members of Congress and mayors of cities. Second, they span the divide between politicians and individuals.
To put elite political actors and ordinary citizens on the same ideological scale we use data from Facebook that mitigate limitations that previous measures of ideology faced in terms of bridging diverse sets of elite actors and including measures of the ideology of ordinary citizens. For Facebook users, showing support for political figures is simple, relatively costless, and requires little cognitive effort. Our approach uses singular value decomposition (SVD) on the transformed matrix of user to political page connections on Facebook to estimate the ideological positions of Facebook users and the political pages they support. These estimates are consistent with the first ideological dimension recovered from roll-call data (Clinton, Jackman, and Rivers Reference Clinton, Jackman and Rivers2004; Poole and Rosenthal Reference Poole and Rosenthal1997) and with individuals’ self-reported political views indicated on the user’s Facebook profile page.
SOCIAL MEDIA ENDORSEMENT DATA
Social media serves not only as a platform to communicate with social contacts and share digital media, but also as a forum for political communication. As more individuals utilize this forum, they create rich data sources that can be used to understand political phenomena.Footnote 2 Political scientists have begun to study how people engage and express their political viewpoints online using this rich data source (e.g., Barberá 2014, Bond et al. Reference Bond, Fariss, Jones, Kramer, Marlow, Settle and Fowler2012; Butler and Broockman Reference Butler and Broockman2011; Butler, Karpowitz, and Pope Reference Butler, Karpowitz and Pope2012; Grimmer, Messing, and Westwood Reference Grimmer, Messing and Westwood2012; Messing and Westwood Reference Messing and Westwood2012; Mutz and Young Reference Mutz and Young2011; Wojcieszak and Mutz Reference Wojcieszak and Mutz2009).
Social media enable ordinary citizens to endorse and communicate with political figures and elites. On Facebook, in addition to displaying demographic, educational, and professional information in their profile, users can “like” pages associated with figures such as politicians, celebrities, musicians, television shows, books, movies, etc. Users do so by listing such entities on their profile, by visiting a politician’s page on Facebook, or they may be prompted to like pages by friends. Liking political figures may be communicated to the user’s social community via the political figure’s page, the user’s page, and the “news feed” homepage that friends of the user see. Liking pages makes the user a “fan” of that page, meaning that the individual may see content published on the page in their news feed. Facebook also maintains an accounting of pages that are “official.”Footnote 3 We scale ideology for both users and political figures using endorsements of official pages.
Facebook is an especially appropriate platform to examine the suitability of social media data to generate joint ideological estimates. On Facebook, users self-report demographic and political data, making it possible to cross-reference these estimates with self-reported ideological measures, and examine variation by demographic category. We can validate legislators’ ideological estimates based on traditional measures such as DW-NOMINATE. Hence, our method can be extended to other social networking sites where public data on the politicians individuals endorse and follow are readily available to researchers, including Twitter. However, because Facebook collects demographic data, including self-reported political affiliation, it serves as a more appropriate platform to validate this approach.
For most results below, we used data collected on March 1, 2011 from all U.S. users of Facebook over age 18 who had publicly liked at least two of the official political pages on Facebook. This constituted 6.2 million individuals and 1,223 pages. Only official pages identified by Facebook were included. We also collected data from March 1, 2012 to see for whom ideology changed year over year. Finally, we collected data from November 2, 2010, the day of the Congressional election that year, in order to calculate an ideology score that we use to study its relationship to voting, as explained below. All data were de-identified.
USING SOCIAL MEDIA DATA TO SCALE IDEOLOGICAL POSITIONS
Unlike roll-call data that are ideal for scaling, social media endorsements, much like campaign contribution data, require some processing prior to scaling. Roll-call data are well suited for scaling because votes are coded as either “yea” or “nay,” and abstentions may be simply treated as missing data. For both Facebook and campaign contribution data, the presence of relationships is clear, but the absence of a relationship is ambiguous.Footnote 4 The lack of a supporting relationship may be related to ideological considerations, lack of knowledge about the candidate, or an unwillingness to make their supportive relationships public. As with campaign contribution data, Facebook users may choose to support any combination of political figures. Although this is also the case for campaign contributions, giving to candidates is influenced by an individual’s budget, which may preclude an individual from giving to the full set of candidates she supports, or from giving at all. Nothing precludes a Facebook user from supporting a candidate and her opponent. One approach to simplify the analysis treats the data as choices between incumbent-challenger pairs. However, many of the political figures we wish to scale run for office against minimal opposition or do not run for office at all, meaning that their opposition has few or no supporters.
Model of Endorsement
Suppose n users choose whether to like m candidates. Each user i = 1, . . ., n chooses whether to like candidate j = 1, . . ., m by comparing the candidate’s position at ${\bm \zeta\ }_j$
and the status quo (in this case, not publicly supporting the candidate) located at ψ
j
, both in
R
d
, where d = dimensions of ideology space. Let
${\bm \zeta\ }_j$
and the status quo (in this case, not publicly supporting the candidate) located at ψ
j
, both in
R
d
, where d = dimensions of ideology space. Let
 \begin{eqnarray}
y_{ij} = \left\lbrace \begin{array}{ll}1 & \hbox{if user $i$ likes candidate $j$}, \\
0 & \hbox{otherwise.} \end{array} \right.
\end{eqnarray}
\begin{eqnarray}
y_{ij} = \left\lbrace \begin{array}{ll}1 & \hbox{if user $i$ likes candidate $j$}, \\
0 & \hbox{otherwise.} \end{array} \right.
\end{eqnarray}
User i receives utility for supporting candidates close to her own ideal point x i in R d policy space. We can specify this ideological utility as a quadratic loss function that depends on the location of the candidate and the status quo:
 \begin{eqnarray}
U_{ij}^{candidate} &=& -\Vert \bm {x}_i - \bm {\zeta\ }_j\Vert ^2, \nonumber \\
U_{ij}^{status\ quo} &=& -\Vert \bm {x}_i - \bm {\psi\ }_j\Vert ^2.
\end{eqnarray}
\begin{eqnarray}
U_{ij}^{candidate} &=& -\Vert \bm {x}_i - \bm {\zeta\ }_j\Vert ^2, \nonumber \\
U_{ij}^{status\ quo} &=& -\Vert \bm {x}_i - \bm {\psi\ }_j\Vert ^2.
\end{eqnarray}
The net benefit of liking is then the difference in these two utilities,
 \begin{eqnarray}
U_{ij}^{like} &=& U_{ij}^{candidate} - U_{ij}^{status\ quo} \nonumber \\
&=& -\Vert \bm {x}_i - \bm {\zeta\ }_j\Vert ^2 + \Vert \bm {x}_i - \bm {\psi\ }_j\Vert ^2.
\end{eqnarray}
\begin{eqnarray}
U_{ij}^{like} &=& U_{ij}^{candidate} - U_{ij}^{status\ quo} \nonumber \\
&=& -\Vert \bm {x}_i - \bm {\zeta\ }_j\Vert ^2 + \Vert \bm {x}_i - \bm {\psi\ }_j\Vert ^2.
\end{eqnarray}
Notice that the utility of liking is decreasing in distance between the candidate and the user, but increasing in the distance between the status quo and the user.
Finally, suppose also that the utility of liking is increased by candidate-specific factors ϕ j that govern how desirable each political page is (some pages are more popular and, perhaps, easier to find on the site) and user-specific factors η i that govern each user’s propensity to support candidates (some users get greater utility from the act of liking, and are thus more likely to engage in the activity than others). Putting these together with liking utility yields
 \begin{eqnarray}
U_{ij} = -\Vert \bm {x}_i - \bm {\zeta\ }_j\Vert ^2 + \Vert \bm {x}_i - \bm {\psi\ }_j\Vert ^2 + \eta _i + \phi _j.
\end{eqnarray}
\begin{eqnarray}
U_{ij} = -\Vert \bm {x}_i - \bm {\zeta\ }_j\Vert ^2 + \Vert \bm {x}_i - \bm {\psi\ }_j\Vert ^2 + \eta _i + \phi _j.
\end{eqnarray}
To group row and column terms into new variables, we let β j = ψ j − ζ j , and θ j = ψ 2 j − ζ 2 j + ϕ j . Thus (4) simplifies to
 \begin{eqnarray}
U_{ij} = -2\bm {x}_i \bm {\beta }_j + \eta _i + \theta _j.
\end{eqnarray}
\begin{eqnarray}
U_{ij} = -2\bm {x}_i \bm {\beta }_j + \eta _i + \theta _j.
\end{eqnarray}
We do not observe direct utilities, but we do observe likes. Suppose that observing a like means that the true utility of endorsing is high, while not observing one means that the true utility is low (without loss of generality, suppose the utilities are 1 and 0, respectively). Not all likes yield exactly the same utility, so we can think of the true utility as being equal to a function of the observed like (yij ) minus an error term (ν ij ):
 \begin{eqnarray}
U_{ij} = y_{ij} - \nu _{ij}
\end{eqnarray}
\begin{eqnarray}
U_{ij} = y_{ij} - \nu _{ij}
\end{eqnarray}
Substituting, we get
 \begin{equation}
y_{ij} = -2\bm {x}_i \bm {\beta }_j + \eta _i + \theta _j + \nu _{ij}.
\end{equation}
\begin{equation}
y_{ij} = -2\bm {x}_i \bm {\beta }_j + \eta _i + \theta _j + \nu _{ij}.
\end{equation}
To further simplify the model, we factor out the the η and θ terms by employing the double-center operator D(.) defined for a matrix Z to be each element minus its row and column means plus its grand mean divided by − 2:
 \begin{equation}
D(z_{ij}) = (z_{ij} - \bar{z}_{i.} - \bar{z}_{.j} + \bar{z}_{..})/(-2).
\end{equation}
\begin{equation}
D(z_{ij}) = (z_{ij} - \bar{z}_{i.} - \bar{z}_{.j} + \bar{z}_{..})/(-2).
\end{equation}
In the literature that utilizes roll-call votes to estimate ideology, Poole (Reference Poole2005) and Clinton, Jackman, and Rivers (Reference Clinton, Jackman and Rivers2004) discuss the use of the double-center operator on a squared distance matrix, not on the roll-call matrix itself. The effect of this operator is to generate a new matrix with all row and column means equal to zero. As a result, any term that does not interact with both a row and column variable will factor out of the matrix.
Suppose ν ij is an independent and identically distributed random variable drawn from a stable density. Suppose further, without loss of generality, that the dimension-by-dimension means of x and β equal 0. If so, then applying the double-center operator in equation (8) to both sides of equation (7) yields
 \begin{eqnarray}
D(y_{ij}) = \bm {x}_i \bm {\beta }_j + \epsilon _{ij},
\end{eqnarray}
\begin{eqnarray}
D(y_{ij}) = \bm {x}_i \bm {\beta }_j + \epsilon _{ij},
\end{eqnarray}
where the new error term ε ij is also a stable density defining the stochastic component of the identity. We can now use singular value decomposition (SVD) of the double-center matrix of likes to find the best d dimensional approximation of x i and β j (Eckart and Young Reference Eckart and Young1936):
 \begin{eqnarray}
D(\bm {Y}) = \bm {X} \bm {\Sigma } \bm {B},
\end{eqnarray}
\begin{eqnarray}
D(\bm {Y}) = \bm {X} \bm {\Sigma } \bm {B},
\end{eqnarray}
where Y is the observed matrix of likes, X is an n × n matrix of user ideology locations, Σ is a n × m matrix with a diagonal of singular values, and B is a m × m matrix of βs. The d largest singular values correspond to the d columns of X and d rows of B that generate the best fitting estimates of x i and β j (Eckart and Young Reference Eckart and Young1936).
Although it is possible to analyze the full matrix of likes from users to political pages, the candidate (ϕ j ) and user (η i ) specific factors mentioned above bias the estimation. Because some pages are so much more popular than others, and to a lesser extent because some users like many more politicians than average, the estimation yields ideological estimates that are weighted by the relative popularity of the candidates. For instance, Obama is to the extreme left of the distribution and Romney and Palin are to the extreme right, while candidates who have few likes are in the middle of the distribution regardless of their ideological views.
To account for political page- and user-specific factors, we compute a political page adjacency matrix, A = XX′, in which the rows and columns correspond to political pages and entries consist of the number of times an individual user likes both pages, and then compute the ratio of common users, corresponding to an agreement matrix, G = aij/diag(ai ), described in further detail below. We then apply SVD to the G matrix to estimate x i .
Estimation of Ideology from Endorsements
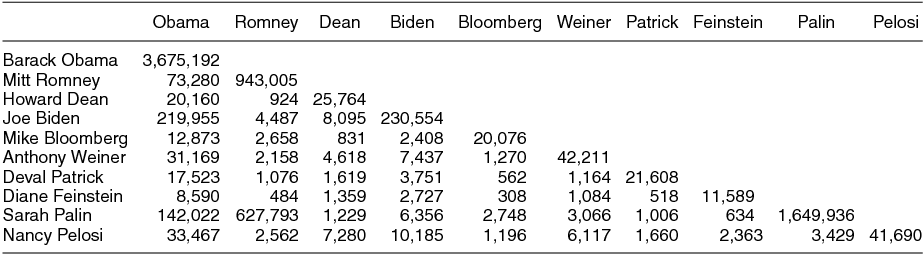
We begin by creating a matrix in which each column represents a user and each row represents an official Facebook page about politics. We limit our data to Facebook users in the United States who are over age 18 who endorse, or “like,” at least two political pages.Footnote 5 This leaves us with approximately 6.2 million users and 1,223 pages and 18 million like actions from users to pages. An example of the first ten rows and first ten columns of the bipartite matrix is in Table 1.
TABLE 1. The First Ten Rows of the User by Political Page Matrix
Note: Entries in the matrix are dichotomous, where 1 means that the user has liked the page and . means that the user has not.
A few things should be clear from this example and the summary statistics described here. First, there are few likes relative to the size of the matrix overall, making the matrix sparse. Second, users vary in the number of candidates they support. Although we limit the data to include users who like at a minimum two candidates’ pages, the average number of likes is 3.04 and the maximum number of pages liked is 625. Figure 1 shows the full distribution of the number of likes for users and the number of fans per page. Most users like only a few pages, but a few like many. Similarly, political pages vary in the amount of support from users they attract. The maximum number of fans of a page is 3.67 million (Barack Obama), with an average of 15,422.5 fans per page. Most pages have a few thousand fans.Footnote 6
FIGURE 1. The Left Panel Shows the Distribution of the Number of Pages that Each User Likes; the Right Panel Shows the Distribution of the Number of Fans that Each Page Has
To estimate ideology our approach is similar to the approach used by Aleman et al. (Reference Aleman, Calvo, Jones and Kaplan2009) to estimate the ideal points of legislators in the United States and Argentina using cosponsorship data, and is similar in principle to the use of Relational Class Analysis by Goldberg (Reference Goldberg2011) and Baldassarri and Goldberg (Reference Baldassarri and GoldbergForthcoming). Estimating separate parameters for users and pages, as is typical of estimation techniques like DW-NOMINATE or Bayesian analysis (Clinton, Jackman, and Rivers Reference Clinton, Jackman and Rivers2004), would be difficult on a large, sparse matrix. Instead, we construct an affiliation matrix between the political pages in which each cell indicates the number of users that like both pages. We do not use the original (two-mode) dataset of connections between users and political figures, which is organized as an X = r × c matrix, with r = 1, 2. . .R users and c = 1, 2. . .C pages, but instead use an affiliation matrix (Table 2), A = XX′. In this affiliation matrix, the diagonal entries are the total number of users that like each page and the off-diagonal entries are the number of times an individual user likes both pages. Table 2 shows the first ten rows and ten columns of the affiliation matrix, A. The table shows that there are very significant differences in the total number of users that like each page, as well as notable differences in the number of users that like each pair of pages.
TABLE 2. The First Ten Rows of the Affiliation Matrix
Note: Diagonal entries are the number of fans of the page. Off-diagonal entries are the number of fans of both pages.
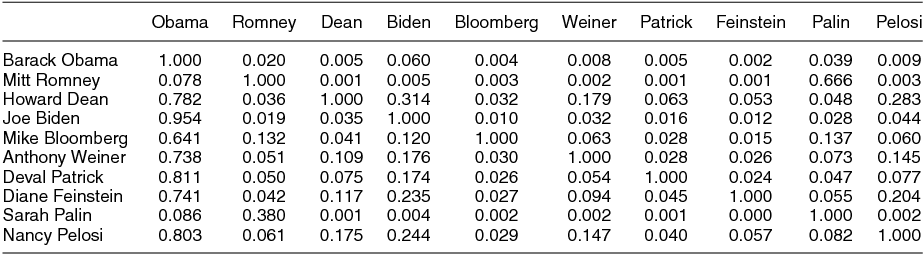
Next, we calculate the ratio of shared users by dividing the number of users that like both pages by the total number of users that like each page independently, which produces an agreement matrix, G = aij/diag(ai ), as depicted in Table 3. Because each page has a different number of fans, the denominator changes and the upper and lower triangles of the new square matrix, G, are not identical. For instance, Barack Obama has many fans on Facebook (the most of any page in the data set) so the values in the first row are small as they are all divided by the number of fans that Obama has. However, many of the fans of other candidates also like Obama, so those values are relatively high.
TABLE 3. The First Ten Rows of the Ratio of Affiliation Matrix
Note: Because each page has a different number of fans, the denominator changes and the off diagonal entries are not identical.
It is notable that there is overlap in fans across partisan lines. Take, for instance, the Barack Obama column in Table 3: this column represents the proportion of the other politicians’ fans who are also Obama’s fans. Although it is not surprising that the other Democratic politicians have fans that are also Obama’s fans, more than 7% of both Romney’s and Palin’s fans are also fans of Obama. Thus, for Facebook users who are fans of at least two candidates, there is not complete polarization among Facebook users. This may owe to centrist users who are interested in following members of both parties or to users who are interested enough in politics to follow a large set of popular politicians regardless of their ideological affiliation.
The agreement matrix provides the information required for estimation. From this stage, a number of methods to scale the data may be employed. For simplicity, we use SVD on the centered matrix, G. Because we normalize the agreement matrix, which makes it asymmetric, the results from the left and right singular vectors are not similar. The right singular value is still highly related to the page’s popularity, as its denominator is the number of fans of the page. The left singular value is unrelated to popularity, as its denominator is unrelated to the popularity of the page. Therefore, we retrieved the first rotated left singular value as the ideology measure for the pages. We rescaled the values to have mean 0 and standard deviation 1 for ease of interpretation.
We were next interested in estimating ideology scores for the users. If we were to scale the entire user by page matrix we would be able to estimate separate parameters for the users and the pages that should be measures of ideology. Another approach would be to replicate what we have done with the pages and to create a matrix of connections between users based on shared political pages that they both like. This would create a matrix of approximately 6.2 M2 entries. However, decomposing a 6.2-M × 6.2-M matrix generally requires more computational resources than are available to political scientists running R on a normal computer. Instead, for each user we take the average of the scores for the political pages that user endorsed.
We begin our exploration of our estimates by examining the distributions of the ideology scores of politicians and individuals, as shown in Figure 2. The figure shows that both individuals and politicians are bimodally distributed, which is similar to Poole and Rosenthal’s (Reference Poole and Rosenthal1997) results for the U.S. Congress, and Bonica’s (Reference Bonica2013) results for candidates for office. The bimodal distribution of individuals is consistent with a polarized American public (Abramowitz Reference Abramowitz2010; Abramowitz and Saunders Reference Abramowitz and Saunders2008; Levendusky Reference Levendusky2009), in contrast to those who have argued that polarization in the electorate has not increased (Dimaggio, Evans, and Bryson Reference Dimaggio, Evans and Bryson1996; Fiorina, Abrams, and Pope Reference Fiorina, Abrams and Pope2006; McCarty, Poole, and Rosenthal Reference McCarty, Poole and Rosenthal2006). However, our sample is not fully representative of the population. Indeed, because those in our sample are likely to be more politically engaged than average, our data may reflect that more politically engaged citizens are also more polarized (Abramowitz and Jacobson Reference Abramowitz and Jacobson2006; Fiorina and Levendusky Reference Fiorina and Levendusky2006). Finally, while the distributions of both sets of actors show evidence of polarization, politicians are more dispersed than individuals.
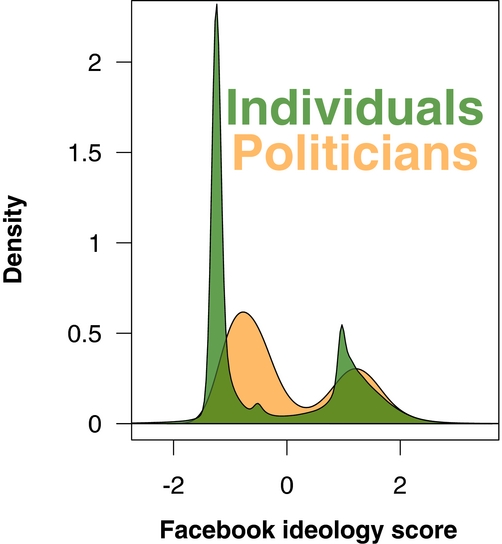
FIGURE 2. Density Plots of Ideological Estimates of 1,223 Politicians and 6.2 million Individuals.
VALIDATION OF THE MEASURE
In order to validate the measures that we estimate, we begin by showing the correlation between our measures and other commonly used measures. For political elites, we rely on measures of ideology that come from their voting records. For individuals, we use self-reported indicators of ideology.
Validation of Measures for Political Elites
To examine the similarity between legislators’ positions as derived from roll-call vote data and those from Facebook liking data, we matched Facebook pages to their corresponding DW-NOMINATE first dimension scores. We matched 465 pages to members of the 111th Congress. The Pearson correlation between the two measures is 0.94, and the within-party correlation for Democrats is 0.47 and for Republicans is 0.42. This correlation is quite high given that Aleman et al. (Reference Aleman, Calvo, Jones and Kaplan2009) find that the ideological estimates from roll-call data and ideological estimates from cosponsorship data in the U.S. Congress correlate between 0.85 and 0.94. Figure 3 provides a visual representation of the relationship between the two ideology scores. The figure shows that the measures cluster legislators into two parties, and that the correlation within parties is quite high as well. For comparison, Bonica (Reference Bonica2013) finds that the overall correlation between DW-NOMINATE and CFscores scores among incumbents is 0.89, with a Democratic correlation of 0.62 and a Republican correlation of 0.53.
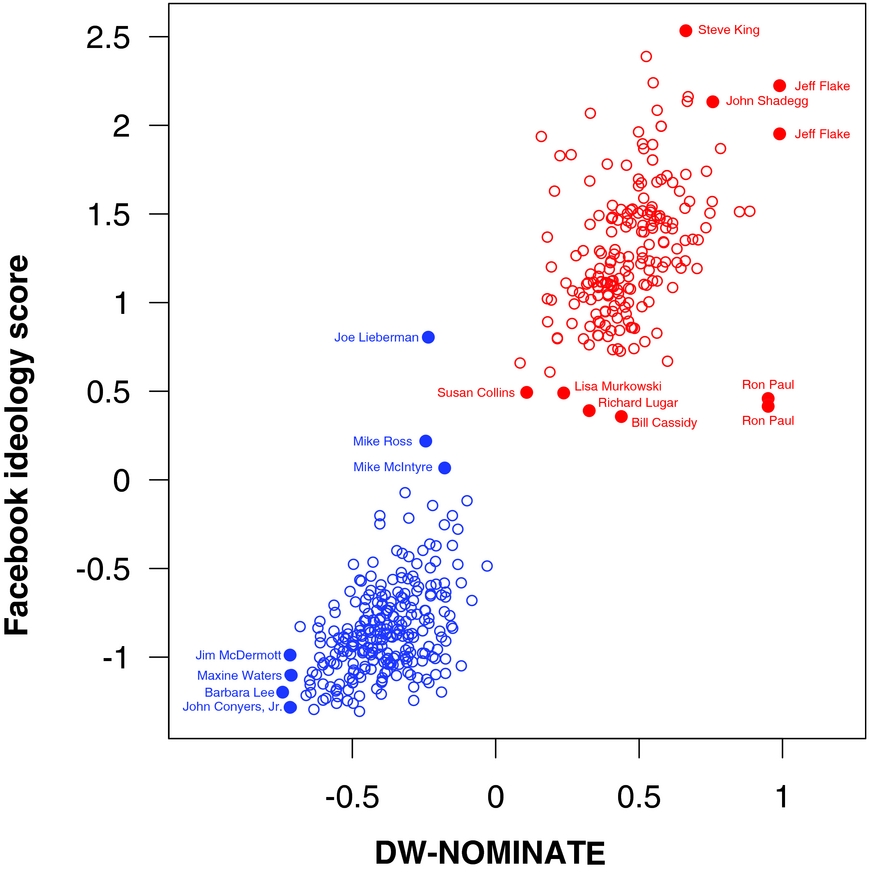
FIGURE 3. Scatter Plot Showing the Relationship between the Facebook Based Ideology Measure and DW-NOMINATE
We have labeled some of the members of Congress in the figure to illustrate where some of the most extreme members and some of the more moderate members lie on both measures. There are two points for Jeff Flake and Ron Paul in Figure 3. Although most of the political figures in the dataset had only one page, some had more than one. Ron Paul maintained two official pages, one for his presidential candidacy and one for his work in Congress (this page explicitly asked for all discussion related to his presidential candidacy to move to the other page). Ethics rules state that members need to separate official business and campaign activity, and these separate pages may reflect an effort to comply. While it is unfortunate to have multiple pages representing the same individual with respect to reliably estimating ideology, it does allows us to see whether we get consistent ideological estimates across multiple pages. The similarity in ideological estimates for Flake and Paul’s pages suggests that our measurement strategy is reliable.
Validation of Measures for Ordinary Citizens
We next turn to the validation of the individual-level ideological estimates. First, we computed the average ideology score of individuals based on their stated political views. On Facebook users may fill out a free response field that many users fill out called “political views.” Many users type the same things in, such as “Democrat,” “Republican,” “Liberal,” or “Conservative.” We took all labels that more than 20,000 users had used and calculated the average ideology score for the group, as well as the 95% confidence interval for that estimate. The results are shown in Figure 4.
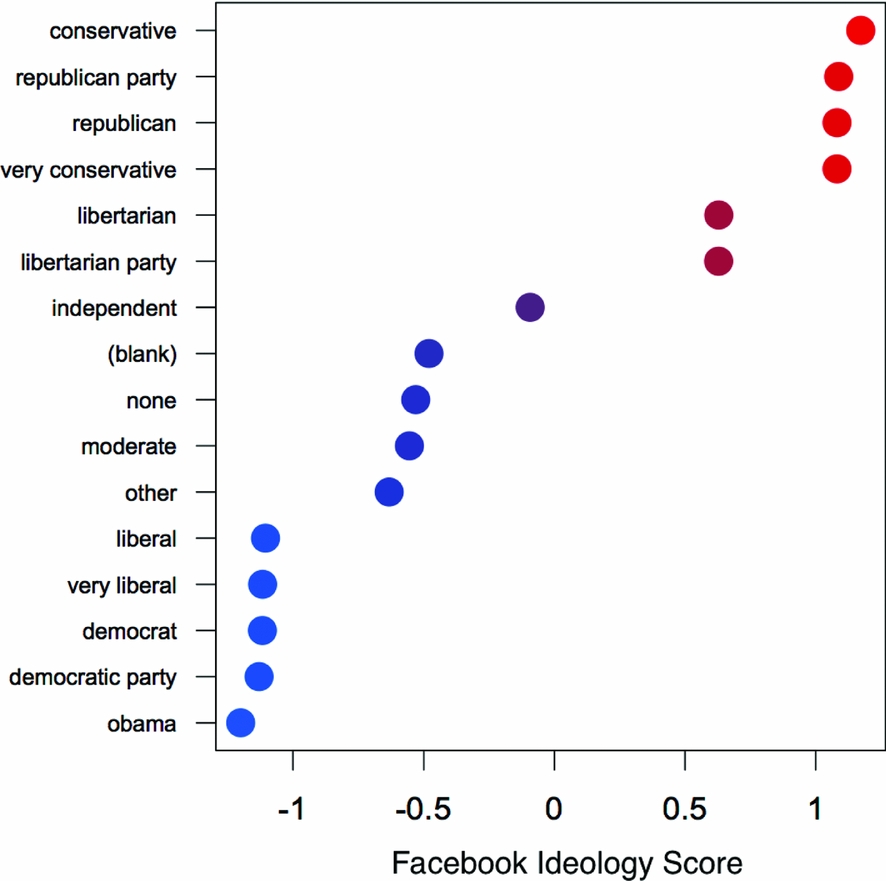
FIGURE 4. Average Facebook Ideology Score of Users Grouped by the Users’ Stated Political Views
Figure 4 shows that the ideology score predicts users’ stated political views well. There appear to be at least three clear groups—those who state their political views and are liberal, those who do not state a clearly liberal or conservative ideology, and those who state their ideology and are conservative. There is also substantial variation in the middle group, those that do not state a liberal or conservative ideology. The groups represented are in approximately the order one would expect based on their average ideology, save for the fact that those who self-identify as “very conservative” are slightly to the left of those who self-identify as “conservative.”
While the above analysis suggests that the estimates we make for users are valid, stated political views on Facebook is a measure of political orientation that has not been previously analyzed. Stated political views of an individual on Facebook are difficult to interpret because we do not know how users understand the question. Therefore, we conducted a survey using a more standard ideology survey question to further understand if the estimates correlate with this commonly used ideology metric.
We use survey data from 20,027 individuals for whom we were also able to estimate ideology to further validate our ideology measure. These individuals consist of the intersection between individuals who took the survey and those who liked two or more pages. The survey was issued to a convenience sample on September 6, 2012 to U.S. Facebook users who were logged in. 282 thousand individuals started the survey and 78 thousand completed it; the approximate AAPOR response rate was 2.6 percent. Respondents’ demographics reflect a departure from U.S. Census demographics with respect to age (54% 18–34, 34% 35–54, and 11% 55+); gender (57% female); ethnicity (83% white); education (19% high school or less; 41% some college; 28% college graduate; 12% postgraduate); and, to a lesser extent, ideology (12% very liberal; 22% liberal; 42% moderate; 17% conservative; 6% very conservative).
We asked individuals to place themselves on a five point ideological scale and also for their party identification as either a Democrat, Republican, Independent, or Other. We then computed the average Facebook ideology score for each group. The results are shown in Figure 5.
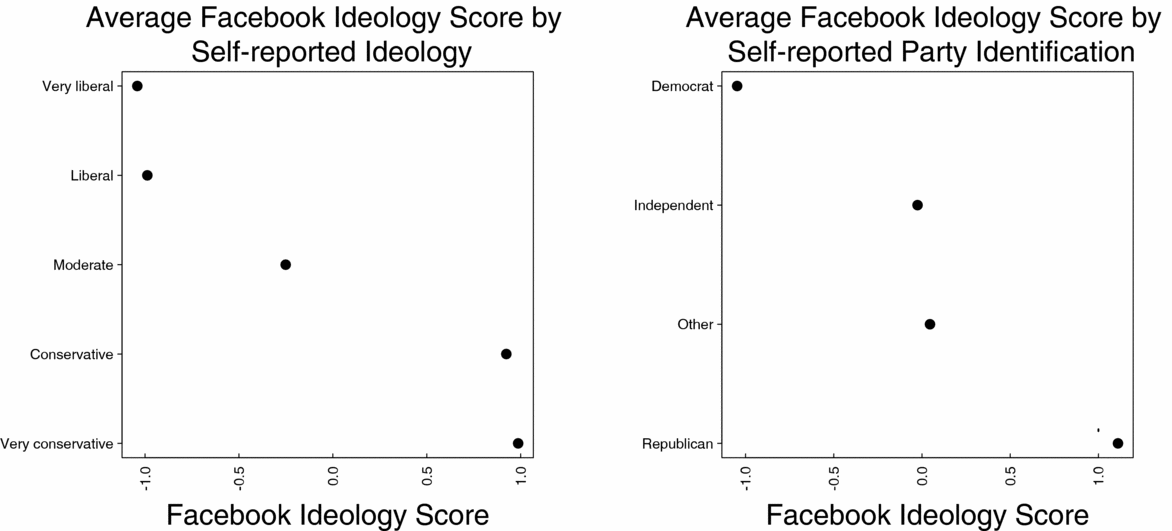
FIGURE 5. Average Facebook Ideology Score of Users Grouped by the Users’ Ideology (left panel) and Party Identification (right panel) from a Survey Conducted Through the Facebook Website
Figure 5 shows that the Facebook ideology score is strongly associated with traditional survey ideology and partisanship measures. The results show there are three clear groups: Liberals, Moderates, and Conservatives. Although the measure can statistically differentiate between those who answered “Liberal” from those who answered “Very liberal” and those who answered “Conservative” from those who answered “Very conservative,” the differences between those groups is small. Further, the ideology measure from Facebook is a good predictor of partisanship, with Democrats occupying the scale’s left end, Republicans the right, and Independents the middle. We do not expect the respondents to our survey to be representative of the population overall or of the population for which we measure ideology, but we also do not expect that either method will show bias in measurement for either population. Therefore, we use these data to validate the Facebook measure, not to make arguments about the overall population.
EXAMPLE APPLICATIONS OF THE IDEOLOGY MEASURE
Example 1: Age and Ideology
A substantial literature has found a relationship between age and political ideology (Cornelis et al. Reference Cornelis, Hiel, Roets and Kossowska2009; Glenn Reference Glenn1974; Krosnick and Alwin Reference Krosnick and Alwin1989; Ray Reference Ray1985). Most studies have found that as people age they become more conservative and less susceptible to attitude change (Jennings and Niemi Reference Jennings and Niemi1978; Krosnick and Alwin Reference Krosnick and Alwin1989). However, less is known about how that relationship varies across individual characteristics. Recent studies have begun to investigate how personality plays a role in mediating the relationship between age and conservatism (Cornelis et al. Reference Cornelis, Hiel, Roets and Kossowska2009). Here we investigate how the relationship between age and ideology varies by characteristics such as gender, marital status, and educational attainment.
A key advantage of using the Facebook ideology data is the large number of observations. By looking at patterns in the raw data we can understand phenomena that are not as easily understood using standard techniques, such as regression. In order to study ideology across characteristics, we took all individuals for whom we calculated an ideology score and matched the individual’s characteristics that they listed on their profile. Figure 6 shows the average ideology of users age 18 through 80, then separates the estimates by gender, marital status, and college attendance. The figure shows that older people are more conservative than younger people. Women are more liberal than men but a similar pattern in which older women and older men are more conservative than their younger counterparts emerges. While the overall pattern is similar for those who get married and those who do not, young people who get married are more conservative than their younger counterparts and young people who do not get married are more liberal than their younger counterparts. After the age of approximately 35, the pattern of increasing conservatism with age is similar across the groups. Finally, college attendance is not predictive of ideology among the young, but for among older groups having attended college is related to being more liberal.
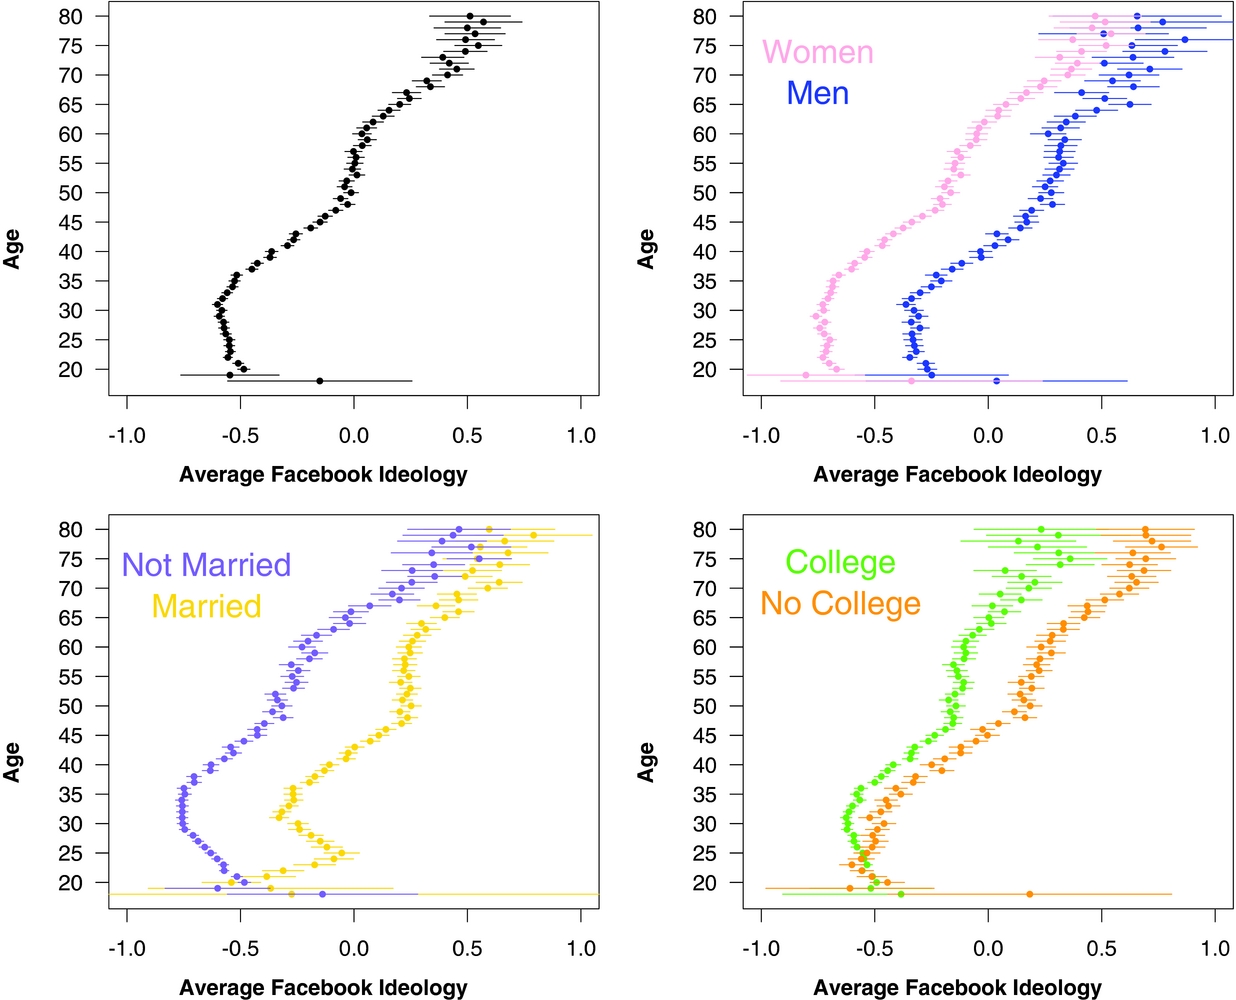
FIGURE 6. In Each Panel the Points Show the Average Ideology of the Age Group for Individuals Age 18 through 80, and the Lines Represent the 95% Confidence Interval of the Estimate
While these results are consistent with previous research, we have not studied change in ideology over time. The finding that older people are more conservative than younger people is consistent with a population that becomes more conservative over time. However, it is also consistent with recent surveys that have shown that the most recent generation is among the most liberal in recent memory (Kohut et al. Reference Kohut, Parker, Keeter, Doherty and Dimock2007). While we have some evidence of how an individual’s ideology changes over time, we find that the correlation in ideology from March 2011 to March 2012 is 0.99. With more time we should be able to better discern whether the patterns we found are due to cohort effects or change in an individual’s ideology over time.
Example 2: Ideology in Social Networks
Another advantage of using the Facebook ideology data is the abundance of data about the social networks of its users. Previous work has shown that ideology clusters in social networks (Huckfeldt, Johnson, and Sprague Reference Huckfeldt, Johnson and Sprague2004). Here, we wish to characterize the extent to which the clustering varies based on the strength of the relationship between two individuals. We consider three general types of relationships: friendships, family ties, and romantic partners.
Clustering in the network may be due to some combination of three possibilities. First, clustering may be due to exposure to a shared environment. Friends may be both exposed to some external factor that influences both to change their ideology in a similar way (e.g., attending the same college (Newcomb Reference Newcomb1943)). Second, clustering may be due to homophily. That is, people may choose friends based on ideology (Heider Reference Heider1944; Festinger Reference Festinger1957). Third, clustering may be due to influence. That is, one friend may argue in favor of an ideological position and change their friend’s views (Lazer et al. Reference Lazer, Rubineau, Chetkovich, Katz and Neblo2010). These processes are more likely to occur between close friends than socially distant ones—closer friends are more likely to be physically proximate and hence more likely to experience the same external stimuli. Friends who share an ideology are more likely to become close friends as they will have more in common. Finally, close friends will have more opportunities to influence one another’s ideological views, which should also increase ideological similarity.
As social relationships become stronger, friends should be increasingly likely to hold similar ideological views. And, this pattern should be strongest for the most intimate relationships. Recent work has shown that while people do not usually select romantic partners based on ideology, they do base such decisions on factors related to ideology, which leads to highly correlated ideological views (Klofstad, McDermott, and Hatemi Reference Klofstad, McDermott and Hatemi2013). Furthermore, this pattern should grow stronger over time as partners are exposed to the same factors, influence each other, and as more similar partners should be more likely to stay together.
Similarly, we expect that familial relationships will show evidence of these processes. Members of a nuclear family are more likely to experience the same external stimuli, due to being more likely to live near one another. While parents cannot select their children (or vice versa) based on ideological views (or other characteristics related to it), recent work shows a genetic component to ideology (Hatemi et al. Reference Hatemi, Gillespie, Eaves, Maher, Webb, Heath, Medland, Smyth, Beeby, Gordon, Mongomery, Zhu, Byrne and Martin2011). This genetic component coupled with socialization and similar exposure to factors that influence ideology mean that ideology is likely to be correlated within family units.
Since Facebook allows users to identify their familial and romantic relationships, we were able to test for ideological similarity across these social links. We began by pairing all individuals with their siblings, parents, or romantic partners. We then calculated the Pearson correlation for each group. The results are shown in Figure 7. The figure shows that married couples have the highest correlation in ideology, while engaged couples have the second highest value. Correlations within the nuclear family have lower values, with parent-child relationships being stronger than sibling relationships. The fact that the correlation between siblings is lower than the correlation between parent-child pairs may be due to the fact that our sample skews toward younger users and that the set of parents on Facebook are more likely to be similar to their children across a range of factors than parents who have not yet joined the website.
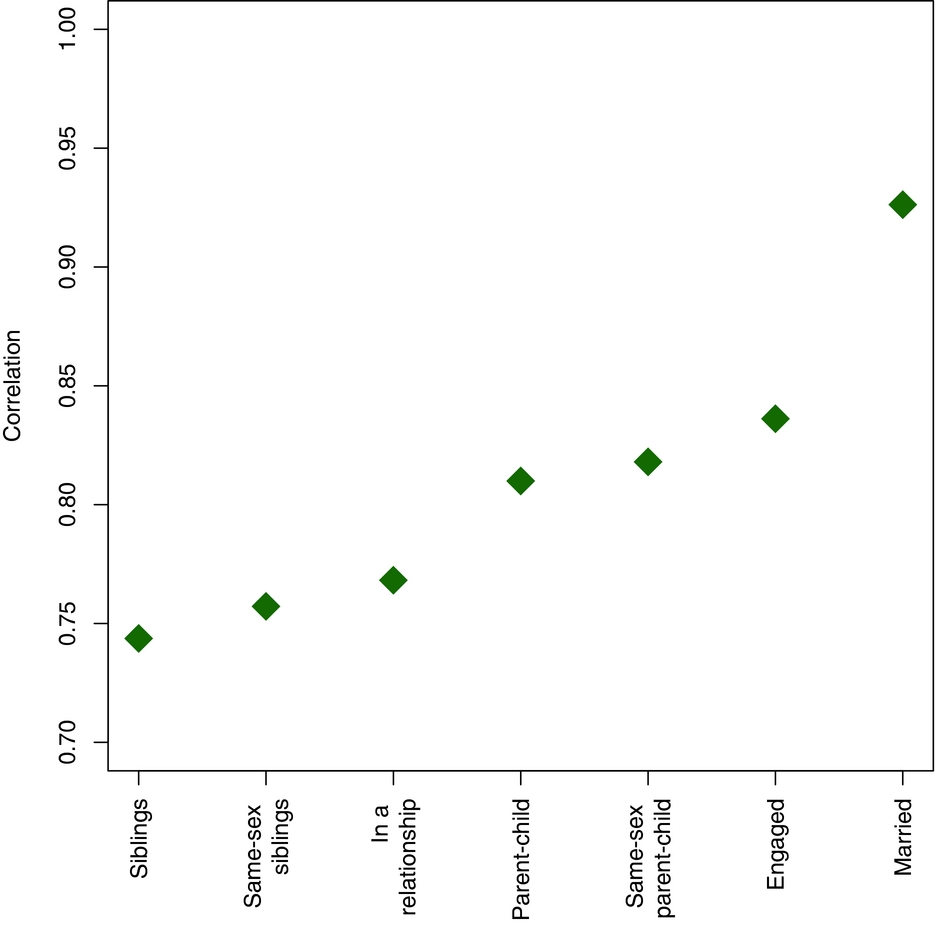
FIGURE 7. The Correlation in Ideology for Familial and Romantic Relationships. The 95% Confidence Intervals for Each of the Estimates is Smaller than the Point
Next, we were interested in the correlation of ideology between friends. First, we paired all 6.2 million users for whom we estimated ideology in 2012 with every Facebook friend for which we also had an estimate for ideology, for a total of 327 million friendship dyads and an average of 53 friends per user. The overall correlation in 2012 was 0.69, which approximates other measures of ideological correlation among friends (Huckfeldt, Johnson, and Sprague Reference Huckfeldt, Johnson and Sprague2004). We repeated this procedure for 2011, with 6.1 million users who had 238 million friendship connections to other users for whom we estimate ideology.Footnote 7 The overall correlation between ideology among these friends in 2011 was 0.67. The slight increase in correlation of friends’ ideology from 2011 to 2012 is suggestive that there is greater polarization among friends in 2012.
Additionally, we categorized all friendships in each year of our sample by decile, ranking them from lowest to highest percent of interactions. Each decile is a separate sample of friendship dyads. We validated this measure of tie strength with a survey (see Jones, Settle, Bond, Fariss, Marlow, and Fowler (Reference Jones, Settle, Bond, Fariss, Marlow and Fowler2012) for more detail) in which we asked Facebook users to identify their closest friends (either 1, 3, 5, or 10). We then measured the percentile of interaction between friends in the same way and predicted survey response based on interaction between Facebook friends. The results show that as the decile of interaction increases the probability that a friendship is the user’s closest friend increases. This finding is consistent with the hypothesis that the closer a social tie between two people, the more frequently they will interact, regardless of medium. In this case, frequency of Facebook interaction is a good predictor of being named a close friend.
Using the decile measure of tie strength, we then calculated the correlation between user and friend ideology on each set of dyads for both 2011 and 2012 (see Figure 8). For both years the correlation in friends’ ideology increases as tie strength increases. The proportion of interaction between friends is a better predictor of similarity of ideology between friends in 2012 than in 2011, again suggesting that in 2012 friendships are more politically polarized than in 2011. We caution that this correlation may increase for other reasons, such as better measures of ideology in 2012 owing to users liking more political pages, or perhaps to changes of the makeup of the set of individuals for whom we can estimate ideology. Although we can only estimate ideology for about 2% more people in 2012 than 2011, the change in the sample could be enough to account for the difference in 2012.
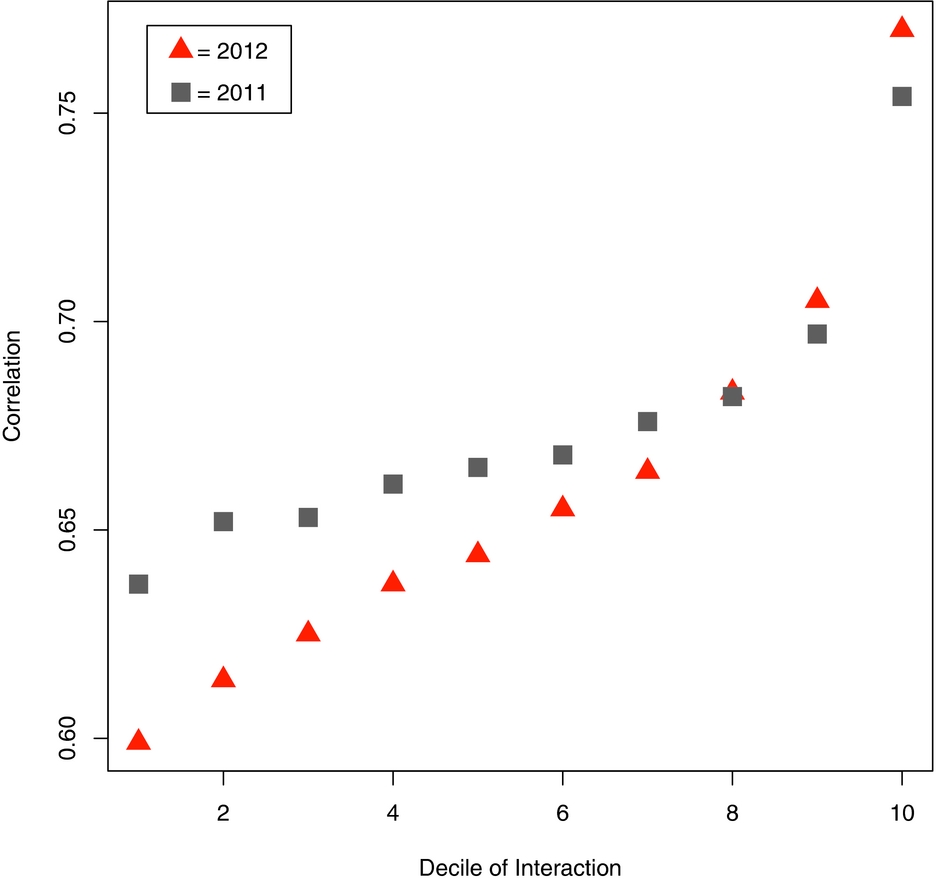
FIGURE 8. The Correlation in Ideology for Friendship Relationships
Example 3: Friend Ideology and Turnout
While the composition of ideology in social networks is important on its own, considerable research has been applied to understanding how the makeup of an individual’s social network affects political participation (Eveland and Hively Reference Eveland and Hively2009; Huckfeldt, Johnson, and Sprague Reference Huckfeldt, Johnson and Sprague2004; Huckfeldt, Mendez, and Osborn Reference Huckfeldt, Mendez and Osborn2004; McClurg Reference McClurg2006; Mutz Reference Mutz2002; Scheufele et al. Reference Scheufele, Nisbet, Brossard and Nisbet2004). Scholars have long theorized about how cross-cutting pressures in an individual’s social environment may cause an individual to become less interested in politics and to disengage (Campbell et al. Reference Campbell, Converse, Miller and Stokes1960; Ithel de Sola Pool and Popkin Reference de Sola Pool, Abelson and Popkin1956). Recent work has tested theories about whether disagreement in an individual’s social network affects the political participation (Mutz Reference Mutz2002; Huckfeldt, Johnson, and Sprague Reference Huckfeldt, Johnson and Sprague2004). This work has consistently found that exposure to disagreement depresses engagement and participation.
Previous studies have relied on snowball samples in order to construct social network measures. Survey respondents may be biased in recalling their discussion partners. Social network sites, such as Facebook and Twitter, allow us to observe friendships without asking individuals about their political discussion partners. If bias in recalling discussion partners is associated with the difference in ideology between a pair of individuals, which certainly may be the case if such discussions are more likely to be memorable, estimates of its effect on participation may be biased as well.
We add to this literature by studying the relationship between exposure to disagreement and validated public voting records. We matched records for all individuals from 13 states (see Jones, Bond, Fariss, Settle, Kramer, Marlow, and Fowler (Reference Jones, Bond, Fariss, Settle, Kramer, Marlow and Fowler2012) for more information) to the Facebook data. Among the 6.2 million individuals for whom we calculated an ideology score, we match a voting record for 397,815,Footnote 8 resulting in a total of 2,410,097 friendship pairs where the individual and the friend had both an ideology score and a public record of whether each person voted. Here we test the relationship between an individual’s (in social network terms, the “ego”) turnout and the difference between the ego’s ideology and that of a friend (the “alter”). Our primary variable of interest is the Mean |Ideology Difference|, as it measures the average difference in ideology between the ego and all connected alters. As Table 4 shows, an increase in the ideological distance between friends is associated with lower rates of turnout by the ego. A one standard deviation increase in the Mean |Ideology Difference| measure corresponds to a 1.3 [95% CI 1.1, 1.4] percentage point decrease in the likelihood of voting (95% CI estimated based on King, Tomz, and Wittenberg Reference King, Tomz and Wittenberg2000).
TABLE 4. Logistic Regression of Ego Validated Voting in 2010 on Ego Covariates and Alter Characteristics of Ideology and Turnout.
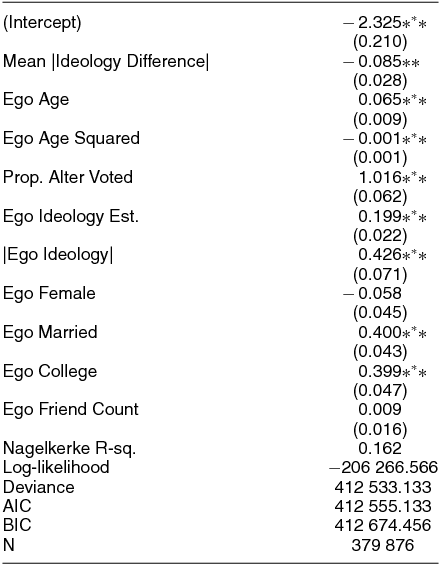
Note: Robust standard errors clustered by common friend (e.g., Williams Reference Williams2000; Wooldridge Reference Wooldridge2002).
This result is consistent with previous work showing that disagreement in an individual’s social network is associated with lower turnout rates (Huckfeldt, Johnson, and Sprague Reference Huckfeldt, Johnson and Sprague2004; Mutz Reference Mutz2002). However, the present work has the advantage of gathering behavioral data. That is, we use validated public voting records, a behavioral ideology measure, and observe friendships, which help us avoid an array of issues including survey response bias and recall bias for friendships.
DISCUSSION
This article makes several important contributions: first it presents a method for measuring ideology using large-scale data from social media, and second, it uses that measure to examine political polarization, the structure of ideology that characterize relationships in society, and how that structure is associated with participation rates. We show that the method produces reliable ideological estimates that are predictive of other measures of elite ideology—DW-NOMINATE, and individual level ideology—self-reported liberal-conservative ideological background. Placement of elites and masses on the same scale is an important step in the study of electoral politics and political communication. For instance, a longstanding debate in the literature concerns whether ordinary citizens are polarizing (Abramowitz and Saunders Reference Abramowitz and Saunders2008; Fiorina, Abrams, and Pope Reference Fiorina, Abrams and Pope2006) and, if so, whether this divide is driven by elites or mass preferences. Data that put elites and ordinary citizens on the same scale are necessary to the study of these types of phenomena because they allow for reliable comparison of the ideology of both groups.
We then investigate the ideological polarization of social relationships by examining how ideology maps onto the structure of our social relationships, coupling our ideological measure with extensive data about social ties and interaction online. We not only confirm previous work finding that friendships cluster by ideological preference, but extend this work to show that ideological correlation is stronger between close friends, family, and especially among romantic partners. Further, we show that from 2011 to 2012 there is an increase in the extent to which ideology is associated with the closeness of a friendship, suggesting polarization over the one-year period. This evidence contributes to the debate about polarization by using new evidence about not only the distribution of ideologies in the electorate, but also about the distribution of social relationships among those with similar and different ideological preferences. A better understanding of this type of polarization is critical, as the ideologies of our social contacts can impact the likelihood that we are exposed to new ideas, which is a critical component of democracy (Huckfeldt, Johnson, and Sprague Reference Huckfeldt, Johnson and Sprague2004). Future work on polarization among friends will be important for understanding the evolution of ideological polarization in ordinary citizens.
Finally, we study the association between disagreement in an individual’s social network and decreased rates of turnout. This result is consistent with previous work (Huckfeldt, Johnson, and Sprague Reference Huckfeldt, Johnson and Sprague2004; Mutz Reference Mutz2002), but has the advantage of using behavioral measures of ideology, turnout, and friendships. This helps to avoid biases that individuals have in answering survey questions about ideology and turnout and recalling friends with whom they have discussed politics. While our results show that individuals in networks with disagreement are less likely to participate in politics, further work should further investigate whether this relationship is causal.
It is important not to lose sight of the potential drawbacks of the approach we use and the weaknesses of this particular study. First, the population we study here is not representative of the U.S. population overall. For instance, Facebook users are on average younger than the population. However, more than 100 million American adults are Facebook users, out of a population of 230 million. Furthermore, the particular sample we use here—those who have liked two or more political pages—differs from the overall population of Facebook users. This subset is likely older, more politically engaged, and more engaged with Facebook than the common user. However, our sample is not limited to political elites or donors to political causes. Rather, they constitute a subset of the population who are on average simultaneously more interested in politics and more engaged on Facebook.
Early in the article, we discussed several problems with traditional measures of individual ideology. First, traditional survey measures do not account for the multiple dimensions of ideology. While we have focused here on the first dimension of ideology, our method of measurement recovers many dimensions related to ideology. In future work, scholars should investigate these dimensions and how they can help us to better understand ideology outside of the traditional left-right paradigm—for example, can this measure help us understand libertarian-authoritarian and “intervention-free market” dimensions (Hix Reference Hix1999)? Second, traditional survey measures rely on an interval ideology measure, which often assumes that differences between responses are equal (that is, the difference between a response of “Very Liberal” and “Liberal” is assumed to be the same as the difference between responses of “Liberal” and “Somewhat Liberal”). While our measure is continuous by its construction, we find that there are three clustered groupings of individuals: those who are liberal, those who are conservative, and those who are somewhere in the middle. While we find few differences between those who label themselves “Liberal” or “Very Liberal” and “Conservative” or “Very Conservative,” future work should further investigate whether the lack of meaningful difference is due to our measurement strategy or to other factors related to how individuals present themselves politically online.
Finally, traditional survey measures of ideology are unreliable, particularly among liberals who are unwilling to label themselves as such. The construction of our measure should help to make the measure more reliable. Still, we cannot say that our measure is strictly better than others. Where survey respondents may give misleading answers to questions about ideology, in our case, individuals may like political pages to acquire information about a candidate in addition to signaling support. As scholars investigate how people make decisions about how to present themselves politically online we will be better able to understand how any issues affect the reliability of our measure.
Our hope is that the method we have described here will allow for tests of theories from spatial models of politics that require data on the relative positioning of political actors, as have previous methods that put a diverse set of political actors on a common scale. Our method has the potential to uncover ideological estimates from any entity present in social media—including legislators, the candidates for office they have defeated, bureaucrats, ballot measures, and political issues. This type of data will be important for our ability to study political phenomena concerning the interaction between legislator and constituent ideology, such as representation or vote choice.
The possibilities for future research on large data sets that contain previously unstudied types of information about people such as Facebook and Twitter should not be underestimated. The increased power associated with having a large number of individuals affords researchers the opportunity to unobtrusively test theories we previously could not; furthermore it increases precision when we do so.Footnote 9 While in many cases, such fine-grained estimates may not be necessary and conventional survey sampling works well, there are an array of applications for which such estimates are desirable: estimates for ideology or support for candidates in small districts, local officials; estimates of support among minority populations; estimates of change over short periods of time; and ideological estimates in non-U.S. political locales where reliable survey, roll-call, and/or fund-raising data might not be available. With measures such as the one described in this article, we may be able to detect changes in the public perception of political officials and/or candidates simply by examining the public’s changing preferences online.
This research is part of a growing literature in the social sciences in which large sources of data are used to conduct research that was previously not possible (Lazer et al. Reference Lazer, Pentland, Adamic, Aral, Barabasi, Brewer, Christakis, Contractor, Fowler, Gutmann, Jebara, King, Macy, Roy and Alstyne2009). We hope that the ideology measure we use in this article, and others that measure the ideology of large numbers of the mass public (Bonica Reference Bonica2013; Tausanovitch and Warshaw Reference Tausanovitch and Warshaw2012), will contribute to our understanding of ideology in new ways. While there has been a long tradition of research into ideology and its structure, this article should form a starting point for future research into how our social networks are critical to our understanding of society’s ideological makeup.
NOTE
Due to privacy considerations, data must be kept on site at Facebook. However, Facebook is willing to give access to de-identified data on site to researchers wishing to replicate these results.


