


Childhood obesity is an important public health concern and nearly one-third of Canadian children are considered overweight or obese( Reference Roberts, Shields and de Groh 1 ). Television viewing has been identified as an important behaviour associated with overweight and obesity in children( Reference Hancox and Poulton 2 , Reference Robinson 3 ). High television viewing time( 4 ) has been shown to be positively associated with childhood obesity( Reference Dietz and Gortmaker 5 – Reference Tremblay, LeBlanc and Kho 7 ). Historically, the association between television viewing and obesity in children has been thought to be driven by the displacement of moderate-to-vigorous physical activity (MVPA) with increased television viewing. However, there is evidence to suggest that the displacement hypothesis may not be the most likely mechanism driving this relationship( Reference Borghese and Chaput 8 – Reference Rey-López, Vicente-Rodríguez and Biosca 11 ).
Another potential explanation for the association between television viewing and obesity is the role of food intake. Television viewing is associated with an overconsumption of food in the current obesogenic environment( Reference Chaput, Klingenberg and Astrup 12 ). Specifically, high television viewing time has been reported to be inversely associated with fruit and vegetable consumption, and positively associated with consumption of energy-dense snacks and drinks, fast food and total energy intake( Reference Pearson and Biddle 13 ). However, the evidence for the role of food intake, specifically while watching television, in the association between television viewing and obesity is limited. The observation of increased food intake while watching television is thought to be driven by several distraction mechanisms and habituation to satiety cues( Reference Bellisle, Dalix and Slama 14 – Reference Temple, Kent and Giacomelli 18 ). Furthermore, television advertising can prompt consumption during viewing and may lead to unhealthy food choices( Reference Robinson 3 ). Van den Bulck & Van Mierlo( Reference Van den Bulck and Van Mierlo 19 ) showed that for each 1 h increase in television viewing was associated with consumption of an additional 156 kcal/d (653 kJ/d) in youth. However, the authors examined only absolute energy intake, not food types, and did not differentiate between children of different weight status. It has been shown that children who are obese are more strongly affected by television advertisements, with respect to their food intake, as compared with children who are normal weight or overweight( Reference Halford, Boyland and Hughes 20 ). However, there is currently a lack of evidence on how children who are overweight/obese or of normal weight may differ in the frequency of consumption of food items in front of the television( Reference Thivel, Tremblay and Chaput 21 ). This is especially salient given the conclusion of a recent review by Mattes( Reference Mattes 22 ), which suggests that ingestive frequency has a greater impact on energy balance than portion size. As children can consume 19–26 % of their daily energy intake in front of the television( Reference Van den Bulck and Van Mierlo 19 , Reference Matheson, Killen and Wang 23 ), further research into the types of food that children consume in front of the television, as well as whether or not the frequency of consumption differs between children of different weight status, is needed.
As suggested above, there is limited evidence examining how the frequency of consumption of food items while watching television differs between normal-weight, overweight and obese children. The objective of the present paper was to compare children of different weight-status groups in the frequency of consumption of food items while watching television. This analysis is novel as it considers the role of consumption of food items specifically while watching television. It is hypothesised that children who are overweight or obese would: (1) watch more television each day; (2) report consuming ‘unhealthy’ foods more frequently while watching television; and (3) report consuming fruits and vegetables less frequently while watching television than their normal-weight counterparts.
Methods
Participants
The International Study of Childhood Obesity, Lifestyle and the Environment (ISCOLE) is a multi-national, cross-sectional study conducted in twelve countries. Data from the National Health and Nutrition Examination Survey (NHANES) 2005/2006 informed an a priori power calculation which indicated that a sample size of 500 participants from each of the twelve international sites would allow for sufficient statistical power for the primary research question of ISCOLE. Details pertaining to the study design and methods, including further information on sample size justification, can be found elsewhere( Reference Katzmarzyk, Barreira and Broyles 24 ). Analyses herein include data from the Canadian site of ISCOLE. Data were collected in schools on 567 children (57·1 % female; 9–11 years of age) from the Ottawa area between September 2012 and May 2013. Consent forms were distributed to 1161 children, of whom 597 participated in the study (51·4 %) and 567 completed the study (48·8 % of those contacted; 95·0 % of those who participated). Schools were stratified into four groups: English public (n 393; 69·3 %); French public (n 60; 10·6 %); English Catholic (n 75; 13·2 %); and French Catholic (n 39; 6·8 %). This project was approved by the research ethics boards at the Children's Hospital of Eastern Ontario and the University of Ottawa, as well as by the participating school boards.
Anthropometric measurements
Trained study staff collected anthropometric data and administered questionnaires in schools during school hours. Weight was measured to the nearest 0·1 kg using a portable Tanita Body Composition Analyser (SC-240; Tanita). Standing height and sitting height were measured to the nearest 0·1 cm using a SECA 213 portable stadiometer. Normal weight, overweight and obesity were defined as >5th but <85th, ≥85th but <95th, and ≥95th age- and sex-specific percentiles, respectively, as defined by the Centers for Disease Control and Prevention (CDC)( Reference Kuczmarski, Ogden and Guo 25 ). CDC cut-points were used to define overweight and obesity to allow for comparison with much of the published literature. Children who were underweight (n 15), as well as children who did not provide a valid measure of weight (n 2), were excluded from the analysis; thus, data were analysed with 550 children.
Television viewing and FFQ
During the school visit participants completed a diet and lifestyle questionnaire which included a self-reported measure of television viewing for each day as well as a specialised FFQ to assess the frequency of consumption of six food items while watching television( Reference Katzmarzyk, Barreira and Broyles 24 ).
The screen-time questionnaire, derived from the US Youth Risk Behaviour Surveillance System (YRBSS)( 26 ), asked children how many hours of television they watch on a typical school day as well as on a typical weekend day. The television viewing time question derived from the YRBSS was shown to have adequate reliability (Spearman correlation 0·55–0·68) and validity (Spearman correlation 0·47)( Reference Schmitz, Harnack and Fulton 27 ). The response options included: no television watching, <1 h, 1 h, 2 h, 3 h, 4 h and ≥5 h of television per d. A weighted mean number of hours of television watching per day was calculated as follows:
hours of television watching per d = ((hours of television on weekdays × 5) + (hours of television on weekend days × 2))/7.
Self-report methods of quantifying screen time have been shown to have acceptable reliability and validity in children( Reference Lubans, Hesketh and Cliff 28 ).
The FFQ during television viewing was adapted from Van den Bulck & Van Mierlo( Reference Van den Bulck and Van Mierlo 19 ), and asked the participants how often they consumed five ‘unhealthy’ food items and one ‘healthy’ food item while watching television in a usual week. Unhealthy foods included: (1) potato chips or peanuts; (2) fried foods such as chicken wings, chicken fingers, French fries, etc.; (3) cookies, biscuits, chocolate or candy bars; (4) ice cream; and (5) fast foods such as pizza, hamburgers, etc. Healthy foods included fruits or vegetables. There were seven response options ranging from ‘never’ to ‘every day, more than once’.
Covariates
Demographic questionnaires completed by parents were used to determine children's age (from date of birth reported by the parents), sex and ethnicity (white/Caucasian, African American, Asian, First Nations, East Indian, ‘don't know’, or ‘other’), along with total annual family income (eight options ranging from less than $14 999 to $140 000 or more), and the highest level of parental education (less than high school, some high school, high school diploma/General Education Development (GED), diploma or 1–3 years of college, bachelor's degree, graduate (master's or PhD)/professional degree). Biological maturity was estimated using the maturity offset method, which estimates an individual's age from peak height velocity( Reference Mirwald, Baxter-Jones and Bailey 29 ). Nightly sleep duration was assessed using the ActiGraph GT3X+ (ActiGraph Corp.); a detailed description of this novel algorithm developed for the ISCOLE study is available elsewhere( Reference Katzmarzyk, Barreira and Broyles 24 ). MVPA was also assessed using the ActiGraph GT3X+ with cut-points developed by Evenson et al. (>2296 counts per min)( Reference Evenson, Catellier and Gill 30 ). Further details with respect to accelerometry data reduction procedures are available elsewhere( Reference Katzmarzyk, Barreira and Broyles 24 ). These covariates were chosen because of their association with television viewing and/or food intake patterns in the literature.
Statistical analysis
Non-parametric tests for significant differences were performed given the nominal or ordinal nature of the data. Kruskal–Wallis ANOVA was used to determine significant differences between weight-status groups in their television watching and the frequency of consumption of food items while watching television. When Kruskal–Wallis ANOVA was significant, Mann–Whitney U tests were used post hoc to determine specifically which weight-status groups differed in television viewing time per day or frequency of consumption of food items. Ordinal regression or general linear models, where appropriate, were used to provide parameter estimates and 95 % CI for the associations between weight-status groups and both television viewing and frequency of consumption of food items in front of the television that were found to be significant in the Kruskal–Wallis ANOVA. In ordinal regression, the link functions were tested for model fit using –2 log likelihood, χ2 goodness of fit, as well as the test of parallel lines. Variables were either positively skewed or normally distributed; thus, negative log-log or logit link functions were tested and the link function that had the best model fit was selected. Logistic regression was used to compute OR (and 95 % CI) and adjusted OR (after adjustment for covariates) for the odds of being overweight or obese with high or moderate television viewing or high consumption of food items found to be significantly different in the Kruskal–Wallis ANOVA. Children who watched more than 4 h of television per d or 2–4 h of television per d were compared with children who watched ≤ 2 h of television per d; this is consistent with definitions of high and low television viewing in the literature( 4 , Reference Tremblay, Leblanc and Janssen 31 ). High and low frequency of consumption while watching television was defined as above or below the median response for each food item. For fast foods, responses ‘never’ and ‘less than once/week’ were merged to represent low frequency of consumption, while responses ‘once a week’ up to ‘every day, more than once’ were merged to represent high frequency of consumption. For fruits and vegetables, responses from ‘never’ to ‘2–4 d/week’ were merged to represent low frequency of consumption, while responses ‘5–6 d/week’ to ‘every day, more than once’ were merged to represent high frequency of consumption. Finally, the ‘frequency rate’ of consumption of food items during television watching was computed by dividing the frequency of consumption of the food item per week by the number of hours of television watched per day; only those foods found to be significantly different between weight-status groups in the Kruskal–Wallis ANOVA were included in this analysis. This analysis was undertaken to examine if the differences in frequency of consumption of a food item between weight-status groups was due to differences in the number of hours of television viewing. A two-tailed P value of less than 0·05 was the threshold to indicate statistical significance. All statistical analyses were performed using SPSS version 21 (IBM Corp.).
Results
Participant and parent demographic information is provided in Table 1. A total of 550 participants (42·9 % male) provided complete data for the variables of interest and were included in the analysis. There were no statistically significant sex interactions between television viewing and the outcome variables; thus, data for both sexes were merged to maintain statistical power. The prevalence of overweight and obesity was 12·4 % (68/550) and 10·9 % (60/550), respectively, using CDC cut-points.
Table 1. Descriptive characteristics of Canadian children in the International Study of Childhood Obesity (ISCOLE) study (n 550) (Number of subjects and percentages; mean values and standard deviations; medians and interquartile ranges (IQR))

CDC, Centers for Disease Control and Prevention; GED, General Education Development; MVPA, moderate-to-vigorous physical activity.
* Age- and sex-specific BMI-for-age percentiles( Reference Kuczmarski, Ogden and Guo 25 ).
Comparison of children by weight-status groups
Similar results were observed for weighted mean television watched per day and television watched on weekdays; however, results were not significant with television watching on weekend days. In all analyses using television viewing time the weighted mean number of hours of television viewing per day is reported to improve clarity. There was a significant main effect of weight status on television viewing, and children who were overweight or obese watched more television per day than those who were normal weight (Table 2). Additionally, in ordinal regression using a logit link function, being overweight was positively associated with reporting a higher television viewing time category on weekdays (β = 0·57; 95 % CI 0·11, 1·03; Wald χ2 = 6·1; P = 0·01), but not on weekend days (β = 0·31; 95 % CI –0·15, 0·76; Wald χ2 = 1·7; P = 0·19), as compared with being normal weight. Similarly, being obese was positively associated with reporting a higher television viewing time category on weekdays (β = 0·94; 95 % CI 0·45, 1·42; Wald χ2 = 14·4; P < 0·001), but not on weekend days (β = 0·48; 95 % CI –0·003, 0·95; Wald χ2 = 3·8; P = 0·052), as compared with being normal weight. Finally, using a general linear model, weight status was positively associated with higher television viewing time (F = 8·6; η2 = 0·03; P < 0·001), such that being overweight (β = 0·37; 95 % CI 0·002, 0·73; P = 0·049) or obese (β = 0·76; 95 % CI 0·37, 1·14; P < 0·001) was associated with a higher television viewing time, as compared with being normal weight.
Table 2. Hours of television viewing on both weekdays and weekends by BMI category, and differences between weight-status categories in Canadian children in the International Study of Childhood Obesity, Lifestyle and the Environment (ISCOLE) study (n 550, mean age 10 years) (Medians and interquartile ranges (IQR))
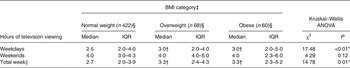
* Significant main effect (P < 0·05; Kruskal–Wallis ANOVA).
† Median was significantly different from that for the normal-weight group (P < 0·05; Mann–Whitney U post hoc test).
‡ Centers for Disease Control and Prevention age- and sex-specific BMI-for-age percentiles (http://www.cdc.gov/growthcharts/)( Reference Kuczmarski, Ogden and Guo 25 ).
§ Response categories: 1 = no television watching, 2 = < 1 h, 3 = 1 h, 4 = 2 h, 5 = 3 h, 6 = 4 h, and 7 = 5 h or more of television per d.
‖ Weighted mean = ((number of hours on weekdays × 5) + (number of hours on weekends × 2))/7.
There was a significant main effect of weight status on the consumption of fast foods as well as fruits and vegetables while watching television. Obese children consumed fast food and fruits/vegetables more frequently while watching television than those who were normal weight or overweight (Table 3), but there were no differences in any of the other food items between weight-status groups. Additionally, in ordinal regression using a negative log-log link function, being overweight was not associated with self-reporting a higher frequency of consumption of fast foods in front of the television (β = –0·21; 95 % CI –0·56, 0·14; Wald χ2 = 1·4; P = 0·24). However, being obese was positively associated with self-reporting a higher frequency of consumption of fast foods in front of the television (β = 0·42; 95 % CI 0·10, 0·74; Wald χ2 = 6·5; P = 0·01), as compared with being normal weight. Similarly, in ordinal regression using a logit link function, being overweight was not associated with self-reporting a higher frequency of consumption of fruits or vegetables in front of the television (β = 0·13; 95 % CI –0·32, 0·56; Wald χ2 = 0·31; P = 0·58). However, being obese was positively associated with self-reporting a higher frequency of consumption of fruits and vegetables in front of the television (β = 0·80; 95 % CI 0·31, 1·28; Wald χ2 = 10·3; P = 0·001), as compared with being normal weight.
Table 3. Frequency of foods consumed while watching television per week by BMI category in Canadian children in the International Study of Childhood Obesity, Lifestyle and the Environment (ISCOLE) study (n 550, mean age 10 years) (Medians and interquartile ranges (IQR))
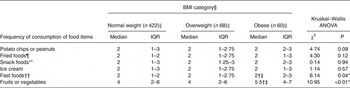
* Significant main effect (P < 0·05; Kruskal–Wallis ANOVA).
† Median was significantly different from that for the normal-weight group (P < 0·05; Mann–Whitney U post hoc test).
‡ Median was significantly different from that for the overweight group (P < 0·05; Mann–Whitney U post hoc test).
§ Centers for Disease Control and Prevention age- and sex-specific BMI-for-age percentiles (http://www.cdc.gov/growthcharts/)( Reference Kuczmarski, Ogden and Guo 25 ).
‖ Response categories: 1 = never; 2 = less than once per week; 3 = once per week; 4 = 2–4 d per week; 5 = 5–6 d per week; 6 = once per day, every day; 7 = every day, more than once.
¶ Fried food such as chicken wings, chicken fingers, French fries, etc.
** Snack foods such as cookies, biscuits, chocolate or candy bars.
†† Fast foods such as pizza, hamburgers, etc.
Finally, children who were normal weight ate fast food at a higher frequency rate while watching television than those who were overweight; however, normal-weight children did not differ from obese children in their frequency rate of fast food consumption during television watching (Fig. 1). There were no differences between weight-status groups for the frequency rate of consumption of fruits/vegetables while watching television (data not shown).

Fig. 1. Frequency of fast food consumption while watching television per week divided by the number of hours of television watched per day by weight-status group in Canadian children in the International Study of Childhood Obesity, Lifestyle and the Environment (ISCOLE) study (n 550; mean age 10 years). Values are means, with 95 % CI represented by vertical bars. ** Mean value was significantly different from that of the normal-weight group (P = 0·01).
Associations between television viewing and frequency of consumption of food items on weight status
Logistic regression analyses showed that children who watched more than 4 h of television per d had higher odds of being obese (Table 4), but did not have higher odds of being overweight (data not shown). This association remained statistically significant with the addition of age, sex, ethnicity, total annual family income, highest parental education level, and nightly sleep duration into the model. However, this association became non-significant with the addition of MVPA. Children who watched 2–4 h of television per d did not have higher odds of being overweight (data not shown) or obese (Table 4) in any of the models.
Table 4. Odds ratio of being obese if a child watches high amounts of television or eats fast food or fruits and vegetables more frequently while watching television in Canadian children in the International Study of Childhood Obesity, Lifestyle and the Environment (ISCOLE) study (n 550, mean age 10 years)* (Odds ratios and 95 % confidence intervals)
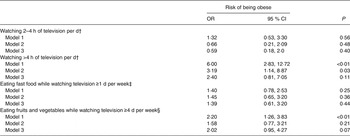
* Model 1, unadjusted. Model 2, adjusted for age, sex, ethnicity, biological maturity, total annual family income, highest parental education level, and nightly sleep duration. Model 3, additionally adjusted for moderate-to-vigorous physical activity.
† Reference group: watching ≤2 h of television per d.
‡ Reference group: eating fast food while watching television <1 d per week.
§ Reference group: eating fruits and vegetables while watching television <3 d per week.
Children who consumed fast food while watching television once or more per week did not have higher odds of being overweight or obese than those eating fast food less than once per week (Table 4); different cut-points around the median (i.e. 25th and 75th percentiles) for high/low frequency of consumption of fast food did not yield different results. Children who consumed fruits and vegetables while watching television on more than 4 d per week had higher odds of being obese, but not of being overweight as compared with children consuming fruits and vegetables less than 3 d per week (Table 4). This association did not hold with the addition of covariates. Once again, the choice of cut-point around the median (i.e. 25th and 75th percentiles) for high/low frequency of consumption of fruits and vegetables had no effect on the results.
Discussion
In the current sample of 550 children, overweight/obese children watched more television per day than their normal-weight peers. Children who watched more than 4 h of television per d had higher odds of being obese, independent of several covariates; however, this relationship did not hold with the addition of MVPA. Finally, obese children consumed fast food and fruits/vegetables more frequently while watching television than the normal-weight or overweight children.
The finding that children who are overweight or obese watch more television than their normal-weight counterparts is consistent with the literature( Reference Dietz and Gortmaker 5 , Reference Tremblay, LeBlanc and Kho 7 ). This finding is a cause for concern as children who are high users of television are likely to be high users as they age( Reference Marshall, Gorely and Biddle 32 ), and television viewing in adults is associated in a dose–response manner with type 2 diabetes, cardiovascular events and all-cause mortality( Reference Chung and Pignone 33 ).
Children who watched high amounts of television were found to have higher odds of being obese, independent of many covariates, but not independent of MVPA. The displacement hypothesis of television viewing and obesity suggests that higher television viewing time may reduce available discretionary time for MVPA in children, which has the potential to make an impact on energy balance. The current finding suggests that MVPA may confound the association between television viewing time and weight status. This finding is contrary to some studies using objective measures of physical activity in adolescents. Rey-López et al. ( Reference Rey-López, Ruiz and Vicente-Rodríguez 34 ) found that boys, but not girls, who watched > 4 h of television per d had higher odds of being overweight, independent of MVPA. However, the study by Rey-López et al. ( Reference Rey-López, Ruiz and Vicente-Rodríguez 34 ) did not adjust for any of the covariates considered in the analyses herein and residual confounding is a possibility. The same finding as that of Rey-López et al. ( Reference Rey-López, Ruiz and Vicente-Rodríguez 34 ) was observed in the current analysis when only adjusting for MVPA (data not shown), illustrating the importance of controlling for a larger panel of potential confounders (if the study is sufficiently powered) when examining the relationship between television viewing and obesity in children. While there is more evidence to suggest that the association between television viewing and obesity in children is explained by alterations in dietary patterns than MVPA( Reference Robinson 3 ), it is likely that both play a role in this association( Reference Van den Bulck and Hofman 35 ). Few studies have considered the role of food intake while watching television on overweight and obesity in children. No study to date has done so with a large sample size while also considering many potentially confounding variables, factors that have led to mixed results in previous studies. Rey-López et al. ( Reference Rey-López, Ruiz and Vicente-Rodríguez 34 ) found that adolescents who eat in front of the television once a week are at higher odds of being overweight after adjusting for MVPA( Reference Rey-López, Ruiz and Vicente-Rodríguez 34 ); however, the authors failed to consider the role of other confounding variables. Matheson et al. ( Reference Matheson, Killen and Wang 23 ) found that food intake while watching television was not associated with BMI in children( Reference Matheson, Killen and Wang 23 ); however, the sample size was too small and heterogeneous (pooled from two studies, n 90 and n 124) to perform between-groups analyses or to adjust for several confounders.
Consumption of fast food is consistently associated with obesity( Reference Pearson and Biddle 13 ), and high amounts of television viewing are associated with obesity( Reference Dietz and Gortmaker 5 – Reference Tremblay, LeBlanc and Kho 7 ) and increased fast food consumption( Reference Müller, Koertzinger and Mast 36 ). Thus, the current finding that children who are obese consume more fast food while watching television may not come as a surprise, given the state of the literature. However, the finding that a high frequency of fast food consumption while watching television is not associated with higher odds of being overweight or obese in both unadjusted and adjusted models is intriguing. The relationship between fast food and obesity, at least as it relates to fast food eaten while watching television, may be better explained by reverse causality – obese children may consume more fast food, but consuming more fast food may not predict obesity. The cross-sectional nature of this analysis does not allow for the determination of causality, but future research should better delineate the association between fast food consumption during television viewing and obesity. Furthermore, as this analysis only considers the frequency of consumption of fast food during television watching, the absolute quantity and variation in quality cannot be determined.
Normal-weight children consumed fast food at a higher frequency rate while watching television than overweight children, but not obese children; there were also no differences between overweight and obese children. Given the descriptive results of the present study, this finding is not surprising – normal-weight and overweight children consume fast food in front of the television with a similar frequency; however, overweight children watch more television. Likewise, the magnitude of the difference in frequency of consumption of fast food while watching television between overweight and obese children is small, and they watch similar amounts of television. Thus, any differences in the frequency rate of consumption of fast food during television viewing between overweight and obese children may be too small to detect( Reference Reilly, Ness and Sherriff 37 ). This is a novel analysis in the consideration of food intake during television viewing, as the frequency of consumption may be higher in obese children, but this is explained by higher television watching, not a higher frequency rate of fast food consumption. There is some evidence to suggest that obese children may have a heighted alertness to food-related cues associated with television viewing( Reference Halford, Boyland and Hughes 20 , Reference Halford, Gillespie and Brown 38 ); however, the present findings suggest that, at least in front of the television, obese children do not consume foods at a higher frequency rate.
The finding that children who are obese consume fruits and vegetables more frequently while watching television than their overweight and normal-weight counterparts is contrary to our hypothesis and most of the available evidence( Reference Pearson and Biddle 13 , Reference Müller, Koertzinger and Mast 36 , Reference Santaliestra-Pasías, Mouratidou and Verbestel 39 , Reference Vereecken, Todd and Roberts 40 ). The median (interquartile range) of the frequency of consumption of fruits and vegetables is considerably higher than the other food items in the FFQ, especially for children who are obese. This may indicate a positive response or social desirability bias, as this differs from what is generally seen in the literature; however, this cannot be known with certainty. Children who are obese have higher daily energy requirements( 41 ) and so may consume many different types of foods more frequently than children who are overweight or normal weight; however, the absolute quantity and variation in quality of food intake cannot be determined from the present study. As this analysis does not consider the food that children eat in the absence of television watching, it is possible that obese children do not consume fruits and vegetables more frequently over the course of the entire day, but due to increased television watching more of this consumption might occur while watching television.
Furthermore, the co-consumption of other foods while consuming fruits and vegetables cannot be ruled out; if children who are obese consume more meals, which include fruits and vegetables, in front of the television this may lead to overconsumption of many food types which can promote a positive energy balance. In the current analysis, there was no effect of weight status on the frequency rate of consumption of fruits and vegetables while watching television, which suggests that obese children consume fruits and vegetables more frequently in front of the television simply because they watch more television. Also, the finding that fruit and vegetable consumption while watching television was associated with higher odds of being obese in the unadjusted model may provide evidence for this hypothesis. However, that the association became non-significant with the addition of covariates should remind us of the confounded nature of the association between food intake, television watching and obesity in children and of the many factors at play. Indeed, there are many factors that may explain the finding above and researchers in this field may wish to further examine the role of food intake while watching television and its impact on obesity, specifically considering the co-consumption of foods with fruits and vegetables, and evaluating the impact of eating in front of the television in the context of whole-day food intake.
There are several strengths of the present study, including the large sample of Canadian children, the robust data quality assurance procedures( Reference Katzmarzyk, Barreira and Broyles 24 ) and the inclusion of many confounding variables which were not typically included in past research. Unique to this analysis is a novel covariate, total sleep time as measured by accelerometry, as well as biological maturity, which is an important consideration in such analyses. Finally, the use of an objective measure for the measurement of MVPA is an asset.
There are also several limitations to the current analysis. First, causality cannot be determined from cross-sectional data. Second, although we used a large sample of Canadian children, it is not known if the sample is nationally representative and therefore results may not be generalisable. Third, the present study did not differentiate between watching television alone or with peers, as well as the placement of televisions (i.e. in the bedroom), which has been associated with unfavourable body composition in itself( Reference Staiano, Harrington and Broyles 42 ). Fourth, television viewing is notoriously difficult to measure, and better measures other than self-report exist( Reference Bryant, Lucove and Evenson 43 ); however, the screen time frequency questionnaire used in the current analysis maximised feasibility for the given sample size and reduced participant burden. Fifth, this analysis does not take into account the effect of television watching on absolute food intake, or the effect of television advertisements on whole-day food intake; however, this was outside of the scope of the current research question. Finally, the FFQ is limited in its ability to assess food intake as it does not account for quantity or quality; however, that frequency alone may differ between weight-status groups in children is an important finding. Furthermore, there are no reliability or validity statistics available for the specialised FFQ; however, this tool was the only one of its kind to assess the frequency of consumption of food items during television watching.
Overall, these results are consistent with previous analyses which suggest that children who are overweight or obese watch more television than their normal-weight counterparts. A high frequency of consumption of foods in front of the television has the potential to make an impact on energy balance and ultimately body weight, especially in the paediatric obese population as these children may be more strongly affected by television advertisements( Reference Halford, Boyland and Hughes 20 ). From a public health perspective, it may be more feasible to focus our efforts on reductions in television viewing time than to suggest that children eat less frequently in front of the television, although both of these methods offer potential avenues for future intervention. To reduce health risk children should reduce both the amount of time they spend watching television as well as the frequency of eating in front of the television.
Conclusion
High television watching was associated with obesity in the current sample of children aged 9–11 years independent of covariates, but not independent of MVPA. Obese children consumed fast food more frequently while watching television than normal-weight children; however, higher frequency of consumption of fast food was not associated with higher odds of being obese, which suggests that the association may be driven by the nutritional habits of obese children. Also, obese children consumed fruits and vegetables more frequently while watching television than normal-weight children. This finding is contrary to most of the literature and should be validated in future studies which examine the quantity and quality of food eaten, as well as the co-consumption of food eaten alongside fruits and vegetables while watching television. These findings suggest that both physical activity and diet play a role in the association between television viewing and obesity.
Acknowledgements
We would like to thank Jessica McNeil and Nina Azoug-Boneault for their role in data collection for the Canadian site of ISCOLE, and the following members of the Coordinating Center for ISCOLE in Baton Rouge, LA for their support throughout the study: Peter Katzmarzyk (principal investigator), Timothy Church (co-principal investigator), Denise Lambert (project manager), Ben Butitta, Shannon Cocreham, Kara Dentro, Katy Drazba, Deirdre Harrington, Dione Milauskas, Emily Mire, Allison Tohme, Ruben Rodarte, as well as the members of the Data Management Center at Wake Forest University: Bobby Amoroso, John Luopa, Rebecca Neiberg, Scott Rushing. We would also like to thank the study participants along with their parents, teachers and school principals for their involvement in the study.
ISCOLE was funded by the Coca-Cola Company. The Coca-Cola Company had no role in study design, conduct of the study, analysis of samples or data, interpretation of findings or the preparation of the manuscript.
M. M. B. participated in study coordination, data collection and was primarily responsible for the analyses, writing of the manuscript, interpretation of the findings, and generation of tables and figures. M. S. T. conceived of the study design and oversaw its coordination, and contributed to interpretation of the study results. G. L. was primarily responsible for the management of the study, and was involved in data collection and data cleaning. C. B., P. B., A. G. L. and C. F. participated in study coordination and management, data collection and data cleaning. J.-P. C. conceived of the study design and oversaw its coordination, and contributed to data analysis and interpretation of the study results. All authors reviewed the final version and provided critical input into the manuscript.
The authors have no conflicts of interest to declare.


 Open access