


High consumption of sugar-sweetened beverages is at the forefront of public health concerns as previous research has shown that consumption is associated with numerous adverse health outcomes, including obesity, type 2 diabetes, increased risk for CVD and dental caries( Reference Malik, Popkin and Bray 1 , Reference Tahmassebi, Duggal and Malik-Kotru 2 ). Despite evidence of a decrease in total sugar-sweetened beverage intake over the past decade, US national survey data documented an increase in consumption of sports and energy drinks( Reference Han and Powell 3 ). The largest increase in sports and energy drink consumption has occurred among young adult (20–34 years) consumers of these sugar-sweetened beverages, with average daily energy consumption increasing from 498 kJ (119 kcal) in 1999–2000 to 958 kJ (229 kcal) in 2007–2008( Reference Han and Powell 3 ). Marketing for sports and energy drinks is often targeted to young adults, particularly males( 4 – Reference Nelson, Story and Larson 6 ). Sports drinks are marketed as a means for improving athletic performance and replacing electrolytes and fluids lost during intense physical activity( Reference Heneghan, Gill and O’Neill 5 , Reference Cohen 7 ). In contrast, energy drinks are marketed as a means for decreasing feelings of tiredness, boosting energy, enabling weight loss and enhancing mental alertness( Reference Seifert, Schaechter and Hershorin 8 ). The high caffeine content and other stimulants in energy drinks that provide these purported benefits may also pose health risks to young adults, particularly when mixed with alcohol( Reference Seifert, Schaechter and Hershorin 8 – Reference Campbell, Wilborn and Bounty 11 ).
Most research designed to inform interventions for young adults has focused on the practice of consuming alcohol mixed with energy drinks and college students. While the risk-taking behaviours and potential severe consequences associated with consuming alcohol mixed with energy drinks warrant concern and energy drink consumption has been associated with higher alcohol use, prior studies suggest that the majority of energy drink consumption does not occur in combination with alcohol( Reference Nordt, Vilke and Clark 10 , Reference Berger, Fendrich and Chen 12 – Reference Marczinski 14 ). It may be that sports and energy drink consumption is part of broader behavioural patterns based on common psychological (e.g. enjoyment of sensation-seeking behaviour) or social (e.g. risk-oriented group membership) factors. There is thus a need for additional research to examine the co-occurrence of frequent sports and energy drink consumption with a wider spectrum of health behaviours that impact risk for obesity and chronic disease among young adults. Young adulthood has been identified as a high-risk period for the development of obesity, as well as unhealthy eating and physical activity patterns( Reference VanKim, Larson and Laska 15 ).
The present study addresses the need for research to inform health programmes and services that meet the needs of young people during this high-risk life stage and will be among the first of US studies to distinguish between consumption of sports drinks and energy drinks in identifying sociodemographic subgroups of young adults in need of targeted interventions. Further, the study will identify patterns of health risk behaviours that co-occur with sports and energy drink consumption and may be important to understand in developing relevant intervention strategies to reduce consumption. As prior research has documented greater consumption of these beverages among males and it is likely that gender-specific factors influence consumption patterns, associations will be examined separately for males and females( Reference Park, Onufrak and Blanck 16 ).
Methods
Study design and population
Data for the current cross-sectional analysis were drawn from Project EAT-III (Eating and Activity in Teens and Young Adults), the third wave of an observational study designed to examine dietary intake, physical activity, weight-control behaviours, weight status and factors associated with these outcomes among diverse young adults. At baseline (1998–1999), a total of 4746 junior- and senior-high-school students at thirty-one public schools in the Minneapolis/St. Paul metropolitan area of Minnesota, USA, completed surveys and anthropometric measures( Reference Neumark-Sztainer, Story and Hannan 17 , Reference Neumark-Sztainer, Croll and Story 18 ). Ten years later, original participants were mailed letters inviting them to complete online or paper versions of the Project EAT-III survey and an FFQ. A total of 2287 young adults completed the Project EAT-III survey between November 2008 and October 2009, representing 66·4 % of participants who could be contacted( Reference Larson, Neumark-Sztainer and Harwood 19 ). All study protocols were approved by the University of Minnesota’s Institutional Review Board Human Subjects Committee.
Survey development and measures
The original Project EAT survey that was used to assess determinants of dietary intake and weight status among adolescents was modified at follow-up to improve the relevance of items for young adults( Reference Neumark-Sztainer, Croll and Story 18 ). New items were also added to allow for investigating areas of growing interest such as consumption of sports and energy drinks. The revised survey was pilot tested to examine test–retest reliability over a period of 1–3 weeks and psychometric values are provided for each measure below when available. Additional details of the survey development process are described elsewhere( Reference Larson, Neumark-Sztainer and Story 20 ).
Sports and energy drink intake
Usual past-year intake of sports and energy drinks was assessed on the EAT-III survey using two questions, which separately asked about the frequency of consuming each type of drink. Response categories included ‘never or less than once per month’, ‘one to three per month’, ‘one per week’, ‘two to four per week’, ‘five to six per week’, ‘one per day’ and ‘two or more per day’. Popular brand-name examples were given for energy drinks (Red Bull®, Full Throttle® and Rockstar®) and sports drinks (Gatorade® and Powerade®). Based on the distribution of intake in the sample, analyses focused on weekly consumption of sports and energy drinks defined as consumption of at least one drink per week (test–retest agreement=94 % for sports drinks, 97 % for energy drinks).
Physical activity and media use
Physical activity was assessed using questions adapted from the widely used Godin Leisure-Time Exercise Questionnaire( Reference Godin and Shephard 21 ). Three survey items individually assessed hours of strenuous, moderate and mild activity in a typical week, with several examples of each level of activity provided. Response options were ‘none’, ‘less than 0·5 hours’, ‘0·5–2 hours’, ‘2·5–4 hours’, ‘4·5–6 hours’ and ‘6 or more hours’. Each response was assigned a midpoint value and responses were then summed to compute total weekly hours of physical activity (test–retest reliability r=0·80). Responses for strenuous and moderate activity were also summed to examine total weekly hours of moderate-to-vigorous physical activity (test–retest reliability r=0·85). Muscle-enhancing behaviours were assessed using two questions, which separately asked about changing one’s eating or exercising more in order to increase muscle size or tone during the past year. Response categories for each item included ‘never’, ‘rarely’, ‘sometimes’ and ‘often’; these responses were scored from 1 to 4 and summed such that higher values indicated more frequent use of muscle-enhancing behaviours (test–retest reliability r=0·77). Participants indicated the average number of leisure-time hours they spent playing video games and watching television (TV), digital video discs (DVD) or videos separately for both weekdays and weekend days( Reference Gortmaker, Peterson and Wiecha 22 , Reference Nelson, Neumark-Sztainer and Hannan 23 ). Response categories for each question were ‘0 hours’, ‘0·5 hour’, ‘1 hour’, ‘2 hours’, ‘3 hours’, ‘4 hours’ and ‘5 or more hours’; these responses were scored 0, 0·5, 1, 2, 3, 4 and 6 h/week to create continuous variables representing total weekly hours of use (test–retest reliability r=0·81 for TV/DVD/videos).
Weight-control behaviours
Dieting was assessed with the question ‘How often have you gone on a diet during the last year? By “diet” we mean changing the way you eat so you can lose weight.’ Responses included ‘never’, ‘one to four times’, ‘five to ten times’, ‘more than ten times’ and ‘I am always dieting’. Responses were dichotomized into non-dieters (responded never) and dieters (other responses; test–retest agreement=97 %)( Reference Neumark-Sztainer, Wall and Guo 24 ). Unhealthy and extreme weight-control behaviours were assessed with the question: ‘Have you done any of the following things in order to lose weight or keep from gaining weight during the past year?’ (yes/no for each method). Responses categorized as unhealthy weight-control behaviours included: (i) fasted; (ii) ate very little food; (iii) used a food substitute (powder or a special drink); (iv) skipped meals; and (v) smoked more cigarettes. Extreme weight-control behaviours included: (i) took diet pills; (ii) made myself vomit; (iii) used laxatives; and (iv) used diuretics. For the separate measures of unhealthy and extreme behaviours, those reporting the use of one or more behaviours were respectively coded as using weight-control behaviours (test–retest agreement=83 % for unhealthy behaviours, 97 % for extreme behaviours).
Sleep patterns
Sleep habits were assessed using measures drawn from a previously validated questionnaire( Reference Pasch, Laska and Lytle 25 ). Participants were asked when they usually go to bed and get out of bed separately for weekdays and weekend days. Average weekday and weekend day sleep durations were calculated from the times provided( Reference Meyer, Wall and Larson 26 ). Overall average daily sleep duration was calculated as (weekday duration×5/7)+(weekend day duration×2/7). Adequate sleep was defined as a daily average of seven or more hours according to the Healthy People 2020 objectives. Having trouble going to sleep or staying asleep was assessed for the past year (test–retest agreement=78 % for ‘somewhat’ or ‘very much’ v. ‘not at all’).
Substance use and risk taking
Participants reported cigarette smoking, binge drinking, marijuana use, steroid use and other muscle-building substance use (e.g. creatine, hydroxyl methylbutyrate) during the past year. Responses were dichotomized to examine at least weekly cigarette smoking (test–retest agreement=95 %) and any past-year use of the other substances (test–retest agreement=97 % for marijuana, 100% for steroids, 100 % for muscle-building substances). Binge drinking was assessed by asking participants how many times they had five or more drinks at a sitting over the past 2 weeks (test–retest agreement=84 % for any v. no episodes).
Eating behaviours
A semi-quantitative FFQ was administered at the same time as the Project EAT-III survey and used to assess usual past-year intakes of sugar-sweetened soda, caffeinated coffee and tea, 100 % fruit juice and milk( 27 ). A daily serving was defined as the equivalent of one glass, bottle or can for sugar-sweetened soda; 8–16 fl oz (237–473 ml) for coffee and tea; one-half cup or a small glass for fruit juice; and one cup for milk. Previous studies have examined and reported on the reliability and validity of intake estimates( Reference Feskanich, Rimm and Giovannucci 28 , Reference Rimm, Giovannucci and Stampfer 29 ). Responses to the FFQ were excluded if participants reported a biologically implausible level of total energy intake (<2093 kJ/d (500 kcal/d) or >20 934 kJ/d (5000 kcal/d)). To assess breakfast consumption, the Project EAT-III survey included the question: ‘During the past week, how many days did you eat breakfast?’ Five response options ranged from ‘never’ to ‘every day’ (test–retest reliability r=0·82).
Sociodemographic characteristics
Sociodemographic characteristics were self-reported and included gender, age, race/ethnicity, educational achievement, post-secondary student status, employment status, parental status and relationship status. Educational achievement was assessed with the question: ‘What is the highest level of education that you have completed?’ (test–retest agreement=97 %). Post-secondary student status in the past year was reported according to whether young adults were enrolled full-time or part-time in a two-year college, four-year college or graduate degree programme (test–retest agreement=95 %). Responses were dichotomized for analysis (student or not a student). Current employment status was assessed with the question: ‘How many hours a week do you currently work for pay?’ (test–retest reliability r=0·94). Young adults who reported working ≥40 h/week were categorized as employed full-time. Six response options were provided for report of relationship status and were categorized according to whether young adults were single (single or casually dating, separated or divorced, widowed) or involved in a committed relationship (committed dating relationship or engaged, married, same-sex domestic partner) at the time of the survey (test–retest agreement=98 %).
Sensation-seeking behaviour
Sensation-seeking behaviour was assessed with the question: ‘Do you like to do things that are a little dangerous (for example, sky diving, bungee jumping, gambling)?’ Responses were dichotomized to distinguish those who reported low enjoyment (‘not at all’ or ‘a little’) from those who reported high enjoyment (‘quite a bit’ or ‘very much’; test–retest agreement=94 %).
Weight status
Weight status was assessed using self-reported height and weight, from which BMI (kg/m2) was calculated. Self-reports of height and weight (test–retest reliability r=0·99 for height and weight) were validated in a sub-sample of sixty-three male and sixty-two female participants in Project EAT-III for whom height and weight measurements were completed by trained research staff. Results showed very high correlations between self-reported BMI and measured BMI in males (r=0·95) and females (r=0·98). Weight status was defined according to current BMI guidelines for adults (not overweight: BMI<25·0 kg/m2; overweight: BMI=25·0 to 29·9 kg/m2; obese: BMI≥30·0 kg/m2)( 30 ).
Statistical analyses
All analyses were conducted using the statistical software package SAS version 9·3 (2011) and stratified by gender. Descriptive statistics were first calculated to examine patterns of sports and energy drink consumption. The χ 2 statistic was used to identify differences in weekly consumption according to sociodemographic characteristics, enjoyment of sensation-seeking behaviours and weight status. Linear and logistic regression models were used to estimate associations between weekly sports and energy drink consumption and health behaviours, while adjusting for those factors that have been identified as potential confounders in previous research( Reference Park, Onufrak and Blanck 16 , Reference Emond, Gilbert-Diamond and Tanski 31 , Reference Field, Sonneville and Falbe 32 ). One set of models included weekly sports drink consumption and each health behaviour of interest in a separate model. A second set of models likewise included weekly energy drink consumption to allow for separately examining associations with each health behaviour variable. To account for the potential influence of an underlying tendency to engage in risk-taking behaviours in terms of relationships with substance-use behaviours( Reference Brache and Stockwell 33 , Reference Miller 34 ), additional models were examined that adjusted for enjoyment of sensation-seeking behaviours.
Because attrition from the baseline sample (1998–1999) did not occur at random, the data were also weighted using the response propensity method for all analyses( Reference Little 35 ). When compared with non-respondents in Project EAT-III, respondents were more likely to be female, white, younger and raised by parents of higher socio-economic status. Response propensities (i.e. the probability of responding to the Project EAT-III survey) were estimated by performing the logistic regression of response at EAT-III v. a large number of predictor variables from the baseline Project EAT survey. Weights were additionally calibrated so that the weighted total sample sizes used in analyses accurately reflect the actual observed sample sizes for males and females. The weighting method resulted in estimates representative of the sociodemographic make-up of the original school-based sample, thereby allowing results to be more fully generalizable to the population of young people in the Minneapolis/St. Paul metropolitan area.
A 95 % confidence level was used to interpret the statistical significance of probability tests, corresponding to P<0·05. Whenever the dependent variable exhibited positive skewness, such testing was carried out under the square-root transformation after confirming the transformed variables better approximated normal distributions.
Results
Beverage consumption frequency and associations with sociodemographic characteristics, sensation-seeking behaviour and weight status
Sports drinks were consumed at least weekly by 31·0 % of the young adult participants and energy drinks by 18·8 % of participants. Only 12·6 % of young adults weekly consumed both sports and energy drinks. Weekly consumption of sports drinks was more common among males than females (44·6 % v. 19·9 %, P<0·001), and likewise weekly consumption of energy drinks was more often reported by males than females (26·7 % v. 12·2 %, P<0·001). Approximately one quarter (24·1 % of males, 23·5 % of females) of weekly sports drink consumers reported drinking a sports drink on five or more days of the week. Similarly, 30·5 % of males and 25·7 % of females who were classified as weekly energy drink consumers reported having an energy drink on five or more days of the week (data not shown).
For males and females, consumption of sports and energy drinks differed by educational achievement (P<0·001 or P=0·02) with those having a four-year post-secondary degree being least likely to report weekly consumption (Table 1). Beverage-specific differences were observed in males and females. Sports drink intake was significantly associated with race/ethnicity (P=0·001), parental status (P=0·02), relationship status (P=0·03) and sensation-seeking behaviours (P=0·002) among males as well as with weight status (P=0·006) among females. Energy drink intake was significantly associated with parental status (P=0·002) and sensation-seeking behaviours (P=0·03) among males as well as with student status (P=0·01) and sensation-seeking behaviours (P=0·01) among females.
Table 1 Young adults’ (n 2287) consumption of sports and energy drinks by sociodemographic characteristics and enjoyment of sensation-seeking behaviours; Project EAT-III (Eating and Activity in Teens and Young Adults), Minneapolis/St. Paul, MN, USA, 2008–2009
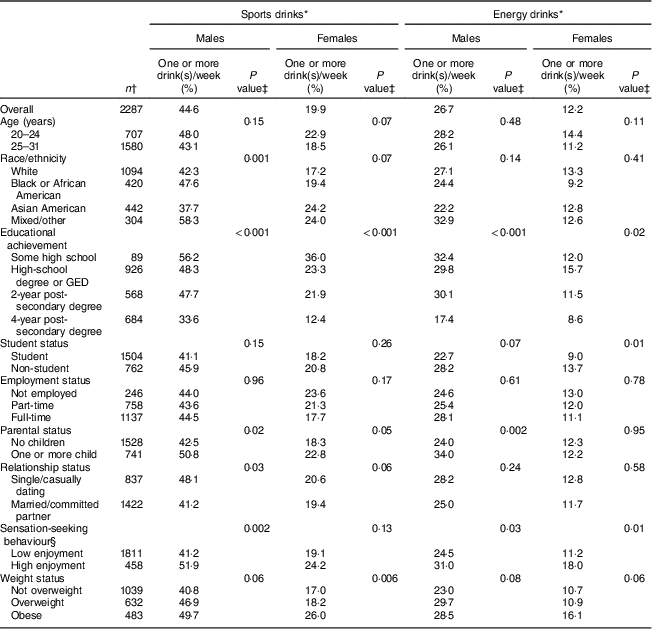
GED, General Equivalency Diploma.
* All percentages are weighted to reflect the probability of responding to the EAT-III survey.
† Sample size for different variables might vary from total sample size because of missing responses and rounding of weighted frequencies.
‡ P values represent testing for independence of sociodemographic categorization and frequency of shared meals in the past week by the χ 2 test.
§ Defined by report of enjoyment (low=‘not at all’ or ‘a little’; high=‘quite a bit’ or ‘very much’) in doing things that are a little dangerous.
Adjusted associations of sports drink consumption with health behaviours
For males and females, weekly sports drink consumption was significantly associated with higher consumption of sugar-sweetened soda (both P=0·01) and 100 % fruit juice (P<0·001 and P=0·001, respectively), higher video game use (P<0·001 and P=0·002, respectively), binge drinking (P=0·01 and P=0·03, respectively) and use of muscle-enhancing substances (both P<0·001; Table 2). The observed difference in video game use was particularly notable for males, with those who consumed sports drinks weekly spending an average of 2·5 additional hours per week playing video games compared with males who consumed sports drinks less than once weekly. Among males only, weekly sports drink consumption was also significantly associated with higher milk consumption (P<0·001), higher total and moderate-to-vigorous physical activity (both P<0·001), higher use of muscle-enhancing behaviours (P<0·001) and marijuana use (P=0·01). Among females only, weekly sports drink consumption was significantly associated with less frequent breakfast consumption (P<0·001) and use of unhealthy weight-control behaviours (P=0·003). Similar patterns were observed for males and females in models of substance-use behaviours that additionally accounted for sensation-seeking behaviour, with only two notable exceptions (data not shown). Among females, the relationship between weekly sports drink consumption and binge drinking was attenuated and no longer statistically significant (P=0·07) while an association with steroid use emerged (P=0·02).
Table 2 Sports drink consumption and adjusted associations with health behaviours and attitudes among young adult males and femalesFootnote *; Project EAT-III (Eating and Activity in Teens and Young Adults), Minneapolis/St. Paul, MN, USA, 2008–2009
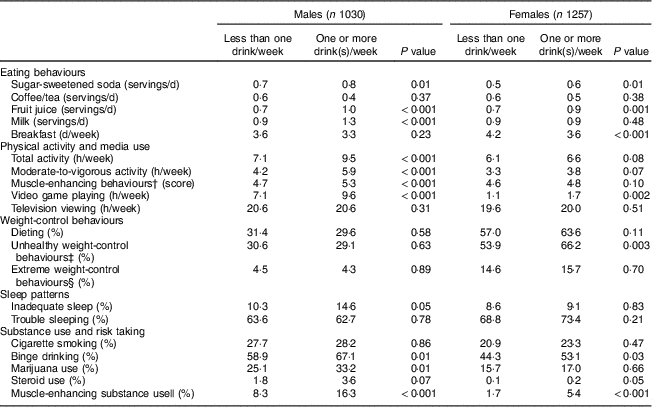
* Weighted regression model is adjusted for young adult age, race/ethnicity, educational achievement, student status, employment status, parental status, relationship status and weight status.
† Muscle-enhancing behaviours included: (i) changed my eating; and (ii) exercised more.
‡ Unhealthy weight-control behaviours included: (i) fasted; (ii) ate very little food; (iii) used a food substitute (powder or a special drink); (iv) skipped meals; and (v) smoked more cigarettes.
§ Extreme weight-control behaviours included: (i) took diet pills; (ii) made myself vomit; (iii) used laxatives; and (iv) used diuretics.
|| Any muscle-building substance other than steroids (e.g. creatine, amino acids, hydroxyl methylbutyrate, DHEA (dehydroepiandrosterone), growth hormone).
Adjusted associations of energy drink consumption with health behaviours
For males and females, weekly energy drink consumption was significantly associated with higher consumption of sugar-sweetened soda (P=0·003 and P=0·005, respectively), less frequent breakfast consumption (P<0·001 and P=0·02, respectively), higher video game use (P<0·001 and P=0·008, respectively), use of unhealthy weight-control behaviours (both P<0·001), trouble sleeping (P=0·007 and P=0·03, respectively), cigarette smoking (both P<0·001) and binge drinking (both P<0·001; Table 3). As an example, the observed prevalence of unhealthy weight-control behaviours among females who consumed energy drinks at least weekly was 77·4 % compared with 53·6 % among those who consumed energy drinks less than once weekly. Among males only, weekly energy drink consumption was also significantly associated with total and moderate-to-vigorous physical activity (P=0·01 and P=0·04, respectively), use of muscle-enhancing behaviours (P=0·003), inadequate sleep (P<0·001), steroid use (P=0·003) and other muscle-enhancing substance use (P=0·001). Among females only, weekly energy drink consumption was significantly associated with higher television viewing (P=0·004), dieting (P<0·001) and marijuana use (P=0·03). Similar patterns were observed for males and females in models of substance-use behaviours that additionally accounted for sensation-seeking behaviour (data not shown). Only the relationship between weekly energy drink consumption and marijuana use in females was attenuated and no longer statistically significant (P=0·08).
Table 3 Energy drink consumption and adjusted associations with health behaviours and attitudes among young adult males and femalesFootnote *; Project EAT-III (Eating and Activity in Teens and Young Adults), 2008–2009
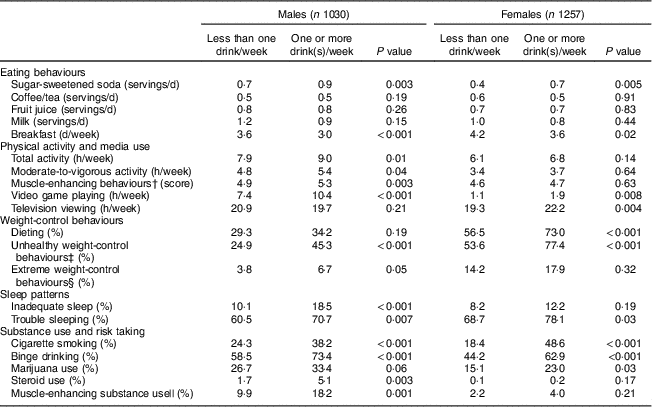
* Weighted regression model is adjusted for young adult age, race/ethnicity, educational achievement, student status, employment status, parental status, relationship status and weight status.
† Muscle-enhancing behaviours included: (i) changed my eating; and (ii) exercised more.
‡ Unhealthy weight-control behaviours included: (i) fasted; (ii) ate very little food; (iii) used a food substitute (powder or a special drink); (iv) skipped meals; and (v) smoked more cigarettes.
§ Extreme weight-control behaviours included: (i) took diet pills; (ii) made myself vomit; (iii) used laxatives; and (iv) used diuretics.
|| Any muscle-building substance other than steroids (e.g. creatine, amino acids, hydroxyl methylbutyrate, DHEA (dehydroepiandrosterone), growth hormone).
Discussion
The present study described sports and energy drink consumption among a sample of young adults and identified linkages to health-risk behaviours that might be important to understand in developing interventions to address consumption of these beverages. The results showed that nearly one of three young adults consumed a sports drink and one of five young adults consumed an energy drink at least once weekly. Males, as well as young adults who did not report a four-year post-secondary degree, were most likely to report consumption this often. Consuming one or more sports drinks or energy drinks weekly was associated with higher sugar-sweetened soda intake, video game use and binge drinking among men and women. In addition, weekly energy drink consumption was linked to cigarette smoking as well as a lower frequency of eating breakfast, a higher prevalence of unhealthy weight-control behaviours and trouble sleeping.
These study findings complement recent national data that have indicated consumption of sports and energy drinks is climbing among young adults and raised concerns about the health effects of caffeine( Reference Han and Powell 3 , Reference Pray, Yaktine and Pankevich 36 ). The caffeine content of energy drinks has been the focus of particular concern as many of them contain 70–80 mg per 8floz (237 ml) serving or approximately three times the concentration found in cola drinks; little is known about the interactions between caffeine and other common ingredients (e.g. taurine, guarana) and there are no requirements for safety testing or warning labels on these drinks when they are often sold as dietary supplements in the USA( Reference Seifert, Schaechter and Hershorin 8 , Reference Reissig, Strain and Griffiths 37 ). There is no official recommendation for caffeine intake in the USA; however, it is recommended that women of childbearing age limit their daily intake to less than 300 mg and Health Canada advises that the general adult population not exceed 400 mg( Reference Kaiser and Allen 38 ). Continued monitoring of caffeine intakes will be important if energy drink consumption continues to rise as it has in recent years.
Additionally, the findings build on a growing number of studies that have raised concerns about the contribution of sugar-sweetened beverages to overall energy, added sugar and Na consumption among young adults( Reference Han and Powell 3 , Reference Park, Onufrak and Blanck 16 , Reference West, Bursac and Quimby 39 ). The American Heart Association recommends that energy from added sugar be limited to approximately 418 kJ/d (100 kcal/d) for women and 628 kJ/d (150 kcal/d) for men( Reference Johnson, Appel and Brands 40 ). For Na, it is recommended that intake also be limited to no more than 1500–2400 mg/d( Reference Eckel, Jakicic and Ard 41 ). Some brands of sports drinks contain as much as 335 kJ (80 kcal), 15 g sugar and 200 mg Na per 8floz (237 ml) serving( 4 , 42 ). Likewise, depending on the brand, energy drinks contain as much as 586 kJ (140 kcal), 35 g sugar and 340 mg Na per 8floz (237 ml)( 4 , 42 ). There is compelling scientific evidence linking sugar-sweetened beverage consumption to increased risk for obesity, type 2 diabetes and CVD in the overall population and particularly among young adults( Reference Malik, Popkin and Bray 1 , Reference Bermudez and Gao 43 , Reference Hu 44 ). The combination of added sugars and citric acid in sports and energy drinks may also increase risk for poor dental health( 4 ). Citric acid is highly erosive because its demineralizing effects on dental enamel continue even after consumption of a beverage and pH neutralization.
The identified associations with patterns of substance use are in line with and build on previous studies among young adults, which have primarily focused on alcohol consumption among college students( Reference Velazquez, Poulos and Latimer 13 , Reference Marczinski 14 , Reference Brache and Stockwell 33 , Reference Miller 34 , Reference Woolsey, Waigandt and Beck 45 – Reference Malinauskas, Aeby and Overton 48 ). In the current study, linkages between energy drink consumption and binge drinking were observed in a diverse population that included both students and non-students. Additionally, the current study was among the first to examine and identify associations of energy drink consumption with smoking cigarettes, marijuana use and steroid use( Reference Park, Onufrak and Blanck 16 , Reference Miller 34 , Reference Snipes and Benotsch 49 ). The examination of linkages between sports and energy drink consumption and the use of other muscle-enhancing substances was particularly novel. The findings raise new concerns about subgroups of young adults who may be more likely to consume energy drinks and use various substances that pose health risks. Consuming high doses of caffeine in energy drinks along with alcohol or other substances is especially problematic as caffeine may lead individuals to underestimate substance-related impairments( Reference Ferreira, de Mello and Pompéia 50 , Reference Marczinski and Fillmore 51 ). With few exceptions, associations between sports drink and energy drink consumption and substance use were observed above and beyond a tendency to engage in sensation-seeking behaviours and thus our results suggest they are not just a mere representation of overall risk-behaviour patterns. Only one other study among US adults was found that similarly reported linkages between energy drink consumption and substance use persist after controlling for risk-taking propensity( Reference Brache and Stockwell 33 ).
Our findings that showed sports and energy drink consumption was more prevalent among young men and particularly those who spend more time engaged in physical activity, further reflect the initial targeted promotion of these drinks to male athletes( Reference Heckman, Sherry and Gonzalez de Mejia 52 ). However, recent reports indicate the target market is broadening as new products are being developed for women and those who are concerned with limiting carbohydrates (e.g. Damzl Fuel®, G2®)( Reference Heckman, Sherry and Gonzalez de Mejia 52 ). The findings suggest the need to address the aggressive and targeted marketing strategies used by sports and energy drink companies in an environment of limited product regulation( Reference Seifert, Schaechter and Hershorin 8 , Reference Reissig, Strain and Griffiths 37 , Reference Heckman, Sherry and Gonzalez de Mejia 52 , Reference Dietz and Dorfman 53 ). Marketing for sports and energy drinks is, in general, targeted towards teenagers and young adults aged 18–34 years through cross-promotional tactics such as integrating the product with extreme sporting events and popular music icons and product placement in youth-oriented media (e.g. video games, social networking sites)( Reference Seifert, Schaechter and Hershorin 8 , Reference Heckman, Sherry and Gonzalez de Mejia 52 , Reference Dietz and Dorfman 53 ). In addition, energy drink companies often use imaginative product names (e.g. Full Throttle, Monster Energy®, Cocaine®) that appeal to this demographic and problematically some names also glamorize substance use. The energy drink Cocaine is an example of a product that has further glorified substance use in promotions by posting video clips on the company website that showed consumers ‘snorting’ the liquid beverage( Reference Reissig, Strain and Griffiths 37 ).
The development of these sub-markets may play a role in explaining our new findings that linked sports and energy drink consumption to the use of weight-control behaviours. Sports drinks were linked to breakfast skipping and the use of less extreme forms of unhealthy weight-control behaviours (e.g. eating very little food) only among females. Energy drinks were linked to breakfast skipping and less extreme forms of unhealthy weight-control behaviours among both males and females, as well as dieting among females. These findings point to a need for further research to identify how sports and energy drinks are used by young adults seeking to lose weight and how this use may hinder their weight-loss efforts or even worse pose additional health risks. For example, little is known about the interactions between substances found in diet pills, caffeine and other energy drink ingredients and whether those interactions may lead to harm, particularly among individuals with certain medial conditions or who take certain prescription medications( Reference Pray, Yaktine and Pankevich 36 , Reference Seifert, Seifert and Schaechter 54 ). Young adults who might alternatively consume a sports or energy drink while exercising could easily consume a large portion of the energy they expend if they do not select a low-sugar or sugar-free drink (e.g. one 24floz (710 ml) can of Monster Energy drink contains 1381 kJ (330 kcal)).
A number of strengths and limitations are important to address in drawing conclusions from the present study. The early years of adulthood are understudied and the large sample of young adult participants was diverse in terms of race, educational achievement, student status and parental status( Reference Nelson, Story and Larson 6 ). The study also used a comprehensive survey and validated FFQ to identify sociodemographic characteristics and health-risk behaviours associated with sports and energy drink consumption among young adults; however, several factors were assessed with brief measures to avoid excess participant burden. The single items used to separately assess intake of sports and energy drinks for the current study are particularly noteworthy, as only frequency of consumption was measured while there are numerous types of these drinks on the market that vary considerably in nutritional composition and volume. As the measures of sports and energy drink consumption were not included on previous Project EAT surveys, the study was further limited by a cross-sectional design. The results may not be generalizable to other young adult populations outside the Midwest. Additional research using longitudinal designs and in other population samples will be needed to establish temporality and confirm that the observed associations are broadly relevant.
Despite the need for future research, the results suggest health professionals should be aware of the clustering of sports and energy drink consumption with other unhealthy behaviours. The results indicate a spectrum of health behaviours that impact obesity and chronic disease should be considered in the design of programmes and services for young adults, including eating habits, physical activity, media use, sleep patterns and substance use. For example, young adults who report substance use should be provided with anticipatory health guidance regarding the masking effects of caffeine in energy drinks on substance-related impairments. Similarly, providers who encounter young adults with weight-loss goals should counsel them regarding eating and drinking habits that will best enable them to achieve appropriate changes in weight while maintaining good health. Finally, health professionals can also have a positive impact on population health through advocacy addressing the targeted marketing of sports and energy drinks to young adults and lack of US labelling regulations for these products.
Acknowledgements
Financial support: This work was supported by the National Heart, Lung, and Blood Institute (grant number R01HL084064; Principal Investigator D.N.-S.). Additional salary support was provided by the National Cancer Institute (grant number K07CA126837; Principal Investigator M.N.L.). The content is solely the responsibility of the authors and does not necessarily represent the official views of the National Heart, Lung, and Blood Institute; the National Cancer Institute; or the National Institutes of Health. Conflict of interest: None. Authorship: N.L. conducted the statistical analysis and drafted the manuscript. M.N.L. and M.S. helped to conceptualize the analysis plan. D.N.-S. conceptualized the larger Project EAT-III study design and oversaw data collection. All authors contributed to the interpretation of results and manuscript revisions. Ethics of human subject participation: All study protocols were approved by the University of Minnesota’s Institutional Review Board Human Subjects Committee.


