


High consumption of sugar-sweetened beverages is often blamed as an important contributor to the obesity epidemic in both adults( Reference Nestle 1 , Reference Bray, Nielsen and Popkin 2 ) and children( 3 , Reference Ludwig, Peterson and Gortmaker 4 ). A systematic review and meta-analysis of eighty-eight studies has shown a clear association between the intake of sugar-sweetened beverages and body weight in adults( Reference Vartanian, Schwartz and Brownell 5 ). Evidence also strongly supports a link between sugar-sweetened beverage consumption and adiposity in children( 3 , Reference Ludwig, Peterson and Gortmaker 4 ). Therefore, limiting the consumption of these beverages is highly advocated to prevent childhood obesity( Reference Davis, Gance-Cleveland and Hassink 6 , 7 ).
The WHO currently recommends limiting the amount of daily energy derived from refined sugar to a maximum of 10 % for both adults and children( 8 ), and a reduction of changing the cut-off to 5 % is currently under discussion( 9 ). The suggested limits on intake apply to all monosaccharides derived from food and beverages. For children, the consumption of energy-free or low-energy beverages such as water, unsweetened teas or diluted juices is recommended( 10 ).
In Switzerland, children aged 10–12 years consume on average 390 ml soft drink/d, which is within the range of other European countries( Reference Herzig, Dossegger and Mader 11 ). Depending on the beverage type, this amount can supply 8–10 % of a 10-year-old's energy needs without providing essential nutrients and is, therefore, considered a public health concern. In the USA, sugar-sweetened soft drinks deliver about 20–24 % of 2- to 19-year-olds' energy intake( Reference Troiano, Briefel and Carroll 12 ). Of particular concern are energy drinks( Reference Seifert, Schaechter and Hershorin 13 , Reference Reissig, Strain and Griffiths 14 ) that are extremely high in sugar (>188 kJ/100 ml) and caffeine. These drinks have become very trendy among children and adolescents during the last few years, and consumption has steadily increased since their introduction to the market( Reference Currie, Zanotti and Morgan 15 ). In the USA, the average annual growth rate in energy drink sales was 55 % from 2002 to 2006( Reference Reissig, Strain and Griffiths 14 ). Half of the energy drink market consists of children, adolescents and young adults( Reference Seifert, Schaechter and Hershorin 13 ).
Researchers have shown that from 6 years of age onwards, children start to discriminate between food types and can understand which products are good for their health( Reference Strachan and Pavie-Latour 16 ). However, such knowledge does not necessarily mean they will make healthy choices( Reference von Normann 17 ), as children and adolescents are more influenced by appealing taste, aesthetics and ‘play’ features such as funny shapes( Reference Elliott 18 ) than the attribute of ‘healthiness’( Reference Croll, Neumark-Sztainer and Story 19 , Reference Fitzgerald, Heary and Nixon 20 ), and unhealthy foods and beverages are marketed to attract children( Reference Story and French 21 , Reference Harris, Pomeranz and Lobstein 22 ).
Besides advertisement and food attributes, social agents such as school, peers and family have a major influence on children's food behaviour( Reference Bevelander 23 , Reference Toumpakari and Haase 24 ). Parents play an important role in adolescents' eating behaviour( Reference Golan and Crow 25 ), and they have a major influence on their children's intake of sugar-sweetened beverages, acting as role models of consumption behaviour and as gatekeepers for the availability and accessibility of these beverages at home( Reference Bere, Glomnes and te Velde 26 ). More restrictive parenting practices have been associated with lower consumption of sugar-sweetened beverages( Reference van der Horst, Kremers and Ferreira 27 ). However, as parental control begins to diminish and adolescents exercise more autonomy over food, their food choices tend to become less healthy( Reference Fitzgerald, Heary and Nixon 20 ).
Although a considerable body of research has investigated children's health perceptions of food( Reference Croll, Neumark-Sztainer and Story 19 , Reference Atik and Ertekin 28 ), comparably little is known about how children perceive and distinguish between different types of beverages, and which product attributes children use to determine healthiness. Focus groups conducted with 13- to 15-year-old children in Bristol indicated that adolescents view beverage characteristics such as appealing flavours, sweet taste and eye-catching colours as positive characteristics. Furthermore, factors such as convenience, attractive packaging, increased social image and low cost are also appealing to adolescents( Reference Toumpakari and Haase 24 ). Another, qualitative, study conducted with Irish children and adolescents has suggested that the term ‘healthy eating’ is associated with ‘fruit’, organic food, carbohydrates, vitamins or water( Reference Fitzgerald, Heary and Nixon 20 ).
Children in Switzerland usually start school at the age of 7 years, which is when parental control over children's food choices partially diminishes and children start to make more independent choices. Previous studies have shown that as parental control begins to weaken, food choices become less healthy( Reference Fitzgerald, Heary and Nixon 20 ). The present study examined which criteria parents and their 7- to 10-year-old children use to judge the healthiness of a variety of soft drinks (water, sugar-sweetened drinks (subcategory of soft drinks containing added sugar), diet sodas (any carbonated soft drinks), fruit juices, energy drinks and other soft drinks).
Soft drinks are cold, non-alcoholic beverages, such as lemonade, fruit juice or a carbonated drink, that often contain a complex mixture of several ingredients including different types of sugars, fruit juices and concentrates, natural and/or artificial sweeteners and colours, minerals, vitamins or caffeine. To date, it is unclear which of the various product attributes shape children's health perceptions of soft drinks and whether children can distinguish between more and less healthy choices. This is important to determine, as soft drinks belong to the first independent product choices, and a high intake of sugar-sweetened beverages poses a risk to children's health. Furthermore, it is relevant to know whether children's and parents' health perceptions are related, as this would indicate whether parents might have the potential to influence children's choices in a positive or a negative direction.
Methods
Participants
Parents with children aged 7–10 years were invited by mail to participate in a study about children's food preferences and eating habits. The addresses from families in the region of Zurich with children in the above-mentioned age group were obtained from the Schober Information Group (Zurich, Switzerland), which keeps an address database generally used for tailored product advertisement. Children following a medically prescribed diet were excluded from participating. Written informed consent was obtained from all parents. The present study was conducted according to the guidelines laid down in the Declaration of Helsinki, and all procedures involving human subjects were approved by the ethics committee of the ETH Zurich (EK 2012-N-37).
The required sample size was calculated under the assumption that medium to large effects are of interest only. Therefore, for an α value of 0·05, a power of 0·90 and an effect size of 0·30, a sample size of about 100 persons is needed( Reference Cohen 29 ).
Initially, 102 couples were recruited to the laboratory, but two parent–child couples were excluded a priori: one parent did not understand the questionnaire language; another couple was excluded as the child did not want to fulfil the sorting task without the parent present.
Pre-test: beverage selection and validation of the sorting method
Previous studies have shown that healthy children are able to perform card-sorting tasks such as the Wisconsin Card Sorting Test( Reference Romine, Lee and Wolfe 30 ), and that they are able to discriminate between healthy and unhealthy foods to a certain extent( Reference Strachan and Pavie-Latour 16 ). However, to test whether children of this age group (7–10 years) are also able to sort a variety of beverages, a pre-test was conducted with ten parent–child couples. The dyads were recruited from the same pool as the study participants.
The pre-test also served to determine which beverage types and brands available on the market were familiar to the parents and children. To this end, thirty soft drinks commonly available in supermarkets in Switzerland were selected for evaluation.
In the pre-test, children and parents were independently interviewed on familiarity of the thirty soft drink brands. Familiarity was assessed with the question, ‘Do you know this beverage?’ Next, participants were asked to sort all familiar beverages in a line ranging from ‘unhealthy’ to ‘healthy’. The pre-test clearly showed that children aged 7–10 years had no problems sorting beverages, making distinctions and explaining their choices.
Beverages that were unknown to more than two participants were removed from the selection, leaving nineteen familiar soft drinks for the experiment. Raspberry squash was added to the selection, as several parents and children indicated during the pre-test that they would regularly consume this beverage. The final selection of beverages included sugar-sweetened soft drinks such as cola, diet sodas, and still and sparkling water, fruit juices and energy drinks.
A list of the selected beverages and their main characteristics is summarised in Table 1. All beverages had an equal volume of 0·5 litres. We decided not to include milk or milk products, as the nutrient profile of these products is more complex and not directly comparable with the other beverages. However, two beverages included in the study, Rivella and Rivella Blau (the diet version), have a milk serum base; however, they have a comparable nutritional profile with other sugar-sweetened drinks. With a market share of 15 % of all sugar-sweetened soft drinks, Rivella is quite popular in Switzerland( Reference Rivella 31 ).
Table 1 Beverage characteristics and parents' and children's mean health estimates (Mean ranks; mean values and standard deviations)

* Significant at P< 0·0025.
† Children were asked to indicate their liking on a scale of 1 (like), 2 (medium) or 3 (don't like).
‡ Parents and children independently sorted the beverages along a 3 m line ranging from ‘unhealthy’ (0 cm) to ‘healthy’ (300 cm). Multiple Wilcoxon signed-rank tests (Z) were performed to compare the parents' and children's health estimates. Therefore, Bonferroni correction was applied, and the significance level was set at P= 0·0025.
Experimental procedure
The parent and the child independently performed the beverage-sorting task in two separate experimental rooms simultaneously. Participants were shown a tray containing the twenty beverages (see Table 1) in a random order. Original beverage bottles were presented, except for tap water, which was filled into a neutral transparent 0·5-litre PET (polyethylene terephthalate) bottle. Children's familiarity and preference of all beverages was assessed in a short interview before they performed the sorting task. Familiarity was assessed with the question, ‘Do you know this beverage? (yes/no)’, and preference was assessed with the question, ‘Do you like this beverage? (yes/average/no)’. The experimenter noted the answer of the child.
Parents and children were instructed to place the beverages along a 3 m line ranging from ‘unhealthy’ to ‘healthy’. The participants were made aware that they could use the entire length of the line and that tied ranking was allowed. After completing the sorting task, the parents filled in a short questionnaire on their demographic information. Both parent and child were independently asked an open question about the criteria they had used to perform the sorting task and the attributes they consider make a beverage healthy or unhealthy. The experimenters carefully noted all the criteria mentioned. Subsequently, the child was led back to the room where the parent had performed the sorting task, and the child's weight and height were measured by the experimenter. After the parent–child couple had left, the distance that each beverage was positioned from the ‘unhealthy’ mark (reference point) was measured in both rooms. The lower the value for a beverage, the less healthy it was perceived.
Statistical analysis
Data were analysed using SPSS Statistics, version 20 (IBM).
Distance data were analysed using multidimensional scaling (MDS PROXSCAL) to represent (dis-)similarities among objects in a low-dimensional space( Reference Borg and Groenen 32 ). MDS is a potent technique for uncovering hidden structures in sorting data. For dimensional interpretation of the MDS configuration, property fitting( Reference Kruskal and Wish 33 ) was applied, using the sorting criteria mentioned by the participants in a linear regression to predict the configuration.
To identify and profile the beverage groups, hierarchical cluster analysis was conducted. Beverage clusters were identified based on children's and parents' sorting data by applying Ward's method. Ward's method for forming clusters joins objects based on minimising the minimal increment in the within or error sum of squares. Squared Euclidean distances were used as proximity measures in the clustering procedure. Dendrogram similarity scales generated by SPSS ranged from 0 (high similarity) to 25 (low similarity).
Average healthiness ratings of beverages were plotted and directly compared between the parents and their children by Wilcoxon signed-rank tests. The nominal significance level of P= 0·05 was adjusted to 0·0025 to correct for multiple testing (Bonferroni correction). Data are presented as mean ranks, means, standard deviations and Spearman's correlation coefficients (r s).
Results
Sample characteristics
A group of 100 children (forty-eight girls and fifty-two boys) and one of their parents (ninety-three mothers and seven fathers) participated and were included in the final analysis. The mean age of the children was 8·8 (sd 1·1) years, and they were, on average, normal weight (mean percentiles 52·2 (sd 24·6)). BMI percentiles were calculated from children's weight and height measurements using Centers for Disease Control and Prevention (CDC) growth charts. No significant sex differences were found in children for any of the anthropometric variables analysed.
Parents had a mean age of 43·3 (sd 4·5) years. About half of them had a medium level of education (n 49, 49 %), forty-two (42 %) had a high level of education, four (4 %) a low level and five participants (5 %) preferred not to answer the question.
Beverage-sorting criteria
An open question was used to find out the criteria the parents and children used for their evaluation. On average, the parents named four criteria (mean 4·1 (sd 2·0)) that they had used to sort the beverages, while the children mentioned only three criteria (mean 2·9 (sd 1·4)). All parents (100 %, n 100) and most children (n 83, 83 %) referred to ‘sugar content’ or ‘sweetness’ as a criterion. For parents, the second most important criterion was additives, such as artificial sweeteners, colours and aroma (n 60, 60 %), while these ingredients were mentioned by a smaller fraction of children (n 11, 11 %). The second most important criterion referred to by children was ‘fruit’ or ‘fruit content’ (n 28, 28 %). ‘Fruit content’ was also mentioned by a quarter (n 25, 25 %) of all parents. ‘Caffeine’ was named more frequently by parents (n 29, 29 %) than by children (n 9, 9 %).
‘Naturalness’ was frequently mentioned by parents (n 23, 23 %) but rarely indicated by children (n 5, 5 %). Criteria that were mentioned by at least five individuals in one group are shown in Fig. 1. Criteria mentioned only occasionally (n< 5) comprised ‘tooth health’, ‘chemicals’, ‘ecological reasons’, ‘preferences’, ‘feelings’ and ‘fat’.

Fig. 1 Frequency of the criteria that parents (![]() ) and children (
) and children (![]() ) mentioned as relevant for sorting the twenty beverages (n 100).
) mentioned as relevant for sorting the twenty beverages (n 100).
Multidimensional scaling and cluster analysis
Based on the distances resulting from the sorting task, two dissimilarity matrices, one for parents and one for children, were computed using the squared Euclidean distances between the beverages. The dissimilarity matrices were analysed with non-metric MDS PROXSCAL for parents and children independently. Multidimensional scaling uncovers underlying dimensions based on a series of similarity or distance judgments made by subjects. The MDS PROXSCAL analysis performed multidimensional scaling of proximity data to find a least-squares representation of the objects in a low-dimensional space( Reference Borg and Groenen 32 ).
The outcomes of the MDS analysis indicated a one-dimensional solution for both parents and children (Fig. 2). The stress-I values for one dimension indicated a good to acceptable fit of the model for parents (stress-I 0·073) and for children (stress-I 0·094)( Reference Backhaus, Erichson and Weiber 34 ), and the inclusion of additional dimensions did not significantly improve the model. The results suggested that one dimension was sufficient to represent the healthiness perceptions of beverages for both parents and children.

Fig. 2 Outcomes of the multidimensional scaling (MDS) analysis. Twenty beverages were sorted along a 3 m line ranging from ‘unhealthy’ to ‘healthy’ by (a) parents and their (b) children (n 100) independently. Different coloured beverage bottles were grouped into different clusters. *For these soft drinks, parents' estimates of healthiness were significantly lower than children's estimates. A colour version of this figure can be found online at http://www.journals.cambridge.org/bjn
For stability verification, we further performed a hierarchical cluster analysis using the method of squared Euclidean distances to place greater weight on the objects that were further apart. To form clusters of beverages, Ward's method, which joins objects based on minimising the minimal increment in the within or error sum of squares, was used. The results of the cluster analysis are shown in Fig. 3. The best cluster solution was determined based on the elbow criterion in the sum of the squared error scree plot( Reference Backhaus, Erichson and Weiber 34 ). For children, the elbow criterion indicated a four-cluster solution, while it was not definite for parents. However, visual inspection of the parents' dendrogram (Fig. 3(a)) supported a four-cluster solution. The four-cluster solutions for parents and children are indicated as different coloured beverage bottles in Fig. 2.

Fig. 3 Results of the hierarchical cluster analysis using the Ward linkage method for the beverage-sorting task performed by (a) parents and their (b) children (n 100). Distances are rescaled to a range of 0–25, which is a standard procedure( Reference Mooi and Sarstedt 47 ).
The parents' and children's clusters were very similar. Still water, sparkling water and tap water were clustered together, and fruit juices formed a second cluster, all of which were found on the healthier side. Squash, Elderflower soda and Rivella form an intermediate group. The children also placed grapefruit soda within this intermediate cluster, which was the only beverage they placed in a different cluster from their parents. Soda and diet soda beverages were clustered together on the more ‘unhealthy’ side with the iced tea, the energy drink and the sports drink by both parents and children. The dendrogram of the hierarchical cluster analysis further shows that while parents seemed to distinguish between diet and regular sugar-containing soft drinks, children did not seem to make such a distinction (Fig. 3).
The results of the cluster analysis provide a regional interpretation of the MDS solution. For a meaningful interpretation of MDS, property fitting was conducted( Reference Kruskal and Wish 33 ). Sugar, fruit, artificial sweetener and caffeine contents were mentioned most often as the criteria for sorting the beverages (by >24 % of all parents, >8 % of all children). Therefore, property fitting with the respective predictors was performed to predict the dimensional weights of the beverages. Hence, a linear regression was conducted for parents and children, with sugar content (g/l), fruit content (%), artificial sweeteners and caffeine content (1 = contained, 0 = not contained) as predictive variables and dimensional weights as the dependent variable. The results of property fitting are given in Table 2.
Table 2 Property fitting for the prediction of multidimensional scaling coordinates by sugar, fruit, caffeine and artificial sweetener content (n 20 beverages) (Coefficient values with their standard errors)
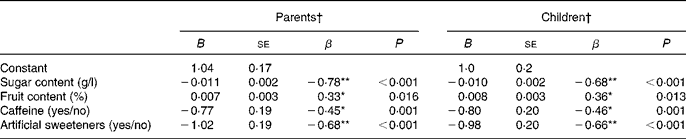
* P< 0·05, **P< 0·001.
† Model parents: R 2= 0·92, adjusted R 2= 0·80. Model children: R 2= 0·91, adjusted R 2= 0·77.
High sugar content was the strongest predictor of perceived unhealthiness in parents and children (βchildren= − 0·68, βparents= − 0·78; P< 0·001). The second most powerful predictor was whether a soft drink contains artificial sweeteners or not (βchildren= − 0·66, βparents= − 0·68; P< 0·001). Beverages containing artificial sweeteners were perceived as less healthy by both parents and children. A beverage containing caffeine was also negatively related to perceived healthiness (βchildren= − 0·46, βparents= − 0·45; P< 0·01). ‘Fruit content’ was the only factor that was positively associated with MDS coordinates and higher perceived healthiness (βchildren= 0·36, βparents= − 0·33; P< 0·05). The model explains 92 % of the variance for parents and 91 % for children.
Agreement between parents' and children's health perception
Mean ratings of parents and children were directly compared by Wilcoxon signed-rank tests. The P value was adjusted to correct for multiple testing effects. Orange and multi-fruit juices were judged as significantly healthier by children compared with parents (orange juice: Z= − 3·78, P< 0·001; multi-fruit juice: Z= − 5·02, P< 0·001). In addition, grapefruit soda (Z= − 4·68, P< 0·001) and the energy drink (Z= − 3·14, P< 0·001) were rated as healthier by children compared with parents. The mean health estimates and test results of all beverages are presented in Table 1.
For each parent–child couple, a correlation coefficient of the ranked health estimates was calculated. The mean spearman's correlation coefficients of the health estimates for all parent–child couples (r s 0·70 (sd 0·15)) indicate a strong relationship between the children's and parents' ranking order.
No sex differences for children were found in any of the analyses.
Discussion
Parents' and children's perceptions of the healthiness of soft drinks proved to be strongly related and mainly determined by sugar, artificial sweetener, fruit and caffeine content of a beverage. The strong association between parents' and children's assessments is in accordance with previous literature that had shown that parents act as role models and gatekeepers for beverage consumption( Reference Bere, Glomnes and te Velde 26 ).
Sugar content was the most important criterion for both parents and children to assess the healthiness of a beverage. Soft drinks with a high concentration of sugar, caffeine and artificial sweeteners were perceived unhealthy by both parents and children, who both placed the energy drink closest to the ‘unhealthy’ mark. Parents and children frequently commented on this specific beverage type as ‘very bad’ or even ‘evil’. Several children spontaneously mentioned beverage attributes such as caffeine or additives. As one might expect 7- to 10-year-old children to be unfamiliar with these terms, this finding may reflect a high level of parental influence in this age group.
According to the results of the MDS analysis, Rivella and its diet version were perceived as more healthy than one would expect from their nutritional profiles. The diet version contains artificial sweeteners, and the regular drink has high sugar content comparable with other sugar-sweetened soft drinks (see Table 1 for the beverage comparison). However, it is likely that Rivella had a more positive image because it is advertised based on its milk serum content, which contains certain water-soluble elements of cows' milk.
Most children did not distinguish between light and regular soft drinks and were not able to tell the difference between a light and a regular soda. Nevertheless, property fitting indicated that the artificial sweetener content negatively affected the health perceptions of both participant groups. Parents have probably influenced their children's perceptions of diet beverages, as children gave similar health estimates to their parents; however, they rarely knew the differences between light and regular beverages. Parents usually made a distinction between light and regular soft drinks, but when asked whether the light or the regular version would be healthier, individuals were usually not conclusive. Some mothers believed a light variant would be healthier because of the reduced energy content, but did not consider it an important attribute for a child. Other parents noted that a light beverage would be preferred for reasons of dental health. Overall, the aggregated data show that participants perceived diet beverages to be healthier than their regular counterparts.
Moreover, many parents and some children mentioned that CO2 in sodas would have negative effects on health. Carbonation per se does not have negative health consequences( Reference Parry, Shaw and Arnaud 35 – Reference Tucker, Morita and Qiao 39 ); however, consumers might relate carbonation to sugar-containing soft drinks. Furthermore, the German word for CO2 ‘Kohlensäure’ contains the word ‘acid’, which may have led to negative connotations associated with ‘acidity’ by many parents.
The percentage of fruit contained in a beverage was related to more positive, healthy perceptions by both parents and children; however, ‘fruit content’ was a slightly more important criterion for children than for parents, which could have led to the differences in the mean healthiness ratings of beverages such as orange juice, multi-fruit juice and grapefruit soda. Children perceived these beverages to be slightly healthier than did their parents. It could be hypothesised that parents were probably more aware that fruit juices is also high in natural sugars. Nevertheless, ‘natural’ sugar found in fruit juices is probably perceived as healthier than added sugar found in sodas. A recent experiment conducted by Siegrist et al. ( Reference Siegrist, Cousin and Sütterlin 40 ) demonstrated that consumers perceived breakfast cereals as healthier if they were labelled to contain fruit sugar (fructose), compared with when the same cereals were labelled to contain sugar.
Certain beverages such as squash and grapefruit soda have very low fruit content and barely any nutritional value, and they might, therefore, be problematic for a child's nutrition. The low fruit content in these beverages could act as a ‘health halo’ that leads to a positively biased health estimate( Reference Chandon and Wansink 41 ).
The different types of water were perceived as the healthiest beverages, whereby tap water was ranked above still water and sparkling water, which possibly reflects the very high quality of tap water throughout Switzerland( 42 ). Interestingly, perceived high water content was an important criterion for evaluating the healthiness of a beverage by both children and parents. This finding is in accordance with a qualitative study conducted in Ireland, which found that children associated ‘water’ with healthiness( Reference Fitzgerald, Heary and Nixon 20 ). Although, in practice, all soft drinks contain similar amounts of water, several parents and children referred to a high water content in squash, probably because this beverage is usually prepared at home by adding water to syrup; it is possible that making the drink themselves with tap water creates a positive bias towards the health perception of squash. A study conducted by Dohle & colleagues( Reference Dohle, Rall and Siegrist 43 ) found that people preferred and consumed more smoothies when they had prepared the beverage themselves compared with when it was prepared for them by the experimenter.
In this regard, squash may be especially problematic; squash is very popular with children in Switzerland( Reference Schornoz 44 ). All of the children in the present study were familiar with squash, very few indicating a dislike for the beverage. Squash received a high average liking score and the beverage was even more popular than cola. However, actual consumption data of this beverage by children are lacking. When prepared according to the recipe (one part of the syrup with five parts of water), regular raspberry squash contains about 140 g/l of sugar. Although the sugar content depends on the dilution level of the syrup, which depends on consumers' preferences, this amount of sugar seems to be rather high (for comparison, cola contains 107 g/l). Nevertheless, the data indicate that parents and children perceived squash as comparably healthy. We hypothesise that this could be due to the high ‘perceived water content’ and the fruit component, which participants frequently referred to while sorting this beverage.
Furthermore, squash was often referred to as being a ‘natural’ beverage. We explain this with the circumstance that, in general, regular syrups on the Swiss market do not contain an aroma, artificial colours or sweeteners. Similar to previous findings that ‘naturalness’ is an important attribute for consumers to evaluate a product( Reference Rozin, Spranca and Krieger 45 , Reference Lahteenmaki 46 ), ‘naturalness’ was mentioned by many parents and several children as a relevant criterion.
Certain limitations of the present study need to be addressed. As the participants were recruited in the area of Zurich, they are not representative of the Swiss population. In addition, the education level of the parents was higher and children's body weight lower than the national average. It is possible that overweight children would have sorted the beverages differently.
Nevertheless, to our knowledge, this is the first study that assessed children's and parents' health perceptions of different soft drinks using a sorting task and could thus quantify the relative importance of various ingredients.
Conclusions
Little is known about how adults and children perceive different beverages available on the market. The present study shows that health perceptions of parents and their 7- to 10-year-old children were strongly related, and that sugar, artificial sweetener, fruit and caffeine contents are important attributes for predicting how a beverage is perceived. In addition to these determinants, naturalness and ‘perceived water content’ were important attributes for product perception in both participant groups. Although parents and children agreed on the healthiness of most beverages, children perceived certain fruit juices as healthier compared with their parents. This misconception might be problematic, as juices are naturally high in sugar content and acidity, which promotes dental erosion. Still, juices can also contribute to the nutritional quality of a diet. However, based on the nutritional profile of raspberry squash, the healthiness of this beverage seemed overrated by children and parents. This is a major public health concern, as in many countries squash is a very popular beverage, which children start drinking at a young age.
The authors recommend focusing educational measures on raising consumer's awareness of the low nutritional quality of specific beverages, which contain not only little fruit, but also high amounts of sugar such as squashes, fruit lemonades and fruit sodas. The findings of the present study could help to tailor public health efforts in reducing children's soft drink consumption of problematic beverages. Furthermore, the results of the present study should increase the awareness of public health authorities and nutritional gatekeepers of beverages, which contain ingredients that could bias consumer's perceptions.
Future studies should particularly focus on how beverage health perceptions relate to preferences to build a basis for reformulating soft drinks in a way that is healthy and well accepted by different consumer groups.
Acknowledgements
The authors are grateful to the families who participated in this research and to all who assisted in the data acquisition.
The present study was partially supported by the Swiss Foundation for Nutrition Research (SFEFS). The SFEFS had no role in the design and analysis of the study or in the writing of this article.
The authors' contributions are as follows: T. B. and M. S. designed the study and the analyses; T. B. directed the study, conducted the analyses and wrote the manuscript by incorporating critical inputs from M. S. Both authors approved the final manuscript.
There are no conflicts of interest to declare.


