Consumption of dairy products is advocated by most dietary guidelines worldwide, as part of a balanced nutritional pattern and healthy overall lifestyle, for optimal health status( 1 , 2 ). Still, epidemiological and dietary intervention studies reveal a somewhat equivocal picture of evidence regarding the impact of dairy food intake on major public health concerns, including CVD( Reference Pereira, Jacobs and Van Horn 3 – Reference Crichton, Howe and Buckley 10 ), for which the circulating lipid profile is a classic biomarker. The majority of the studies in the current literature seem to overlook the lipid- and, thus, cardiovascular health-modulating influence of a key component in dairy foods, fatty acids (FA).
Milk and other dairy products are naturally rich in a multitude of dietary FA( Reference Jensen 11 ) that have independently been shown to exert varying health effects( Reference Hunter, Zhang and Kris-Etherton 12 ). Intake of medium-chain fatty acids (MCFA), of six to twelve carbon atoms (6 : 0–12 : 0), that typically constitute 8–22 % of total FA in dairy fat may lead to greater energy expenditure and, thus, better weight management( Reference St-Onge and Bosarge 13 , Reference Nosaka, Maki and Suzuki 14 ). Palmitic acid (16 : 0), the predominant dairy SFA, representing 22–35 % of its fat content, elevates circulating LDL-cholesterol (LDL-C) levels, however, with unclear effects on the risk of CVD( Reference Chowdhury, Warnakula and Kunutsor 15 ). Oleic acid (18 : 1n-9), the main MUFA in most foods, which usually represents 20–30 % of dairy FA, may protect against CVD via multiple mechanisms of action( Reference Kris-Etherton, Pearson and Wan 16 , Reference Teres, Barcelo-Coblijn and Benet 17 ). Whether or not the cluster of these FA is reflected in blood upon dairy product intake, possibly contributing to its impacts on lipid levels, is yet to be fully established.
On the other hand, some FA specific to dairy foods have been used as the biomarkers of long-term dairy fat intake in observational studies( Reference Wennersberg, Smedman and Turpeinen 8 , Reference Smedman, Gustafsson and Berglund 18 – Reference Mozaffarian, Cao and King 21 ) and, on some occasions, have been associated with altered health states( Reference Chowdhury, Warnakula and Kunutsor 15 , Reference Biong, Veierod and Ringstad 22 – Reference Mozaffarian, de Oliveira Otto and Lemaitre 25 ). Of these FA, pentadecanoic acid (15 : 0) and heptadecanoic acid (17 : 0) are traditional examples( Reference Smedman, Gustafsson and Berglund 18 ), whereas trans-palmitoleic acid (trans-16 : 1n-7) has only recently emerged as a potential biomarker of dairy product intake( Reference Mozaffarian, Cao and King 26 ).
The objective of the present study was to examine the impact of the recommended 3 servings/d intake of commercially available dairy products, over 4 weeks, on circulating FA and lipid profiles in healthy individuals. The study further sought to evaluate the capacity of certain odd-chained FA specific to dairy fat to serve as potential short-term biomarkers of intake.
Experimental methods
Study population
A multi-centre study involving two Canadian research institutes, the Richardson Centre for Functional Foods and Nutraceuticals (RCFFN) in Winnipeg, Manitoba, and the Institute of Nutrition and Functional Foods (INAF) in Québec City, Québec, was conducted to investigate the impact of short-term dairy product consumption on a constellation of risk markers of CHD in a healthy population. The experimental methods have been described elsewhere( Reference Labonte, Cyr and Abdullah 27 ). A total of 137 apparently healthy individuals were recruited in January through September 2011 by means of advertisements, e-newsletters and word of mouth. Inclusion criteria included the age of 18–70 years and two consecutive measures of 12 h fast circulating high-sensitivity C-reactive protein (hs-CRP) levels, an established biomarker of inflammation and hence cardiovascular health( Reference Ridker, Rifai and Rose 28 ), and the primary study outcome, between 1·0 and 10·0 mg/l taken over 2 weeks. An a priori-defined lower limit of 2·0 mg/l for hs-CRP was changed to 1·0 mg/l during the study to facilitate recruitment. Exclusion criteria included smoking, fluctuations in body weight, documented CVD, diabetes, monogenic dyslipidaemia, or any endocrine or gastrointestinal disorder, routine use of lipid-lowering, anti-hypertensive or anti-inflammatory medications, anaemia, and allergies or restrictions to dairy or other food products provided in the study. Individuals who took dietary supplements, in particular vitamin D, Ca, fish oil, n-3 fatty acids and probiotics, or Ca-enriched or soya products were asked to stop the intake before the commencement of the study. Female volunteers who were pregnant or breast-feeding did not take part in the study. The present study was conducted according to the guidelines laid down in the Declaration of Helsinki, and all procedures involving human subjects were approved by the Bannatyne Campus Research Ethics Boards (University of Manitoba) and by the CERUL (Research Ethics Board) of Laval University. Written informed consent was obtained from all subjects. The study was registered on Clinicaltrials.gov under identifier no. NCT01444326.
Study design and diets
A randomised, free-living, cross-over clinical trial was conducted concurrently at the RCFFN and the INAF. The study consisted of a 2-week run-in period followed by either of two diet sequences, DAIRY–CONTROL or CONTROL–DAIRY, where each treatment phase (DAIRY (commercial dairy products) and CONTROL (energy-equivalent control products)) lasted for 4 weeks and was separated by a 4- to 8-week washout period. Participants were randomised to the diet sequences by a computer-generated number order based on their screening circulating hs-CRP levels (with 1·0–2·0 and 2·0–10·0 mg/l levels considered as low and high, respectively), sex and centre to ensure adequate balance of the subgroups within each sequence. Before the start of the study, and when required throughout, participants received, and were asked to precisely comply with, general dietary advice in accordance with the nutritional guidelines for healthy eating, including lower intakes of SFA ( < 10 % of energy), trans-fat ( < 1 % of energy), dietary cholesterol ( < 200 mg/d) and Na ( < 2300 mg/d). With recommendations for 25–35 % of daily energy, total fat intake was not restricted; however, substituting saturated fats for unsaturated fats, as well as restricting the consumption of processed and energy-dense foods, were advocated. Participants were also instructed to limit their consumption of alcoholic beverages to 1 drink/d, or a maximum of 5 drinks/week, and caffeinated beverages to 2 cups/d, as well as to refrain from consuming soya and dairy products in hidden sources (e.g. pizza, pastry, pancake or cream). The recommendations highlighted that the present study was not a weight-loss programme and that participants should keep their level of physical activity constant at all times. A specific recommendation was set to limit the intake of dairy products to a maximum of 2 servings/d during the run-in and washout periods. During the DAIRY phase of the study, participants were provided with conventional dairy products, including low-fat (1 % fat) milk, low-fat (1·5 % fat) creamy stirred yogurt (fruit flavours), and regular (34 % fat) cheddar cheese on a weekly basis, and were asked to incorporate 3 servings of these products into their everyday diet as follows: 375 ml milk/d; 175 g yogurt/d; 30 g cheese/d. During the CONTROL phase, participants were provided with energy-matched control products each week, and were asked to consume 290 ml fruit juice, 156 ml of 100 % vegetable juice, 20 g cashews, and a 39 g cookie (prepared in our metabolic kitchens) everyday. To reach a net difference of 2–3 servings/d of dairy products, as recommended for adults by Canada's Food Guide( 1 ), no intake of dairy foods was allowed during the CONTROL phase. Table 1 summarises the composition of the food products provided in the present study.
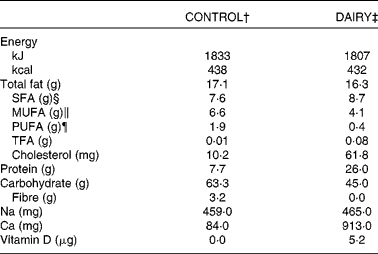
Table 1 Combined nutritional composition of the dairy and control products provided during the intervention*

CONTROL, energy-equivalent control products; DAIRY, commercial dairy products; TFA, trans-fatty acid.
* Data in this table, except for cholesterol, are reproduced from Labonté et al. ( Reference Labonte, Cyr and Abdullah 27 ).
† Including fruit juice (290 ml), vegetable juice (156 ml), cashews (20 g) and one cookie (39 g).
‡ Including 1 % fat milk (375 ml), 1·5 % fat yogurt (175 g) and 34 % fat cheese (30 g).
§ Sum of fatty acids (FA) 4 : 0, 6 : 0, 8 : 0, 10 : 0, 12 : 0, 14 : 0, 16 : 0, 18 : 0, 20 : 0 and 22 : 0.
∥ Sum of FA 16 : 1n-7, 18 : 1n-9, 20 : 1n-9 and 22 : 1n-9.
¶ Sum of FA 18 : 3n-3, 18 : 4n-3, 20 : 5n-3, 22 : 5n-3, 22 : 6n-3, 18 : 2n-6 and 20 : 4n-6.
Compliance to dietary intake
Compliance to the study's dietary protocols was assessed using a validated Web-based FFQ( Reference Labonte, Cyr and Baril-Gravel 29 ) completed at screening time and at the end of each dietary phase. Participants were also provided with checklists on each of their weekly visits and asked to report their daily consumption of the study products, as well as to indicate intakes of alcohol, caffeinated beverages and medications. Dietary compliance was confirmed by the measurement of serum levels of 25-hydroxyvitamin D (25(OH)D), a marker of vitamin D intake( Reference Bertrand, Giovannucci and Liu 30 ), at the end of each dietary phase.
Anthropometry and blood pressure
At screening, as well as at the start and end of each dietary phase, body weight and waist circumference were measured according to standardised procedures( Reference Callaway, Chumlea, Bouchard, Lohman, Roche and Martorel 31 ). Resting systolic and diastolic blood pressure measurements were taken after a 10 min rest in a sitting position by an automated blood pressure monitor (BPM 300-BpTRU model; Vital Signs Monitor, VSM MedTech Limited). Blood pressure data are presented as averages of three readings.
Blood sampling and biochemical parameters
At screening, serum lipid profile was assessed as described previously( Reference Couillard, Despres and Lamarche 32 ) and hs-CRP levels measured by nephelometry( Reference Pirro, Bergeron and Dagenais 33 ). At the start and end of each dietary phase, two 12 h fasted blood samples were collected and centrifuged within 1–2 h at 3000 rpm and 4°C for 20 min. Aliquots of serum, plasma, erythrocyte and leucocyte fractions were immediately prepared and stored at − 80°C until analysis. Serum lipid profiles, including total cholesterol (TC), HDL-cholesterol (HDL-C) and TAG levels, were determined in duplicate and levels averaged at the end of each dietary phase by a Roche/Hitachi Modular analyser (Roche Diagnostics) using Roche Diagnostics reagents. LDL-C levels were calculated according to the Friedewald formula( Reference Friedewald, Levy and Fredrickson 34 ). Framingham 10-year CHD risk scores (FRS) were estimated by the FRS online calculator( Reference D'Agostino RB, Vasan and Pencina 35 ) based on age, sex, systolic blood pressure, TC and HDL-C values of each participant at the end of each dietary phase.
Fatty acid profile
Plasma total lipids were extracted by the method of Folch et al. ( Reference Folch, Lees and Sloane Stanley 36 ) using chloroform–methanol (2:1, v/v) including 0·01 % butylated hydroxytoluene and heptadecenoic acid (17 : 1) as an internal standard (Sigma-Aldrich). Following extraction, FA were methylated with methanolic HCl. Separation of FA methyl esters was then completed on a Varian WCOT Fused Silica CP-SELECT FAME column (diameter 100 m × 0·25 mm and film thickness 0·25 μm; Varian Canada, Inc.) by a Varian 450 GC with a flame ionisation detector. The column was operated at 130°C for 2 min, after which the temperature was raised to 175°C at 25°C/min, held for 25 min, raised again to 240°C at 3°C/min, and held for 10 min. The total run time was 60·47 min, and samples were run with a 20:1 split ratio and a column flow rate of 0·8 ml/min with hydrogen as the carrier gas. Injector and detector temperatures were set at 270 and 290°C, respectively. Individual FA were identified via comparisons with known standards (NuChek Prep, Inc.), and were quantified and presented as percentages of total FA of interest according to the peak area relative to the total area.
Statistical analysis
Statistical analysis was performed using the SAS package version 9.2 (SAS Institute, Inc.). All values are expressed as means with their standard errors, unless otherwise indicated, with differences considered statistically significant at P< 0·05. Impacts of the two dietary treatments (endpoint values) on the outcomes of interest were compared using the PROC MIXED procedure for repeated measures, with diet, sequence and sex as fixed factors, and study centre and subjects as random factors in the selected model, unless otherwise stated. Spearman's correlation coefficient analyses were used to assess the relationship between plasma 25(OH)D and serum lipid levels, as well as between intakes of total SFA, MUFA, PUFA and MCFA, as estimated by the FFQ, and their corresponding FA levels in plasma. Abnormally distributed variables were natural log-transformed before statistical analysis.
Results
Participant characteristics and compliance
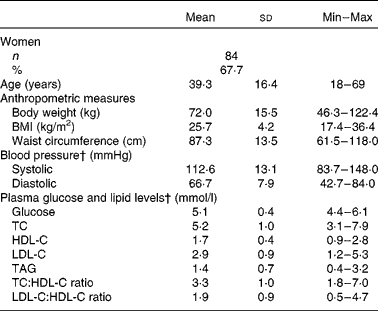
Of the 137 participants who were originally randomised to the study groups, 124 (eighty-four females and forty males) completed the intervention (Fig. 1). Baseline, represented by the screening time point, characteristics of the individuals who completed the study are outlined in Table 2. Seven eligible participants never started the study and six dropped out due to their inability to comply to the study protocol or for personal reasons. The FFQ data indicated good compliance to the DAIRY phase, evident by an average of 3·5 servings/d net difference between the intake of dairy and control products (P< 0·0001; Table 3). Akin to the ‘Milk and alternatives' food group, intakes of ‘Vegetables and fruit’, and ‘Meat and alternatives’, but not ‘Grain products’, food groups were also significantly different between the two dietary protocols (P< 0·0001 for both; Table 3). With regard to the daily energy and nutrient intakes, participants on DAIRY consumed more energy, SFA, dietary cholesterol, protein, Ca and vitamin D (P< 0·01 for all), but less total fat, MUFA, PUFA, total carbohydrates and fibre in comparison with CONTROL (P< 0·01 for all) (Table 4) . Compliance to the dairy product intake was confirmed by the significantly higher serum levels of 25(OH)D after the DAIRY phase compared with the CONTROL phase (76·4 (se 4·9) v. 67·8 (se 4·9) nmol/l, respectively; P< 0·0001).
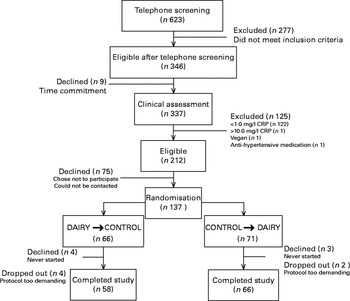
Fig. 1 Flow chart of the study design. CRP, C-reactive protein; CONTROL, energy-equivalent control products; DAIRY, commercial dairy products.
Table 2 Baseline characteristics of the study participants* (Mean values, standard deviations and minimum (Min) and maximum (Max) values)
TC, total cholesterol; HDL-C, HDL-cholesterol; LDL-C, LDL-cholesterol.
* At screening.
† Values are representatives of a subsample of sixty participants (Québec Centre).
Table 3 Daily food group intakes (servings/d) at screening and at the end of each dietary phase* (Geometric mean values and 95 % confidence intervals)
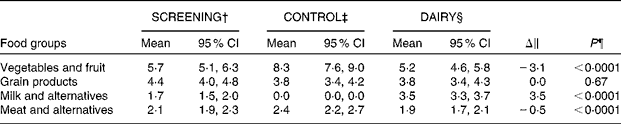
SCREENING, food and nutrient intakes of the participants prior to the dietary intervention (i.e. at screening time); CONTROL, energy-equivalent control products; DAIRY, commercial dairy products.
* Values are geometric means with log10 transformation.
† n 119 in the SCREENING phase as dietary data for five participants were excluded because of non-plausible energy intakes ( < 2092 or >14 644 kJ ( < 500 or >3500 kcal) in women and < 3347 or >17 573 kJ ( < 800 or >4200 kcal) in men).
‡ n 117 in the CONTROL phase as dietary data were missing for three participants and excluded for four participants because of non-plausible energy intakes (same criteria).
§ n 114 in the DAIRY phase as dietary data were missing for seven participants and excluded for three participants because of non-plausible energy intakes (same criteria).
∥ DAIRY–CONTROL.
¶ P values for the DAIRY v. CONTROL phase.
Table 4 Daily energy and nutrient intakes at screening and at the end of each dietary phase* (Geometric mean values and 95 % confidence intervals)

SCREENING,; CONTROL, energy-equivalent control products; DAIRY, commercial dairy products; TFA, trans-fatty acid.
* Values are geometric means with log10 transformation.
† n 119 in the SCREENING phase as dietary data for five participants were excluded because of non-plausible energy intakes ( < 2092 or >14 644 kJ ( < 500 or >3500 kcal) in women and < 3347 or >17 573 kJ ( < 800 or >4200 kcal) in men).
‡ n 117 in the CONTROL phase as dietary data were missing for three participants and excluded for four participants because of non-plausible energy intakes (same criteria).
§ n 114 in the DAIRY phase as dietary data were missing for seven participants and excluded for three participants because of non-plausible energy intakes (same criteria).
∥ P values for the DAIRY v. CONTROL phase.
There was no statistically significant difference in anthropometric and blood pressure measurements (P≥ 0·08) between the diets (Table 5). There was also no significant difference between the DAIRY and CONTROL phases in relation to plasma hs-CRP levels( Reference Labonte, Cyr and Abdullah 27 ).
Table 5 Anthropometry, blood pressure and biochemical parameters at the end of each dietary phase (Mean values with their standard errors)
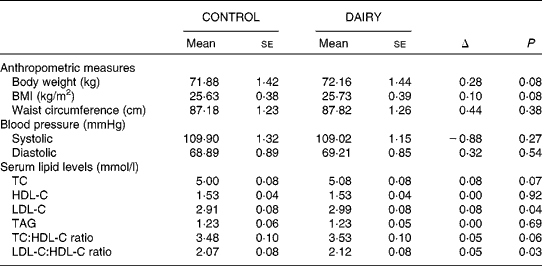
CONTROL, energy-equivalent control products; DAIRY, commercial dairy products; TC, total cholesterol; HDL-C, HDL-cholesterol; LDL-C, LDL-cholesterol.
Lipid profile and Framingham 10-year CHD risk scores
Except for LDL-C levels (2·99 (se 0·08) v. 2·91 (se 0·08) mmol/l; P= 0·04) and the LDL-C:HDL-C ratio (2·12 (se 0·08) v. 2·07 (se 0·08); P= 0·03), which were slightly higher after the DAIRY phase relative to the CONTROL phase, no difference was observed for the serum levels of TC, HDL-C, TAG or the TC:HDL-C ratio (P≥ 0·06) (Table 5). Spearman's correlation coefficient analyses detected an inverse relationship between plasma 25(OH)D levels and TC:HDL-C (r − 0·24; P= 0·007) and LDL-C:HDL-C (r − 0·22; P= 0·01) ratios after the DAIRY phase (Fig. 2). No significant differences in FRS values were observed during the DAIRY phase in comparison with the CONTROL phase (5·38 (se 0·49) v. 5·54 (se 0·51) %, respectively; P= 0·32)
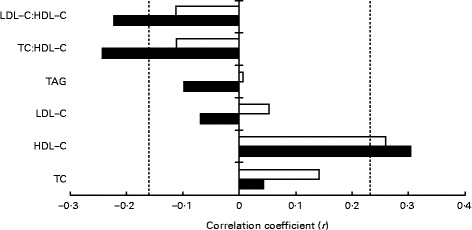
Fig. 2 Relationships between plasma 25-hydroxyvitamin D and lipid levels at the end of each dietary phase (Spearman's correlation coefficient data). - - - indicates significant associations (P< 0·05). CONTROL, energy-equivalent control products; DAIRY, commercial dairy products; LDL-C, LDL-cholesterol; HDL-C, HDL-cholesterol; TC, total cholesterol. ![]() , CONTROL;
, CONTROL; ![]() , DAIRY.
, DAIRY.
Plasma fatty acids
At the start of the trial, no statistically significant differences were observed in plasma FA levels, except for trans-16 : 1n-7 levels, which were slightly higher before the DAIRY phase than before the CONTROL phase (0·25 (se 0·00) v. 0·24 (se 0·01) % of the total identified FA; P= 0·003, data not shown). Table 6 summarises the circulating FA levels at the end of each dietary phase. Higher plasma levels of FA 15 : 0 and 17 : 0 (0·26 (se 0·01) v. 0·22 (se 0·01) % and 0·42 (se 0·01) v. 0·39 (se 0·01)% of the total identified FA, respectively; P< 0·0001 for both), and a trend of higher cis-9, trans-11-18 : 2n-6 levels (0·18 (se 0·01) v. 0·16 (se 0·01) % of the total identified FA; P= 0·06) were observed during the DAIRY phase compared with the CONTROL phase. There was no significant baseline CRP × diet interaction in determining the change in 15 : 0 (P= 0·88 for the CRP × dairy interaction), 17 : 0 (P= 0·72) or conjugated linoleic acid (CLA; P= 0·87). In other words, these FA were higher (or showed a trend of higher levels in the case of CLA) after the DAIRY (v. CONTROL) phase, regardless of the levels of CRP at baseline. Intake of dairy products also resulted in higher plasma levels of total SFA (P= 0·003), 18 : 3n-6 (P =0·03) and 22 : 1n-9 (P= 0·0006), as well as in SFA:MUFA and SFA:PUFA ratios (P =0·01 and 0·005, respectively), whereas the levels of cis-18 : 1n-7, 18 : 1n-9, 18 : 2n-6 and 20 : 1n-9 were higher after the CONTROL phase (P< 0·05 for all) (Table 6).
Table 6 Plasma fatty acid levels at the end of each dietary phase* (Mean values with their standard errors)

CONTROL, energy-equivalent control products; DAIRY, commercial dairy products; MCFA, medium-chain fatty acids.
* After excluding outlier fatty acid (FA) values based on mean ± 4 SD; one FA value was excluded from each of eighteen FA categories (6 : 0, 8 : 0, 12 : 0, 14 : 0, 15 : 0, 16 : 0, cis-16 : 1n-7, 18 : 1n-9, 18 : 2n-6, 18 : 3n-6, 20 : 0, 20 : 1n-9, 20 : 2n-6, 24 : 1n-9, total MUFA, total PUFA, MCFA and SFA:MUFA), two FA values were excluded from each of ten FA categories (10 : 0, trans-16 : 1n-7, cis-18 : 1n-7, 18 : 3n-3, 24 : 0, total SFA, total n-6 PUFA, n-6:n-3, SFA:PUFA and MUFA:PUFA), and three FA values were excluded from each of two FA categories (20 : 5n-3 and 22 : 5n-3).
† n 119 in the CONTROL phase as plasma samples were missing for five participants.
‡ n 121 in the DAIRY phase as plasma samples were missing for three participants.
§ Sum of FA 6 : 0–12 : 0.
Other FA of interest, including MCFA (sum of 6 : 0–12 : 0) and trans-16 : 1n-7 failed to show significant increases during the DAIRY phase (0·93 (se 0·05) v. 0·89 (se 0·04) % and 0·25 (se 0·01) v. 0·26 (se 0·01) % of the total identified FA; P= 0·43 and 0·15, respectively). Except for MUFA (r 0·17; P= 0·009), there were no correlations detected between intakes of total FA (i.e. SFA, PUFA and MCFA) as estimated by the FFQ and their corresponding FA levels in plasma (data not shown). However, correlations were observed between dietary intakes of certain long-chain PUFA, such as 22 : 6n-3 and their levels in plasma (r 0·22; P= 0·0007) as well as between dairy product intake and plasma FA 15 : 0 (r 0·27; P< 0·0001) and 17 : 0 (r 0·25; P= 0·0002).
Discussion
The present study assessed the impacts of the recommended intake of commercially available dairy products, specifically milk, yogurt and cheese, in Canada on circulating FA and lipid profiles. In comparison with a dairy-free CONTROL prudent diet, a 4-week intake of 3 servings/d of commonly consumed low-fat milk and yogurt products, and regular cheese resulted in higher plasma levels of the FA 15 : 0, 17 : 0, 18 : 3n-6, 22 : 1n-9 and 22 : 5n-3. This was accompanied by a small but statistically significant increase in serum LDL-C levels but not in other lipid levels.
Among the classes of food groups, the dairy food group is a subject of controversy when assessed for its impacts on cardiovascular health, in part owing to its value as a source of certain FA with established favourable implications and others with potential unfavourable implications( Reference O'Sullivan, Hafekost and Mitrou 37 , Reference de Oliveira Otto, Nettleton and Lemaitre 38 ). Still, a gap continues to exist in research examining the degree to which dairy fat intake is reflected in the circulating FA profile, a modulator of lipid levels and hence CVD risk.
In agreement with our hypothesis and data from a collection of mainly long-term observational studies( Reference Smedman, Gustafsson and Berglund 18 – Reference Wolk, Furuheim and Vessby 20 , Reference Biong, Veierod and Ringstad 22 , Reference Warensjo, Jansson and Cederholm 24 , Reference Brevik, Veierod and Drevon 39 – Reference Thiebaut, Rotival and Gauthier 41 ), the levels of plasma FA 15 : 0 and 17 : 0 were higher following the DAIRY phase in the present study. These two odd-chain SFA cannot be synthesised in the human body, and are specific to dairy fat and ruminant meat owing to the actions of the microbiome in the rumen of bovine species( Reference Wu and Palmquist 42 ), making them potential biomarkers of dairy product intake. Some studies have already associated the levels of 15 : 0 and/or 17 : 0 in the circulation or adipose tissue with positive( Reference Biong, Veierod and Ringstad 22 , Reference Warensjo, Nolan and Tapsell 43 )or negative( Reference Sun, Ma and Campos 23 ) cardiovascular impacts. A 2014 meta-analysis of data from four cohort studies involving 5490 participants has shown an association between higher circulating 17 : 0 levels and 23 % lower CHD risk( Reference Chowdhury, Warnakula and Kunutsor 15 ). Adding to these longer-term observations, we here provide evidence on the reflection of the FA 15 : 0 and 17 : 0 in plasma to a short-term dairy fat intake.
Although the sum of plasma SFA levels was higher after the DAIRY phase, no significant between-treatment differences were observed in the plasma levels of other individual SFA that are naturally found in higher proportions in dairy products, such as 14 : 0, 16 : 0 and 18 : 0. This is not surprising given the possible de novo synthesis of most SFA from carbohydrates or their endogenous desaturation into MUFA( Reference Nakamura and Nara 44 ); thus, circulating SFA could, but may not necessarily, reflect dietary SFA intake. In contrast, the sum of plasma MUFA levels was not different between the two treatments, although plasma levels of certain MUFA, such as 18 : 1n-9, were, in particular, higher after the CONTROL phase, probably as a result of the intakes of cashews, which contain approximately 27 g 18 : 1n-9/100 g serving( 45 ), and/or the endogenous synthesis from 18 : 0 via Δ9-desaturation( Reference Nakamura and Nara 44 ). Another FA of interest that did not show higher levels during the DAIRY phase in the present study was trans-palmitoleic acid, the circulating levels of which have been shown to reflect whole-fat dairy product consumption in recent cohort-based multivariate analyses( Reference Mozaffarian, Cao and King 26 ). This lack of change is possibly due to our use of low-fat dairy products, except for cheese (30 g/d), and the relatively short-term duration of intake. Additionally, trans-palmitoleate is not specific to dairy fat, as it can also be principally derived from other ruminant fat sources or, further, synthesised in the body( Reference Jaudszus, Kramer and Pfeuffer 46 ).
Plasma levels of three other individual FA were also found to be higher after the 4-week intake of milk, yogurt and cheese, including cis-9, trans-11-18 : 2n-6 (a trend), 18 : 3n-6 and 22 : 1n-9. An increase in the circulating levels of CLA was expected given that dairy products are natural sources of this FA, although there is a paucity of studies examining the association. This observation replicated those from a 2008 study, where circulating CLA contents increased in a dose–response manner with CLA supplementation( Reference Zlatanos, Laskaridis and Sagredos 47 ). The increase in the plasma levels of 18 : 3n-6 and 22 : 1n-9 during the DAIRY phase in the present study was not expected and can perhaps be attributed to the study's free-living design, and the presentation of individual FA values as standard percentages of total where certain FA might have shown increases in compensation for decreases in other FA. This possibility warrants verification via replication and mechanistic studies.
The absence of an increase in the plasma levels of MCFA during the DAIRY phase can be attributed to the fact that two of the three dairy products consumed had a low fat content. The unique metabolism of MCFA can also be considered to explain the lack of change in these FA plasma levels after the DAIRY phase. During digestion, MCFA bypass the chylomicron formation in the small intestine, directly entering the portal circulation for rapid and more complete oxidation in the liver( Reference Papamandjaris, MacDougall and Jones 48 ). This is evident by the data derived from some studies associating intakes of MCFA in oil formulas with increased fat oxidation( Reference Alexandrou, Herzberg and White 49 ) and energy expenditure( Reference St-Onge, Bourque and Jones 50 ), or decreased body fat mass( Reference St-Onge and Jones 51 ). However, no study has reported a reflection of dairy-specific MCFA in plasma, calling for further investigation.
The observed slight but statistically significant increase in serum LDL-C levels and the LDL-C:HDL-C ratio after 4 weeks on DAIRY in comparison with CONTROL may, in part, be attributed to the reported higher intake of SFA (10·7 v. 8·5 % of total energy intake, respectively; P< 0·0001). However, in the absence of significant correlations, it is more likely that higher intakes of certain foods, such as cashews, fruits, and vegetables, or nutrients, such as dietary fibre and phytosterols played a protective role during the CONTROL phase. For instance, although not unambiguous or without exception( Reference Mukuddem-Petersen, Stonehouse Oosthuizen and Jerling 52 ), nuts have been shown to have cholesterol-lowering effects( Reference Sabate, Oda and Ros 53 ). In any case, considering the 0·08 mmol/l difference between the two treatments and Cohen's d value of 0·09( Reference Cohen 54 ), the effect size on LDL-C is trivial and suggests no clinical significance as is further evidenced by the comparable FRS at the end of each dietary phase. These observations support the majority of clinical trials in the literature, showing that dairy product intakes have neutral effects on lipid profiles( Reference Da Silva and Rudkowska 55 ), and observational studies that have often shown their association with a lower risk of CHD and all-cause mortality( Reference Elwood, Pickering and Hughes 56 – Reference Elwood, Pickering and Givens 58 ).
The present study has several strengths. It is the first and, to our knowledge, the largest cross-over study to examine the impacts of the recommended 2–3 servings/d intake of certain dairy products, particularly in Canada, on the circulating FA profile. The large number of participants increased our statistical power. The free-living design and use of various commercially available, and widely consumed, products mimicked the everyday diet of the general public, and are hence more relevant to a real-life scenario. However, there are some limitations. The study treatments were by nature different in more than one nutrient, which limited our potential ability to precisely identify the dietary factor(s) responsible for a given health effect. The reported between-treatment differences in servings/d of ‘Vegetables and fruit’, and ‘Meat and alternatives’ food groups, although expected by study design, may limit the generalisability of our findings when considering that dairy products can be replaced by other food products as well. The use of cashews during the CONTROL phase may be seen as a limitation in terms of lipid evaluation. FFQ are susceptible to self-reported errors, resulting in over- or under-estimations of intake. Still, the observed difference in dietary intake between the DAIRY and CONTROL phases perfectly matched our experimental prescription, when statistical analyses on the food intake database that excluded products of the intervention indicated a close similarity in the participants' background diets during the two dietary phases (data not shown). Data on circulating lipid levels are presented for the endpoint of each dietary phase based on a single blood sampling; however, given that lipid profiles naturally experience day-to-day fluctuations, a better estimation would have been achieved via repeated sampling and calculations of means. Also, a FA analysis of the study products would have been helpful when correlating dietary intake with circulating levels. These points support the future need for fully controlled clinical studies, and repeated laboratory assessments, to best evaluate the reflection of circulating FA and lipid profiles to a recommended dairy product consumption. The role of genetic variations in influencing responses of these health biomarkers to dairy product intake is another fruitful area of research.
In conclusion, the present study provides evidence that the intake of 3 servings/d of conventional dairy products, particularly milk, yogurt and cheese, in the context of a healthy-style diet, may modify the circulating FA profile in a manner that enables detectable changes in the cardioprotective FA 15 : 0 and 17 : 0, with a minor effect on the lipid profile.
Acknowledgements
The authors thank the participants who took part in the study. The authors greatly appreciate the Clinical Coordinators, nurses, metabolic kitchen staff and laboratory staff at the RCFFN and INAF for their assistance and expertise. The authors specially thank Meriam Mohammed, Jehanne Mercy, Tess Pallister, Danielle Aubin and Steve Larouche for their help with the subject recruitment and other clinical aspects. The authors acknowledge Tess Pallister and Dennis Labossiere for assisting with the FA extraction and providing technical support on the GC–flame ionisation detector technique, respectively. M. M. H. A. was a recipient of Kuwait University Scholarship for Graduate Studies and NSERC-CREATE FAST (Food Advancement through Science and Training) scholarship. M.-E. L. was a recipient of doctoral scholarships from the Canadian Institutes of Health Research and the Fonds de Recherche du Québec – Santé.
The present study was supported by the Dairy Research Cluster Initiative (Agriculture and Agri-Food Canada, Dairy Farmers of Canada, the Canadian Dairy Network, and the Canadian Dairy Commission). The funding agencies had no role in the design and analysis of the study or in the writing of this article.
The authors' contributions are as follows: B. L., P. C. and P. J. H. J. designed the study; P. C. was responsible for the screening and medical supervision of the study participants; M. M. H. A., A. C. and M.-C. L. coordinated the clinical trial and managed other aspects of the research; M. M. H. A. performed the statistical analysis, interpreted clinical and laboratory data, and wrote the manuscript; M.-E. L. contributed to the nutritional data and statistical analysis; B. L. and P. J. H. J. had primary responsibility for the final content. All authors critically reviewed the manuscript and approved its final version.
Conflicts of interest: P. J. H. J. received funding from the Dairy Farmers of Canada, Danone, Inc., and Agriculture and Agri-Food Canada; P. C. and B. L. received funding from the Dairy Farmers of Canada, Agriculture and Agri-Food Canada, and Dairy Australia; B. L. received funding from Danone, Inc. and he is the Chair of the Expert Scientific Advisory Committee (ESAC) that reviews funding applications as part of the funding programme of the Dairy Farmers of Canada. M. M. H. A., A. C., M.-C. L. and M.-E. L. have no conflict of interest to declare.