


Vitamin A deficiency is a leading cause of preventable blindness and a risk factor for severe infection and associated illness and death( Reference Black, Victora and Walker 1 ). In Indonesia, severe deficiency( Reference Sandjaja, Budiman and Harahap 2 ) and its clinical manifestation xerophthalmia have declined steadily over past decades( Reference Muhilal, Tarwotjo and Kodyat 3 ), but mild and moderate deficiency remain prevalent in pregnant and lactating women and children of pre-school age. Indonesia’s rice- and vegetable-based diet provides little bioavailable vitamin A( Reference Murphy and Allen 4 , Reference de Pee, West and Muhilal 5 ), and poverty and food insecurity result in suboptimal diet quality and variety, which correlate with poor vitamin A status( Reference Campbell, Thorne-Lyman and Sun 6 – Reference de Pee, Bloem and Satoto 8 ).
Fortification of vegetable oil with vitamin A is a cost-effective strategy to improve vitamin A status( 9 – Reference Martianto, Riyadi and Marliyati 11 ), including in infants whose vitamin A status depends on the nutritional status of their mothers( Reference Black, Victora and Walker 1 , Reference Dijkhuizen, Wieringa and West 12 ) and in vulnerable groups not covered by periodic supplementation. A feasibility study confirmed vitamin A fortification of cooking oil as a feasible intervention for Indonesia( Reference Martianto and Komari 10 ). Over 80 % of Indonesians from all socio-economic groups consume unbranded palm oil daily. Most of the oil comes from a few large producers and reaches households within 3–4 weeks following production, typically allowing considerable vitamin retention( Reference Martianto and Komari 10 , Reference Martianto, Riyadi and Marliyati 11 ). Fortification of palm-based cooking oil at 40 IU/g (i.e. 12·1 mg/kg) could contribute 30 % of the daily Recommended Nutrient Intake (RNI) for vitamin A for children under the age of 5 years and 30–41 % of the RNI for women( Reference Martianto and Komari 10 , Reference Martianto, Sumedi and Soekatri 13 ).
With support from the Global Alliance for Improved Nutrition (GAIN), Indonesia’s Nutrition Foundation for Food Fortification and the National Institute of Health Research and Development of Indonesia’s Ministry of Health piloted fortification of unbranded palm oil with vitamin A in West Java. Within this pilot, a coverage and impact evaluation measured retention of vitamin A in fortified oil through the distribution chain and the effects on vitamin A intake and retinol status of pre-school and school-age children, women of reproductive age and lactating mothers. We compared serum and breast milk retinol concentrations between two household surveys conducted just before fortification started (June–July 2011) and a year thereafter, in relation to vitamin A intake from oil and other dietary and socio-economic determinants.
Methods
Oil fortification programme
The pilot was implemented with one of the largest cooking oil refineries, Sinar Alam Permai (PT-SAP) of the Wilmar Group. PT-SAP produced unbranded palm oil in its factory in South Sumatera, adding retinyl-palmitate premix (1·7 million IU/g, i.e. 514 000 mg/kg; supplied by BASF SE and DSM Nutritional Products Europe Ltd) at the time of loading barges for shipment to a West Java distribution centre. Fortification was at the Indonesian National Standard (SNI) level of 45 IU retinol/g (i.e. 13·6 mg retinol/kg). The fortified oil was shipped to a West Java distribution centre which supplied district-level distributors, who further distributed the oil to sub-distributors down to small neighbourhood shops/stalls (warung), without programme intervention. Oil was sold either via bulk containers from which consumers filled their own bottles, or via individual plastic sachets( Reference Martianto and Komari 10 , Reference Martianto, Riyadi and Marliyati 11 , Reference Martianto, Sumedi and Soekatri 13 ).
Evaluation design
A pre–post comparison was used to assess utilization, coverage and impact of fortified oil. The market-based distribution did not allow for a control group.
For lactating mothers with infants aged 6–11 months and for children aged 12–59 months, baseline and endline surveys were conducted and analysed as independent cross-sectional samples (Table 1). Children aged 5–9 years and women aged 15–29 years were sampled and analysed as cohorts. From cohort households, oil samples were collected two-weekly during the year between surveys.
Table 1 Targeted and realized numbers of respondents in the evaluation of a pilot fortification of unbranded palm oil with vitamin A in West Java, Indonesia
Targeted sample sizes based on α=0·05 (95 % CI), statistical power β=0·80, expected improvement in serum retinol of 0·10–0·20µg/dl( Reference Martianto, Riyadi and Marliyati 11 ), a design effect of 2( 15 ) and 10 % drop-out( Reference Martianto, Riyadi and Marliyati 11 ). Baseline mean serum retinol, as additional last parameter to calculate sample sizes, was estimated at 20 (sd 0·2) µg/dl for infants aged 6–11 months( Reference Dijkhuizen, Wieringa and West 47 ), 27 (sd 0·25) µg/dl for children aged 12–59 months, 30 (sd 0·25) µg/dl for children aged 5–9 years( Reference Nga, Winichagoon and Dijkhuizen 48 ), 26 (sd 0·6) µg/dl for lactating mothers and 29 (sd 0·3) µg/dl for non-lactating women aged 15–29 years. Since lactating mothers and infants aged 6–11 months were selected as mother–child pairs, the adjusted sample size for infants was taken to be that for lactating women, which had the larger crude sample size.
* Numbers in parentheses are records with blood and interview that were matched between baseline and endline, and analysed as a cohort.
Village and subject sampling
Districts Tasikmalaya and Ciamis were selected based on a >50 % market share of PT-SAP’s unbranded oil. Four sub-districts per district, two or three peri-urban villages per sub-district and the largest town of each district were selected, for a total of twenty-four villages.
The sampling frame targeted the poor population suspected to be at highest risk of low serum retinol by randomly sampling only those households in the twenty-four villages that possessed a government-issued ‘poor family’ card.
Sample sizes provided power to detect a ≥10 % increase in mean retinol concentration in serum or breast milk( Reference Martianto, Riyadi and Marliyati 11 ), with a type I error (α) of 0·05 and a statistical power (β) of 0·80, for children aged 6–59 months, 5–9 years and women aged 15–29 years. For lactating mothers and their infants aged 6–11 months (sampled in pairs), samples were set to detect a serum retinol increase of 20 % in the mothers( Reference de Pee, Yuniar and West 14 ). Sample calculations assumed a cluster-design effect of 2( 15 ). To account for drop-outs, samples were further inflated by 10 %( Reference Martianto, Riyadi and Marliyati 11 ).
Eligibility criteria included, for all groups: no counter-indications for blood sampling, such as haemophilia or known severe (chronic or acute) disease; and no severe anaemia (Hb < 7 g/dl). In addition, women aged 15–29 years were not currently lactating; lactating and non-lactating women were not pregnant; children aged 6–59 months were not severely underweight (weight-for-height Z-score <−3·0); and children aged 12 months–9 years were not severely overweight (weight-for-height Z-score >3·0).
Ethical authorization
The study was conducted according to guidelines laid down in the Declaration of Helsinki; all procedures involving human subjects were approved by the Ethical Review Committee of the Ministry of Health, National Institute of Health Research and Development. Written informed consent was obtained from all participants, or their parents for children.
Data collection
Enumerators were twenty-four local nutritionists from District Health Offices working at local puskesmas (Community Health Centres), with two replacements in each district at endline. At both baseline and endline, a structured questionnaire was used to collect data on socio-economic status, household composition and history of disease.
Blood and breast milk samples
Hb was measured on-site using a HemocueTM device (Hemocue, Ängelholm, Sweden). Venous blood (5 ml) was sampled at health facilities, from the arm of participants >12 months old. From infants <12 months old, blood was taken from the heel. If the phlebotomist failed to obtain the sample on first attempt, with permission he/she tried a second time; when both attempts were unsuccessful, the respondent was excluded. Blood samples were stored in plain glass evacuated tubes covered with foil until transport to the district health office, for sample fractioning, the same day.
Serum was separated from the remaining blood by centrifugation at room temperature for 8 min at 3000 g , divided into (four or, when possible, five) aliquots of 500 µl each and stored in Eppendorf tubes at −20°C. Retinol concentration was measured in 500 µl serum using HPLC (Immundiagnostik kit, supplied by Prodia Laboratory, Jakarta, Indonesia). The CV was 4·1 %. C-reactive protein (CRP) and α-glycoprotein (AGP) were measured by an in-house ELISA at VitMin Lab, Willstaett, Germany( Reference Erhardt, Estes and Pfeiffer 16 ). Serum retinol levels were adjusted for subclinical inflammation (serum CRP >5 mg/l and/or AGP >1 g/l), using standard correction factors( Reference Thurnham, Mburu and Mwaniki 17 – Reference Wieringa, Dijkhuizen and West 19 ). Baseline and endline samples were analysed simultaneously, to reduce risk of biases associated with developments at laboratories.
Lactating mothers were visited by midwives. At both baseline and endline, all milk from one breast that had not been used for ≥30 min was collected during a mid-morning feeding with a hand-pump. Of this sample, 25 ml was aliquoted, transported in a bottle covered with aluminium foil, stored at −18°C and analysed for retinol using HPLC (AOAC Official Method 2001·13( 20 , Reference DeVries and Silvera 21 )) at the Center for Agro-Industry (BBIA), Bogor, Indonesia.
Dietary assessment and vitamin A intake
A single 24 h dietary recall from each respondent, at baseline and at endline, recorded types and quantities of foods (including snacks and street foods) consumed. Data were analysed in Nutrisoft software( 22 ), using Indonesia’s food composition table( Reference Krisdinamurtirin and Tarwotjo 23 ) to estimate nutrient intakes. Oil consumption was estimated from dietary intake using Indonesia’s official conversion table, which assumes a fixed average amount of cooking oil in each dish( 24 ).
Vitamin A intake from fortified oil was estimated based on individual oil intake (at endline) multiplied by the average vitamin A concentration in household and small-stall oil samples taken during the year. Oil sample measurements from cohort households were used to estimate average vitamin A levels in oil consumed. For non-cohort households and cohort households without any sample taken, vitamin levels in oil were interpolated as the average level across household samples from the same village.
Because Nutrisoft does not correct for poor bioavailability of (pro-)vitamin A/carotenoid in foods, it likely overestimates vitamin A intake from plant-source foods, which the evaluated population consumed in large amounts. Therefore, our analyses considered vitamin A intake only from animal-source foods and oil-containing foods.
Vitamin A intakes from oil and animal foods were converted into proportional contributions to the daily, age-specific RNI, using internationally accepted reference RNI values( 25 ).
Household socio-economic variables
Purchasing power was expressed in existing national household expenditure quintiles from ‘Survei Sosio-ekonomi Nasional’ (SUSENAS), a national survey conducted in 2010( 26 ). As another socio-economic indicator, we calculated the proportion of household expenditures on food. Possession of assets (car, motorcycle, refrigerator, computer, hand phone, television, DVD player, radio, etc.) was aggregated in a household asset score, weighting each asset by average price. A housing sanitation score was calculated from sub-scores for cleanliness, windows, ventilation and lighting in living room and bedroom. Finally, a housing condition score aggregated sub-scores for type of house, roof, ceiling, walls and floors, and number and separation of bedrooms. Multivariate regressions considered these scores in quintiles.
Vitamin A in cooking oil
Oil fortification levels were assessed at the factory, distributors, food shops/stalls and from household samples, using the rapid device iCheck™ (BioAnalyt GmbH, Teltow, Germany)( Reference Rohner, Frey and Mothes 27 ). For factories, the iCheck-based vitamin A levels were those reported by the producer from internal quality assurance/quality control.
Over 4800 samples, each comprising 25 ml of unused oil, were collected from small stalls and households, and kept in plastic bottles, which were completely filled, covered with aluminium foil and stored in the dark at district base camps. Random subsets of fifty-four and seventy-five of these samples, respectively, were analysed immediately in the field and used to calculate vitamin A intake from oil. Samples with vitamin A content below the iCheck assay’s lower detection limit of 3 mg retinol equivalents/kg (i.e. 10 IU/g) were included with value of 1 mg/kg (3·3 IU/g) in analyses.
Data cleaning and analysis
Data were double-entered (biomarkers and key respondent identifiers) or single-entered (other questionnaire variables) into a database; internal consistency and validity were checked by an external team from the School of Public Health, University of Indonesia, Depok, with some questionnaires revisited and data re-entered to correct errors.
Analyses were limited to participants with both interview and blood data available (Table 1). For cohort members, analyses selected individuals who participated in both baseline and endline. Drop-out from cohorts was considerable (Table 1), mainly due to refusals to blood drawing (at endline), emigration and absence from home during survey days. No records were kept on numbers and reasons for refusal and drop-out.
Cleaned data were analysed using the statistical software package IBM SPSS Statistics version 19·0 for Windows (2011). Student t tests tested differences between baseline and endline, averaged within age groups (paired t test for continuous variables in cohorts; unpaired/independent-samples t test for binary/proportional variables in cohorts; and unpaired/independent t test for all outcomes in cross-sectional groups).
Retinol concentrations were analysed in μg/dl. Vitamin A deficiency was defined as serum retinol below 20 μg/dl (0·7 µmol/l)( 28 ).
Multivariate regression
Determinants of vitamin A status were assessed in multivariate linear regression. The key outcome measure was the shift in serum (AGP/CRP-adjusted) retinol concentration. Covariates (selected based on perceived relevance and data quality) were taken from the endline survey, except for serum retinol concentration at baseline and household expenditure on food; the latter was calculated as endline-minus-baseline shift to capture changes between surveys in socio-economic conditions.
Regressions were run at the level of village-average outcomes. For cohorts, in addition individual-level regressions were performed.
Results
Respondent characteristics at baseline and endline
Populations surveyed were comparable between baseline and endline in age and sex distribution; and for children, in breast-feeding and vitamin A supplementation coverage (Table 2). As exceptions, infants aged 6–11 months were slightly older at endline than at baseline (P=0·01) and their proportion ever breast-fed was slightly higher at endline (P=0·002).
Table 2 Characteristics of respondents at baseline and endline in a pilot fortification of unbranded palm oil with vitamin A in West Java, Indonesia
Unless indicated otherwise, values shown are means and standard deviations.
* For these cohort groups, P value of the difference between baseline and endline was based on paired t tests; for the other cross-sectional groups, P values were based on unpaired/independent-samples t tests.
† In the study area, only children aged 6–59 months received vitamin A supplementation (through routine services independent of the study); there was no vitamin A supplementation for lactating (or other) women.
‡ The higher the score, the better the house or household’s condition.
Socio-economic indicators generally were better at endline than baseline. Nevertheless, at both surveys high proportions of households were in the poorest national expenditure quintile (37–53 % at baseline; 26–44 % at endline)( 26 ); that is, within the targeted poor population.
Vitamin A content of cooking oil
Cooking oil leaving the factory had an average retinyl-palmitate level of 43·6 (sd 2·5) IU/g. Corresponding levels were 28·3 (sd 7·7) IU/g at distributors, 25·7 (sd 10·5) IU/g at small stalls and 28·5 (sd 12·0) IU/g in households (Fig. 1(a)). Among household samples, vitamin A levels varied considerably over the months and between the two districts (Fig. 1(b)).

Fig. 1 Vitamin A content of cooking oil through the oil distribution chain in a pilot fortification of unbranded palm oil with vitamin A in West Java, Indonesia: (a) mean vitamin A content of oil samples, analysed immediately after collection, from one factory, two district-level distributors, twenty-four small stalls and sixty-four households*; (b) mean vitamin A content of samples from households in Ciamis (![]() ) and Tasikmalaya (
) and Tasikmalaya (![]() ) by month and year of collection and analysis†. *Numbers in parentheses denote number of oil samples collected and immediately analysed. Samples with vitamin A content below the iCheck assay’s lower detection limit of 3 mg retinol equivalents/kg (i.e. 10 IU/g) were included with value of 1 mg/kg (3·3 IU/g) in data analyses. A retinyl-palmitate level below the detection limit was not found in any of the factory or distributor samples, but it was found in three of the seventy-five household samples and in one of the fifty-four small-stall samples analysed immediately. †Over November 2011 to May 2012, the number of samples analysed per district per month ranged from 5 to 6 in Tasikmalaya and from 5 to 8 in Ciamis (mode 5), for a total of n 75. Over July–October 2011, a period for which the original data were lost and only aggregate results retained, similar numbers of samples were analysed immediately every month
) by month and year of collection and analysis†. *Numbers in parentheses denote number of oil samples collected and immediately analysed. Samples with vitamin A content below the iCheck assay’s lower detection limit of 3 mg retinol equivalents/kg (i.e. 10 IU/g) were included with value of 1 mg/kg (3·3 IU/g) in data analyses. A retinyl-palmitate level below the detection limit was not found in any of the factory or distributor samples, but it was found in three of the seventy-five household samples and in one of the fifty-four small-stall samples analysed immediately. †Over November 2011 to May 2012, the number of samples analysed per district per month ranged from 5 to 6 in Tasikmalaya and from 5 to 8 in Ciamis (mode 5), for a total of n 75. Over July–October 2011, a period for which the original data were lost and only aggregate results retained, similar numbers of samples were analysed immediately every month
Consumption of oil and foods containing vitamin A, and their contributions to Recommended Nutrient Intakes
Mean oil consumption at baseline ranged from 2·4 ml/capita per d for infants aged 6–11 months to 31·5 ml/capita per d for lactating mothers (Table 3). Oil consumption did not change from baseline to endline in any group. Households reported consuming the oil purchased within a median of 3 d (interquartile range 2–7 d).
Table 3 Oil consumption and mean vitamin A intake as a percentage of the age-adjusted RNI, by age group, in a pilot fortification of unbranded palm oil with vitamin A in West Java, Indonesia

RNI, Recommended Nutrient Intake (source: reference 25).
* Based on a single 24 h full dietary recall for each respondent.
† Animal foods intake does not include intake from breast milk, for which volumes have not been quantified.
Contributions to the daily vitamin A RNI from fortified oil were from 26 % in children aged 12–23 months to 35–40 % in older children and non-lactating women (Table 3). The RNI contribution from oil was only 4 % in breast-feeding infants. For animal foods, mean contributions to the vitamin A RNI were below 50 % in all groups and only 19 % for lactating women. Consumption of fortified cooking oil therefore improved vitamin A intakes considerably, except among infants aged 6–11 months (in whom intake via breast milk was not quantified).
Risk of excessive vitamin A intake
Based on reported consumption at endline, no individual in any group consumed enough oil to exceed the guidance level for long-term intake of 1500 μg retinol equivalents/d, equal to half the upper limit for adults( 29 , Reference Kraemer, Waelti and de Pee 30 ).
Serum retinol concentrations
Mean (CRP/AGP-adjusted) serum retinol concentrations at baseline ranged from 30·7 μg/dl among children aged 6–11 months and lactating mothers, to 42·7 μg/dl among non-lactating women (Table 4). At endline, mean retinol was higher among all groups, with P<0·001 among all groups except children aged 12–23 months (P=0·529) and 24–59 months (P=0·057). The mean increase ranged from 0·7 μg/dl (2·2 %) among 12–23-month-olds, to 8·1 μg/dl (19·0 %) among non-lactating women. In population frequency distributions, these differences were apparent as marked shifts to the right (Fig. 2).
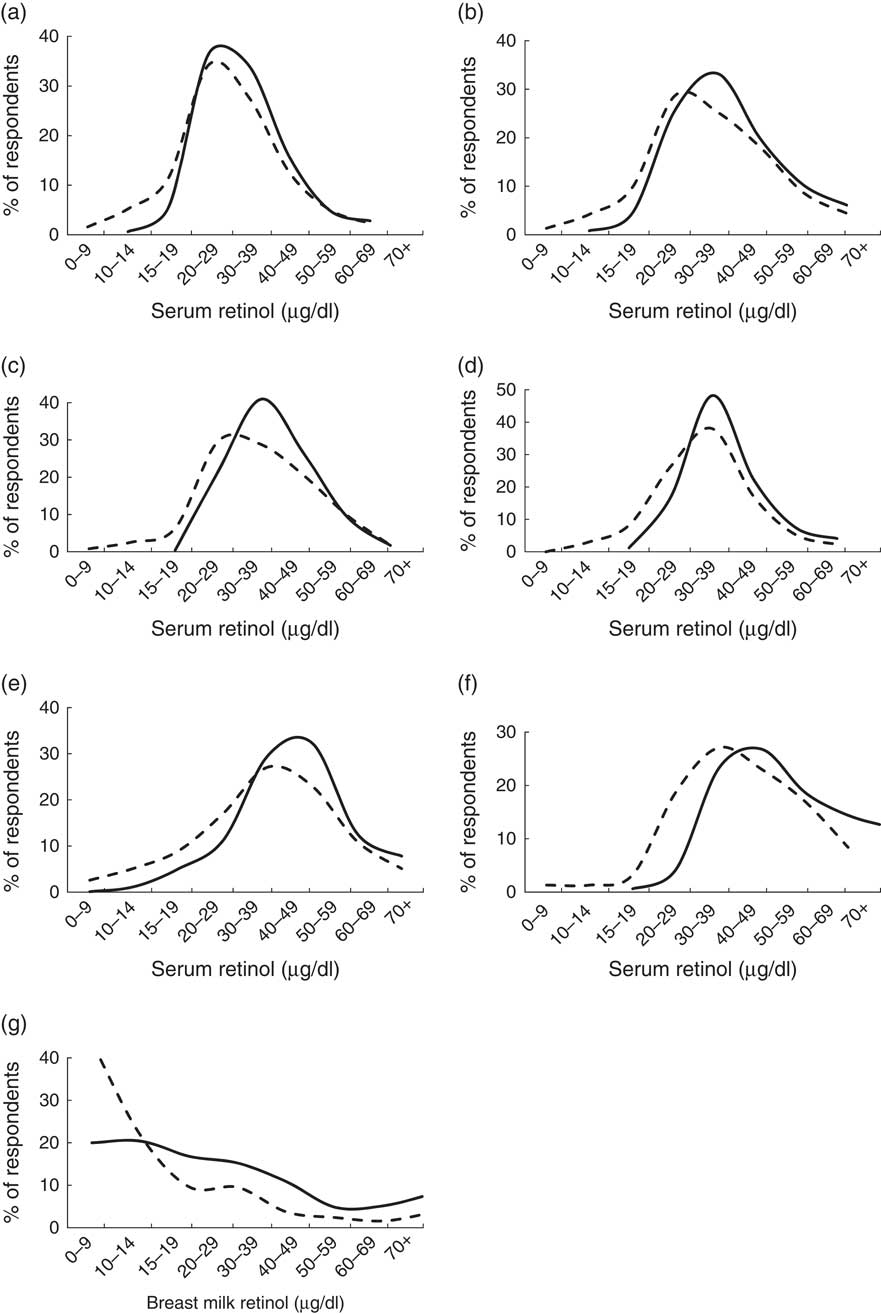
Fig. 2 Serum (CRP/AGP-adjusted) retinol concentration and breast milk retinol concentrations at baseline (– – – –) and endline (——) in a pilot fortification of unbranded palm oil with vitamin A in West Java, Indonesia: (a) infants aged 6–11 months; (b) children aged 12–23 months; (c) children aged 24–59 months; (d) children aged 5–9 years; (e) lactating mothers; (f) non-lactating women aged 15–29 years; and (g) breast milk. CRP, C-reactive protein; AGP, α-glycoprotein
Table 4 Mean serum retinol concentrations (µg/dl) among participants at baseline and endline, adjusted for CRP and AGP, in a pilot fortification of unbranded palm oil with vitamin A in West Java, Indonesia
CRP, C-reactive protein; AGP, α-glycoprotein.
Serum retinol levels were adjusted for subclinical inflammation, based on threshold values of serum CRP concentration >5 mg/l and/or AGP concentration >1 g/l, which was found in about 25 % of participants at both baseline and endline. To this end, participants were grouped into four categories: (i) both CRP and AGP normal; (ii) incubation (CRP high and AGP normal); (iii) acute convalescence (both CRP and AGP high); (iv) late convalescence (CRP normal and AGP high). For groups (ii), (iii) and (iv), observed serum retinol concentration was then adjusted using standard correction factors from meta-analyses( Reference Thurnham, Mburu and Mwaniki 17 – Reference Wieringa, Dijkhuizen and West 19 ).
At baseline, vitamin A deficiency was most prevalent among children aged 6–11 months (18·2 %) and children aged 2–9 years (10–11 %; Fig. 3). Twice as many lactating mothers were deficient than non-lactating women (10·0 % v. 5·3 %). Deficiency prevalence was significantly lower at endline for all groups. The largest proportional difference was among children aged 24–59 months (9·9 % at baseline, 0·4 % at endline; P<0·001).

Fig. 3 Prevalence of vitamin A deficiency at baseline (![]() ) and endline (
) and endline (![]() ) of a pilot fortification of unbranded palm oil with vitamin A in West Java, Indonesia. Vitamin A deficiency, defined as serum retinol <20 μg/dl after adjustment for subclinical inflammation based on serum CRP (>5 mg/l) and AGP (>1 g/l), decreased significantly in all groups at endline (P<0·001 for all except non-lactating women aged 15–29 years, for whom P=0·011). CRP, C-reactive protein; AGP, α-glycoprotein
) of a pilot fortification of unbranded palm oil with vitamin A in West Java, Indonesia. Vitamin A deficiency, defined as serum retinol <20 μg/dl after adjustment for subclinical inflammation based on serum CRP (>5 mg/l) and AGP (>1 g/l), decreased significantly in all groups at endline (P<0·001 for all except non-lactating women aged 15–29 years, for whom P=0·011). CRP, C-reactive protein; AGP, α-glycoprotein
Among children aged 5–9 years, baseline mean (CRP/AGP-adjusted) serum retinol concentration was not significantly different (P=0·11) between children retained at endline and included in cohort analyses (Figs 2 and 3) and children lost-to-follow-up. Among women aged 15–29 years, those re-surveyed at endline had 13 % lower initial mean serum retinol than those lost after baseline (P=0·026). Analysing these groups as cross-sectional samples (including participants lost after baseline), mean serum retinol was 5·4 μg/dl (16 %) higher at endline than at baseline in children aged 5–9 years (P<0·001) and 6·1 μg/dl (14 %) higher at endline than baseline in women aged 15–29 years (P=0·007) – effect sizes similar to the cohort results.
Breast milk retinol concentrations
Among 233 and 253 breast milk samples collected at baseline and endline, vitamin A concentrations averaged 20·5 (sd 30·9) μg/dl and 32·5 (sd 27·6) μg/dl, respectively (P<0·01), with a marked right shift in the overall distribution (Fig. 2).
Multivariate regressions
Higher (village-average) vitamin A RNI contribution from cooking oil predicted higher (village-average) improvement in serum retinol concentration from baseline to endline (Table 5, model 1) in children aged 6–59 months (P=0·003) and 5–9 years (P=0·03). For children aged 6–59 months, vitamin A supplementation coverage independently predicted greater serum retinol improvement (P=0·032). We found no significant effects of socio-economic covariates in any model.
Table 5 Multivariate regression analysis of determinants of improvement in serum retinol concentration from baseline to endline in a pilot fortification of unbranded palm oil with vitamin A in West Java, Indonesia

CRP, C-reactive protein; AGP, α-glycoprotein.
β represents the standardized coefficient for the covariate. Adjusted R 2 indicates the proportion of each group’s variation in retinol improvements that is explained by the model. Serum retinol improvements analysed on CRP/AGP-adjusted values.
* Indicates statistically significant (P<0·05) predictors, all analysed at village average level across twenty-four villages.
In children aged 5–9 years and women aged 15–29 years, regressions with the same variables but run at individual (instead of village) level did not obtain good fit; that is, these models did not identify any significant predictors of individual-level serum retinol improvements (data not shown).
When adding baseline serum retinol concentration as covariate, that variable was the dominant predictor of retinol status improvements: the lower baseline retinol, the larger the upward shift, and vice versa. This effect was strong and significant in all groups (Table 5, model 2). Adding baseline serum retinol markedly improved model fit for all groups. However, in these expanded models the RNI contribution from oil was no longer independently significant.
Discussion
The ability to evaluate the impact of fortification programmes using plausibility methods is constrained by the nature of these programmes. Although this pre–post evaluation without a control group could not prove causality, retinyl contents measured in oil, RNI contributions from fortified oil consumption, and dose–response relationships between vitamin A intake and serum retinol improvements across age groups (after adjustment for likely confounders) provide strong plausibility of an impact of oil fortification on vitamin A status in Indonesian women and children.
Vitamin A levels in fortified oil reaching small stalls and households were on average 35 % below Indonesia’s SNI, in line with expectations based on studies of retinyl-palmitate stability and programme feasibility that had informed this standard( Reference Martianto and Komari 10 , Reference Martianto, Riyadi and Marliyati 11 , Reference Martianto, Sumedi and Soekatri 13 ). Ranges of vitamin A intakes from oil among study participants support the SNI’s appropriateness, but intake ranges relative to safety margins will need continued monitoring, including in adult men who were not evaluated here.
Monthly fluctuations in retinyl levels during the pilot likely reflect occasional dilution of fortified oil with non-fortified oil by distributors. In addition, in Tasikmalaya the flow of fortified oil was intermittent between December 2011 and February 2012, with oil occasionally completely unfortified following problems with customs clearance of vitamin premix. This issue should be resolved once vitamin A fortification of palm cooking oil becomes mandatory and (from March 2015) enforced. The new law’s additional requirement for all cooking oil to be packaged should further help reduce degradation of retinyl palmitate during storage. Another determinant of vitamin A stability during oil storage − to monitor in fortification programmes − is peroxide level( Reference Laillou, Hafez and Mahmoud 31 ). Peroxide in 2011 averaged 2·55–2·9 meq/kg across oil producers and distributors in Java and Sumatera, well below Indonesia’s standard of 10 meq/kg but as high as to allow considerable vitamin degradation( Reference Andarwulan and Martianto 32 ).
In multivariate regressions, baseline-to-endline shifts in serum retinol were larger in villages with lowest baseline retinol levels. This effect has two explanations. First, there is ‘regression to the mean’ due to within-person physiological variations as well as measurement error( Reference Zeba, Martin Prevel and Some 33 ). Second, fortification impact was likely strongest in those people with poorest baseline serum retinol, as also noted in an effectiveness study of vitamin A-fortified wheat-flour buns in Philippine children( Reference Solon, Klemm and Sanchez 34 ).
In this pilot programme, serum retinol improvements were larger than in an earlier effectiveness study in Makassar where, among schoolchildren, fortified oil increased vitamin A intake from <50 % to 80–90 % of the RNI, increased mean serum retinol from 23·3 to 26·6 μg/dl and reduced deficiency prevalence from 27 % to 18 %( Reference Martianto, Riyadi and Marliyati 11 ). In the Philippines, against a similar background of twice-yearly vitamin A supplementation, vitamin A-fortified cooking oil reduced vitamin A deficiency in children aged 1–5 years from ∼30 % to below 10 %( Reference Mason, Ramirez and Fernandez 35 ).
Besides fortified oil, improvements in socio-economic status during the year probably contributed to improving vitamin A status in this evaluation. Wealth improved in both cohorts and cross-sectional groups, probably reflecting a secular trend, rather than sampling bias. Socio-economic, health and nutrition improvements are apparent throughout Indonesia( 26 , 36 – 38 ). Moreover, the evaluation concurred with special presidential efforts to stimulate economic growth, attract industry and mitigate poverty in the pilot districts, in particular Tasikmalaya, the district with worst health status in West Java. Nevertheless, in multivariate regressions, the effect of oil consumption improving vitamin A status in children persisted after adjustment for socio-economic characteristics.
The large increase in retinol concentration in breast milk, and in the serum of young (lactating and non-lactating) women, supports the interpretation that infants aged 6–11 months benefited through increased maternal vitamin A intake during pregnancy and/or breast-feeding. We found 58 % higher vitamin A levels in breast milk after fortification, from baseline levels similar to those in Indonesian villages in 1985–86( Reference Muhilal, Murdiana and Azis 39 ) and rural Bangladesh over 1995–1997( Reference Alam, van Raaij and Hautvast 40 ). Since the evaluation did not measure milk volumes consumed by infants, we refrained from quantifying infants’ vitamin A intakes through breast milk. At an assumed 500 ml/d (as conservative minimum( Reference Kumwenda, Dewey and Hemsworth 41 )), breast milk from mothers consuming fortified oil might contribute well over 100 % of the RNI for infants aged 6–11 months.
Of note, most children aged 6–59 months were covered with twice-yearly high-dose vitamin A supplementation. In multivariate regressions, vitamin A intake from fortified oil consumption (daily, at low dose) and periodic high-dose supplementation both independently improved serum vitamin A in children aged 6–59 months. Unlike in the Philippines and India( Reference Mason, Ramirez and Fernandez 35 , Reference Gorstein, Bhaskaram and Khanum 42 ), in this pilot the effect of supplementation was apparently not lost within the February-to-July interval – unless the supplementation effect found in regressions reflected residual confounding due to children missing supplementation typically having the worse nutritional status and morbidity up front( Reference Berger, de Pee and Bloem 43 ).
Strengths and limitations
The evaluation was limited in the quality of oil and food consumption data. Dietary recalls used a suboptimal questionnaire administered by enumerators whose training was inadequate to develop the specific skills required for high-quality dietary recall and without aid of pictures of portion sizes. Dietary data were analysed against an outdated national food composition table and food consumption outside homes may not have been fully recorded. In the resulting data, animal-source food intake (as well as overall protein and energy intakes) fell by 15–20 % from baseline to endline in lactating mothers, and by 30–40 % in infants (data not shown). For lactating mothers, daily energy intake according to dietary recall was implausibly low at ∼5000 and 4600 kJ (∼1300 and ∼1100 kcal) at baseline and endline, suggesting that vitamin A intake from both animal foods and oil may have been underestimated. Conversely, animal food intake by 12–59-month-old children may have been over-reported by mothers, reflecting a social desirability bias.
Compounding these uncertainties is the extrapolation of vitamin A content in oil from a sub-sample of households and small stalls, as village averages, to other households. Potential measurement errors in iCheck measurements may furthermore have diluted associations between vitamin A intake from oil and vitamin A status improvements.
While data limitations did not produce systematic bias in either baseline or endline results or their difference, they likely caused non-differential misclassification in both exposure/predictor and outcome measures. Therefore, effects of fortified oil consumption on vitamin A status may in reality have been greater than shown.
Finally, based on sampling design the population evaluated was poorer than Indonesia nationwide, but similar in terms of oil consumption behaviours, as well as overall diet( Reference Martianto and Komari 10 , Reference Martianto, Riyadi and Marliyati 11 , Reference Martianto, Sumedi and Soekatri 13 , 26 , Reference Andarwulan and Martianto 32 ). Recently other surveys found either higher vitamin A deficiency prevalence (pre-school children on Central Java( Reference Pangaribuan, Erhardt and Scherbaum 44 ); schoolchildren in Makassar, 2008( Reference Martianto, Riyadi and Marliyati 11 )) or lower prevalence (pre-school children in Semarang( Reference Kartasurya, Ahmed and Subagio 45 ); pre-school and schoolchildren nationwide, 2011( Reference Sandjaja, Budiman and Harahap 2 )). Future evaluations following mandatory oil fortification should assess if the large vitamin A status improvements found here can be replicated at national scale.
Conclusion
The current pilot programme evaluation confirms the potential of large-scale oil fortification to ensure consistent vitamin A intakes and improve the vitamin A status of women and children living in poverty. Expected impact notably includes infants aged 6–11 months, who appear to benefit via maternal intake during pregnancy and/or breast-feeding.
Once Indonesia will enforce mandatory fortification of cooking oil from 2015, over 4 million tonnes of cooking oil sold domestically should be fortified with vitamin A, reaching over 200 million Indonesians. As in the pilot, poor people with worst nutritional status will consume and benefit at least as much as richer people who access more alternative vitamin A sources. Moreover, Indonesia is a leading supplier of cooking oil for neighbouring countries with a similarly high vitamin A deficiency burden and universal consumption of palm oil( Reference Laillou, Panagides and Garrett 46 ). The programme thus lays the foundation for other countries to consider mandatory fortification of imported cooking oil, as a cost-effective way to reduce vitamin A deficiency and its associated health burden.
Acknowledgements
Acknowledgements: The authors thank the women and children who participated in the surveys, and the project and government health staff who implemented and facilitated the evaluation. In addition to the institutions listed, partners included the District Health Offices of Tasikmalaya and Ciamis. The authors thank Dr Fabian Rohner and Dr Frank Wieringa who served as external advisors during the design and implementation stage; Mr Ravi Menon, Dr Lynnette Neufeld and Ms Rebecca Spohrer (GAIN) for support with drafting of the paper; and two anonymous peer reviewers for comments to improve the final paper. Financial support: The baseline survey was funded by the Indonesian Ministry of Health, National Institute of Health Research and Development; the endline survey, data analysis and reporting were funded by GAIN; the evaluation design, technical assistance and part of the vitamin A analyses of oil were funded by the GIZ Strategic Alliance for the Fortification of Oil and Other Staple Foods (GIZ-SAFO). The funders had no role in the design, analysis or writing of this article. Conflict of interest: None. Authorship: Sandjaja, Soekirman, A.B.J., R.T., B.U. and R.M.-P. designed the evaluation; Sandjaja, I.J., A.B.J. and R.T. implemented data collection; I.J., A.B.J., Ifrad, M.K.H., R.T. and E.L.K. analysed data; E.L.K., M.K.H., D.S., R.T. and R.M.-P. wrote the paper. All authors read and approved the final manuscript. Ethics of human subject participation: The study was approved by the Ethical Review Committee of the Ministry of Health, National Institute of Health Research and Development.


