


1 Introduction
A public pension system is one of the most basic components of a social safety net for the elderly. Following the success of pension systems in developed countries, more developing countries, including South Korea in 1999, have adopted public pension programs in recent decades (Yang, Reference Yang2001).Footnote 1 The significance of government guaranteed pensions has become increasingly important with unprecedented global aging driven largely by demographic changes in less developed regions of the world (United Nations, 2001). South Korea has undergone rapid economic development and as a consequence the experiences of South Korea's public pension expansion can shed light on some of the likely outcomes for other developing countries implementing or expanding their own pension programs.
As in many other countries, poverty among the elderly accompanied by a rapidly aging population presents a serious problem in South Korea. Old-age support in South Korea traditionally had been the responsibility of adult children, most notably, the eldest son. However, increasing urbanization, industrialization, and wealth in South Korea significantly contributed to a shift from individuals living in traditional, extended families to nuclear, and single-person families. This shift weakened the tradition of old-age support by adult children. Thus, the public pension expansion in South Korea provides a good opportunity to examine the impact of receiving a public pension on the well-being of the elderly as reflected by their expenditures. It also provides an opportunity to determine the extent to which the public pension expansion has replaced the financial support from adult children and other family members.
In 1999, South Korea's compulsory public pension program was expanded to individuals who were self-employed, unemployed, and out of the labor force. In this massive expansion, we find that adults aged 19–59 were required to enroll, while those ages 60–65 were allowed, but not required, to enroll in the public pension system. Assuming that being a few years younger or older than 60 is virtually random, a dummy for whether an individual is 58–59 years or 60–61 years old provides a plausible instrumental variable (IV) for whether he or she enrolls and receives a public pension. We provide a range of evidence that 58–59 and 60–61-year-old individuals in 1999 are similar in observed characteristics except for their proclivity to enroll in the expanded public pension program.
We find that receipt of a public pension did not allow the elderly to increase total expenditures or food expenditures since receiving public pensions largely crowded out financial transfers from adult children and/or own siblings. However, as financial contributions (financial transfers) from adult children and/or own siblings declined with increased pension participation, non-financial help (any informational help or emotional support through communications or visitations) from adult children and/or own siblings actually increased, suggesting a swapping by family members of non-financial for financial help. Our subsample analyses suggest that the crowding-out effects are stronger for elderly individuals with more education (high school or more). Crowding-out was also more pronounced for the elderly living alone or with a spouse and not in an extended living arrangement.
In the next section, we review theories and previous studies of public pensions and family transfers. Section 3 provides an overview of the South Korean public pension system and the 1999 public pension expansion. Section 4 describes our data and provides descriptive statistics of the analysis sample. In Section 5, we explain how we use the 1999 public pension expansion in South Korea to consistently estimate the impact of public pension receipt on the total per capita expenditures and food expenditures of the elderly as well as financial and non-financial transfers from adult children and/or own siblings. Section 6 provides results and interpretation. Section 7 discusses possible bias and provides sensitivity analyses of subsamples. Section 8 concludes by discussing our findings and their broader implications.
2 Theory and previous studies
In developing countries where private transfers fill a gap in an imperfect capital market, private transfers between parents and children are a critical element to understanding how public pensions affect the expenditures of elderly. Such private transfers can be explained by competing economic models. The first two models, altruism and exchange, are well elaborated in Cox et al. (Reference Cox, Eser and Jimenez1998). According to the altruism model dated back to Becker (Reference Becker1974), the family transfers from adult children to their parents are based on altruistic behavior. Because adult children care about their parents’ well-being, they transfer income to their parents when their parents’ expenditures are low. Thus, this model predicts that pensions will crowd out transfers from adult children to their parents.
The exchange model is more complicated than the altruism model because the exchange model assumes an implicit contract of borrowing and lending between children and their parents over their lifetimes. The exchange model explains negotiations between parents and children regarding borrowing and lending in the early stages (when parents work and their children are young) and later stages of life (when parents retire and their children work). According to this model, pensions for the elderly decrease the probability of receiving private transfers while the public pension may increase or decrease the amount of transfers conditional on receiving private transfers.Footnote 2 For example, if parents expect higher income when they retire due to the public pension, they may lend more money to their children because they are able to lend more under better terms with children. As a result, parents with higher income may receive higher private transfers from their adult children.
Public pensions may crowd out private transfers from adult children to their parents for other reasons as well. Since adult children need to pay their payroll taxes into the pension system, their disposable income will be smaller which in turn could reduce income transfers to their parents. This is the income effect of an expansion in public pension programs on private transfers.
The public pension expansion in 1999 in South Korea was an exogenous policy decision right after the Asian financial crisis in 1998 and the new president's effort to reinforce the social safety net for the elderly. By 1999, the recipients in our study were too old (ages 58–61) to make significant changes to their implicit borrowing/lending contracts with their family members based on an unexpected, exogenous policy change. Thus, the altruism and income effect models are likely to reflect the circumstances of the South Korean pension expansion of 1999. Both of these models would predict that the expanded public pension would crowd out the probability and amount of private transfers. Because we only know whether or not the elderly receive private transfers in our data, we focus on the effect of public pension receipt on the probability of receiving private transfers.
Prior literature has examined the extent to which the receipt of a public pension actually improves the expenditures of the elderly while other studies investigated the crowding-out effect. In general, public subsidy or pension programs for the elderly seem to reduce the reliance of the elderly on private transfer income from adult children, other family members, or friends (Cox and Jimenez, Reference Cox and Jimenez1992, Reference Cox, Jimenez, van de Wall and Nead1995; Cox and Jakubson, Reference Cox and Jakubson1995; Cox et al., Reference Cox, Eser and Jimenez1998, Reference Cox, Galasso and Jimenez2006; Biddlecom et al., Reference Biddlecom, Hermalin, Ofstedal, Chang and Chuang2001; Jensen, Reference Jensen2003; Fan, Reference Fan2010). As a result, Cox and Jimenez (Reference Cox, Jimenez, van de Wall and Nead1995) conclude that public programs to alleviate elderly poverty would not have their full impact because those programs partially crowd out private transfers. On the other hand, Fan (Reference Fan2010) provides evidence indicating that increases in pensions improve the expenditures of pensioners as well as their children. Studying whether pension income is used differently compared to other income, Case and Deaton (Reference Case and Deaton1998) suggest that pension and other income contribute equally to food expenditures by the elderly although they acknowledge some weaknesses in their model's identification strategy.
Except for Fan (Reference Fan2010) who studies the farmers’ pension program in Taiwan, there are few studies that investigate both the impacts of pensions on expenditures as well as transfers from family members. Despite its global saliency, the relatively small literature in this area of inquiry results from the difficulty encountered in consistently estimating the impacts of public pensions. That is, individuals self-select into (or opt out of) public pension programs for many reasons, observed and unobserved. Thus, simply comparing individuals who do and do not receive a public pension using observational data does not generally yield consistent estimates. Also, few data include total expenditures, food expenditures, and private transfers to the elderly in one survey. The limited number of comprehensive studies and challenges of empirical identification leave lingering questions as to the effect of public pensions on expenditures and private transfers. Using the 1999 pension expansion in South Korea, this study contributes to the literature by examining not only whether the public pension for the elderly crowds out the private transfers, but also whether it improves the total expenditures and food expenditures of the elderly.
3 The public pension expansion in South Korea
South Korea has a dual structure for public pension plans: the Occupational Pension Service (OPS) for government employees, military personnel, and private school teachers; and the National Pension Service (NPS) for general residents. This study focuses on the NPS and its expansion. The National Welfare Pension Act for the general population was enacted in 1973, but implementation was postponed because of the worldwide oil crisis (National Pension Service, 2010). More than a decade later, the legal framework of the general public pension service was revised as the National Pension Act and the program was implemented in 1988.
The NPS is a defined benefit and partially funded system. In other words, individuals contribute part of their monthly income to the NPS and they start receiving their monthly pension at the full benefits age (FBA; Hong, Reference Hong2009, Reference Hong2012). There is no early entitlement age (EEA) in South Korea. The FBA was set at 60 but is designed to increase to 61 in 2013 and 65 in 2033, after increasing 1 year every 5 years. Before July of 2000, the payroll tax was 3% for self-employed and daily laborers who self-report their monthly income, while employed workers only paid a half of 3% and their employers paid the other half. Starting in July of 2000, the payroll tax has increased by 1% every year and reached 9% in July of 2005.
The elderly older than the retirement age at the time of implementation that did not contribute to the NPS did not receive pension benefits. Also, unlike the US social security program, there is no earnings test in the NPS (Hong, Reference Hong2009, Reference Hong2012). Thus, the eligible elderly can receive their public pension regardless of how much they make per year. Unlike the US, spouses of workers are not automatically entitled to any portion of the workers’ benefit. However, surviving spouses receive 100% of the workers’ benefits. Divorced spouses can also receive part of the public pension of ex-husbands or wives based on the duration of their marriage. In our analysis, we exclude surviving and divorced spouses who receive public pension income (about 6% of pension recipients in our study) through dead or divorced spouses’ pension accounts because our research design is based on individuals’ own incentives to enroll in the public pension.
The NPS has experienced several major coverage expansions. The NPS began with employees in establishments with 10 or more employees. Compulsory coverage was expanded to those firms with five or more employees in 1992 and to farmers in 1995. Right after the 1997 Asian financial crisis, the need for strengthening the public safety net for the elderly was higher than ever. To meet the public needs, compulsory coverage was extended to urban dwellers ages 19–59 that were self-employed, unemployed, or out of the labor force in 1999. As a result, the NPS achieved universal pension plan status targeting the entire public. As shown in Figure 1, the rapid expansion of coverage in 1999 resulted in a sharp increase in the number of contributors from 7.13 million in 1998 to 16.26 million in 1999 (National Pension Service, 2010). The NPS is a partially funded system and there have been more contributors than receivers. Thus, the size of the NPS trust fund has become larger; it was 35.2% and 36.7% of the total Korean GDP in 2005 and 2010, respectively (Hong, Reference Hong2009, Reference Hong2012). In 2013, it reached about US$379 billion after providing US$85 billion to 3.4 million recipients.Footnote 3
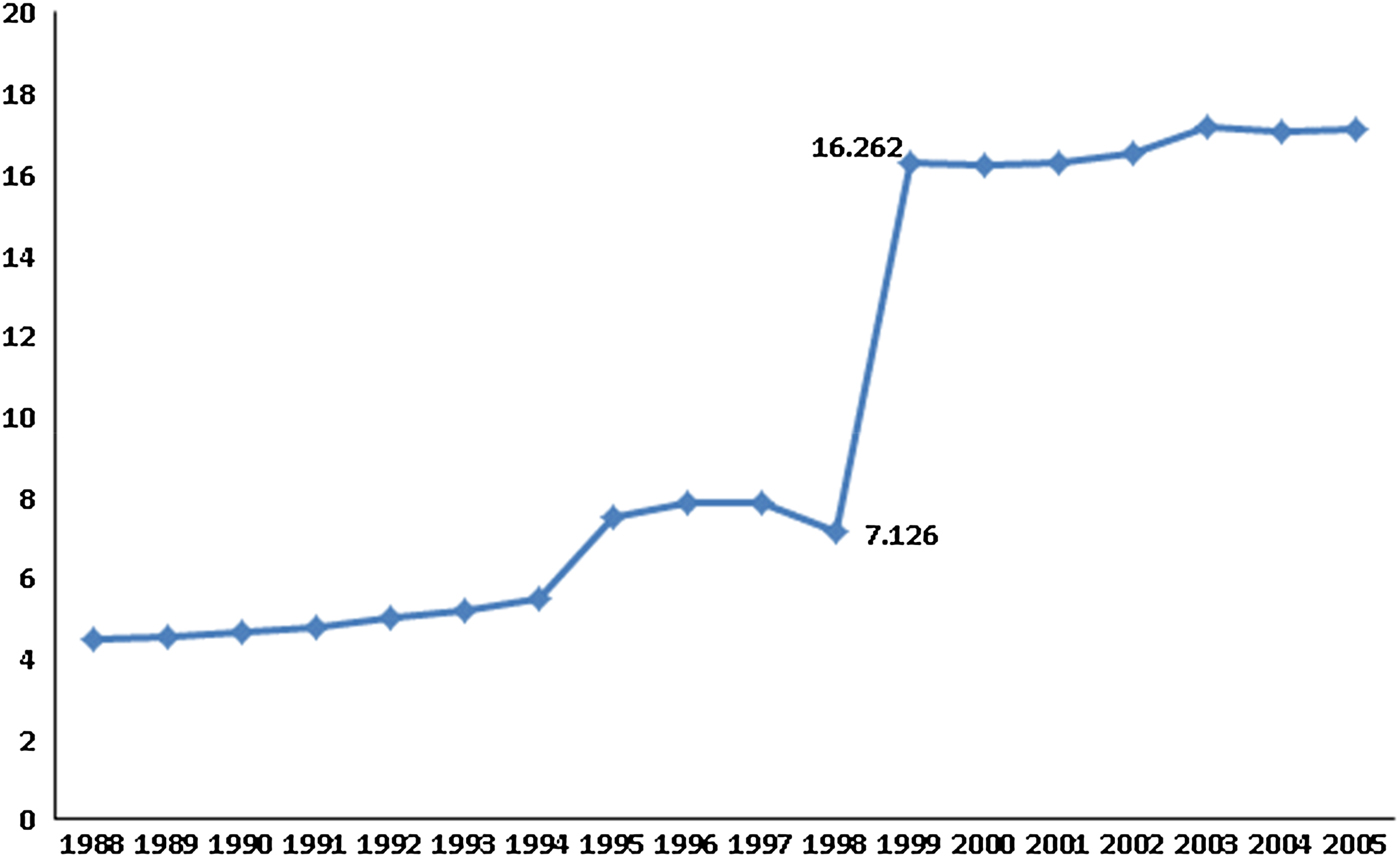
Figure 1. National Pension Service Contributors by Calendar Year (in millions).
We closely examine the timing of the pension expansion and eligibility criteria in 1999 and find that certain birth cohorts faced natural barriers to participation and had less incentive to participate. This paper takes advantage of this policy change to evaluate the impact of the public pension on the elderly's expenditure, consumption, and private transfers. In January 1999, the NPS office publicly informed all Korean citizens ages 19–59 that they were required to enroll in the NPS. In the process of implementation, local public servants directly contacted all Korean citizens aged 19–59 that did not enroll in the pre-existing NPS and informed them of the enrollment process. Individuals who were self-employed were required to participate. Those who were unemployed or out of the labor force could opt out, but to do so they had to report to the NPS office. Enrollees needed to contribute at least 15 years to receive a public pension. However, if the first-time enrollees were more than 50 years old, they were allowed to receive their public pension after contributing for only 5 years.Footnote 4 Also, many first-time enrollees close to the retirement age under-reported their earnings to minimize their contributions because they were small business owners or unemployed and there was a general distrust of the NPS in the early years. As a result, many of those pensioners received relatively small pensions (about US$150–200 per month) when they retired.
A special condition of the 1999 public pension expansion allowed individuals ages 60–65 to enroll in the program and receive a public pension after contributing to the program for 5 years. However, the law did not mandate their enrollment and local public servants did not contact those individuals in person. As a result, individuals born in 1934–39 (aged 60–65 in 1999) had less incentive to enroll in the NPS than those born in 1940 or after (aged 59 or younger in 1999). Thus, being a few years younger or older than 60 made a significant difference in public pension enrollment for self-employed workers and individuals out of the labor force in the 1999 public pension expansion. We developed an IV using this natural experiment.
4 Data and descriptive statistics
The analysis sample is drawn from the Korean Welfare Panel Study (KOWEPS) that was developed by the Korean Institute of Social and Health Affairs in conjunction with the Social Welfare Research Institute of Seoul National University. The sample was nationally representative in 2006. We use the 2006 KOWEPS survey of 7,072 households which includes information on 14,469 men and women over the age of 19. The survey provides detailed family and individual-level socioeconomic data on variables such as age, birth year, sex, education, marital status, emotional, and behavioral health status, as well as social service needs and utilization. Household income and expenditures are also included. The 2006 KOWEPS wave is particularly useful as it includes detailed information on the receipt of public pensions as well as financial aid from adult children and siblings.
Using the 2006 KOWEPS, we illustrate the percentage of each birth cohort receiving a public pension in 2005 when the first public pension enrollees – induced by the 1999 public pension expansion – were eligible to receive a pension after the minimum 5 years of contribution. In our analysis, we define pension recipients as individuals who receive pension income from their own public pension account. We exclude the surviving and divorced elderly who receive pension income through their spouses’ pension account because their ages in 1999 are not directly related to incentives to enroll in the public pension. As indicated in Figure 2, there is a clear jump in the proportion of the elderly (about a 10 percentage point difference) receiving public pensions between those born in 1939 (age 60 in 1999) and 1940 (age 59 in 1999). Such a jump provides clear empirical evidence that in 1999, individuals age 59 or younger (born in 1940 or after) had a stronger incentive to enroll in the public pension than individuals age 60 or older (born in 1939 or before).
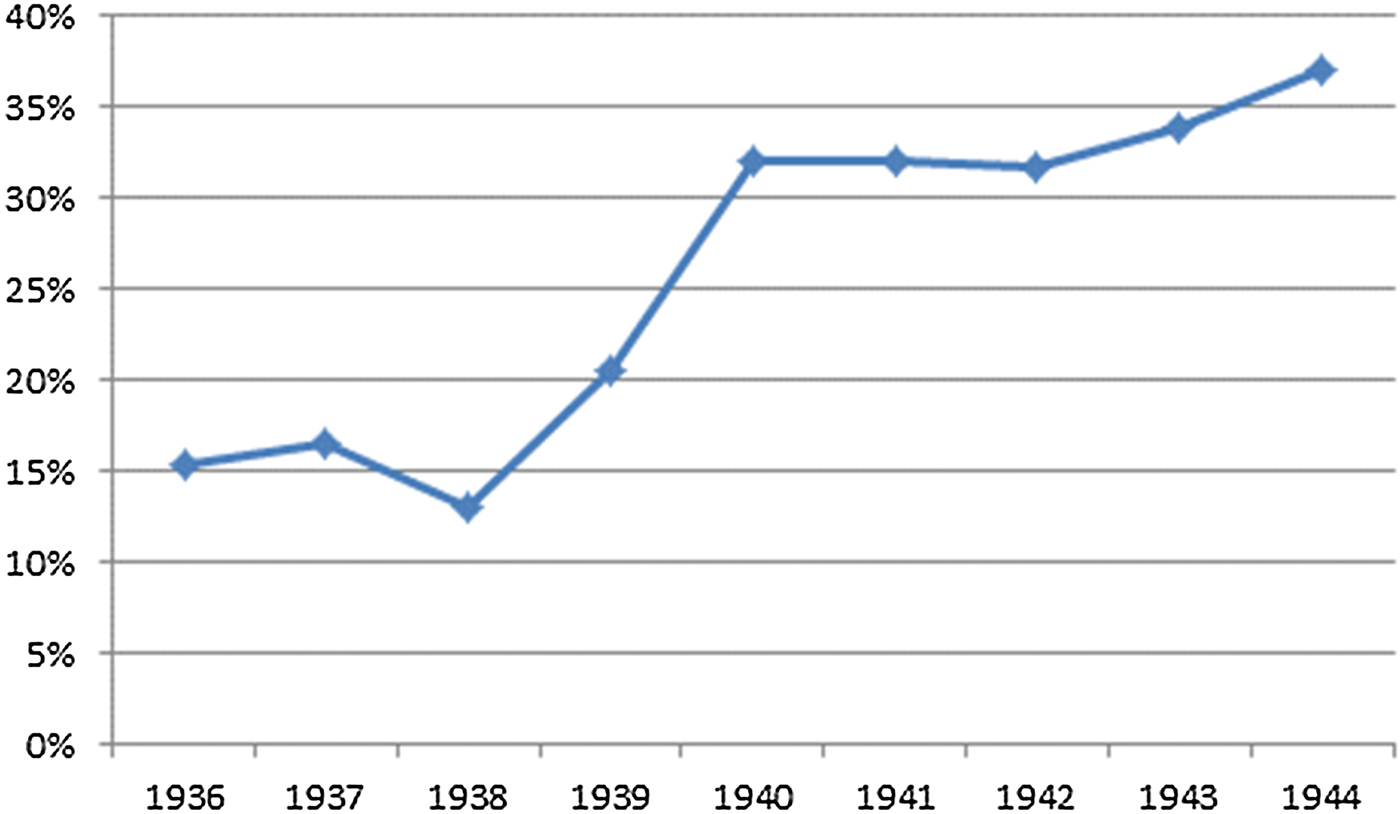
Figure 2. Percentage of National Public Pension Recipients in 2005 by Birth Cohorts. Note: Sample weights are used.
We investigated whether or not this sharp increase in pensioners was driven by large demographic changes in Korea at that time. Over the relevant time frame for this study, there were no distinctive changes in macro demographic factors, such as fertility or child mortality, as documented by Kim (Reference Kim1994) who conducted a detailed demographic analysis of the Korean population from 1910 to 1990. This suggests that the increase in pensioners was driven by the newly expanded pension program and not by demographic trends or shifts. To take advantage this sharp change in pension recipients by the public pension expansion in 1999, our analysis sample consists of individuals born in 1938–1939 (the older cohort aged 60–61 in 1999) and 1940–1941 (the younger cohort aged 58–59 in 1999).
Figure 3 shows the average pension payments of pension recipients in 2005. Regardless of birth cohorts, pensioners received between US$150 and 200 per month. In contrast to Figure 2, there is no sharp jump between individuals born in 1939 and 1940. This implies that the change made by the public pension expansion in 1999 affected the recipient rate of public pensions, not the magnitudes of the pension payments. Also, the monthly payments between US$150 and 200 reflect that the first generation of pensioners in the NPS who all received low benefits because they contributed small amounts for a short time period.
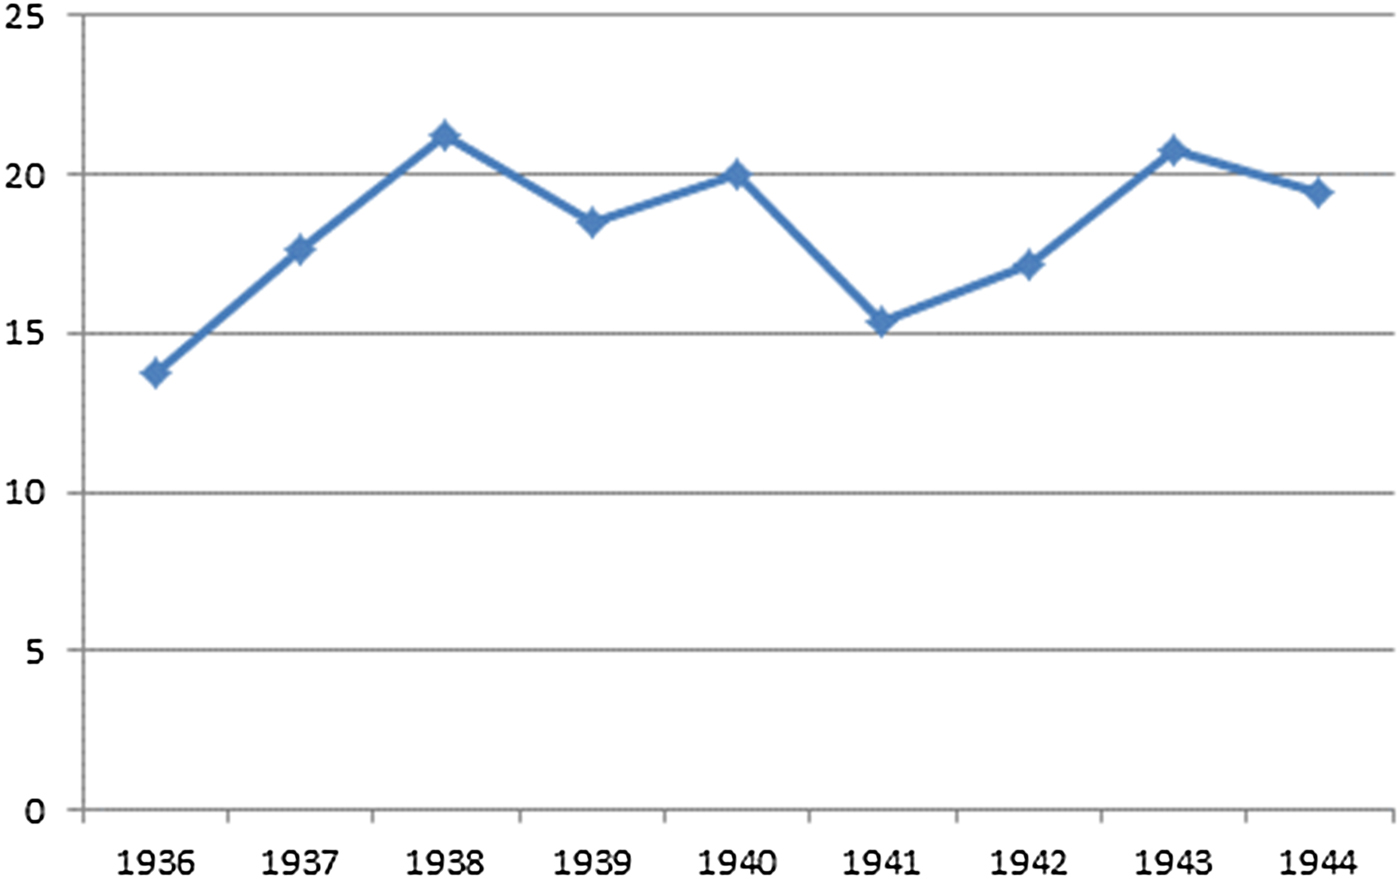
Figure 3. Average Monthly Pension (in ~US$10) of Pension Recipients in 2005 by Birth Cohorts. Note: Sample weights are used.
Table 1 provides descriptive statistics for individuals born in 1938–1939 (the older cohort aged 60–61 in 1999) and 1940–1941 (the younger cohort aged 58–59 in 1999) that comprise our analysis sample. These elderly men and women are household heads or dependents of residential adult children or other adult household members. The final sample includes all individuals born between 1938 and 1941 regardless of their labor market status in 1999 when the public pension expansion took effect. Our full sample includes 993 individuals.
Table 1. Descriptive statistics of two birth cohorts (N = 993)

1 Individuals born in 1938–39 are aged 60–61 in 1999 and 66–67 in 2005, while those born in 1940–41 are aged 58–59 in 1999 and 64–65 in 2005.
2 ***p < 0.01, **p < 0.05, *p < 0.1.
3 Sample size is 248 (97 for the older cohort and 151 for the younger cohort).
4 Monthly total expenditure and food expenditures per person are calculated dividing the total household expenditures and food expenditures by number of household members in the data. They are measured in 10,000 South Korean won (~US$10 in 2005).
As noted earlier and shown in Table 1, there is a sharp difference in pension receipt rates between birth cohorts. About 32% of the individuals in the younger cohort received a public pension, compared to 19% of the older cohort.Footnote 5 Readers should also note that public pensions do not fully cover the per capita expenditures of the elderly. As shown in the second row of Table 1, pensioners in the older and younger cohorts receive similar amounts of pension, about US$150–160 per month. Thus, the public pensions cover about 23%–24% of the total monthly expenditures of US$650–660 per person and are very close in magnitude to total food expenditures per person, about US$150 per month.Footnote 6
In order to examine the private transfers to the elderly from ‘non-residential’ adult children or own siblings, we present financial and non-financial support in this table. In the data, there was a question asking what kinds of help the elderly received from non-residential adult children or the elderly's siblings. Financial help is set to 1 if the elderly received any financial transfer or help while non-financial help is set to 1 if the elderly receive any informational help or emotional support through communications or visitations. Consistent with the notion that public pensions may crowd out private transfers, the younger cohort received less financial help from their adult children or their own siblings. There is an eight percentage point difference in this source of financial support for the elderly between the two adjacent birth cohorts. On the other hand, the percentage of non-financial help toward the elderly indicates that the younger cohort received more non-financial help than the older cohort. This suggests that some of the financial assistance from family members was replaced with non-financial assistance.
With respect to the vast majority of other demographic controls, there are few differences between the two cohorts. Most of the control variables including bequests, residential region, educational attainment, and sex are not significantly different across the two cohorts. There is one exception. Those in the younger cohort were more likely to be living with a married spouse; the difference was sizable, eight percentage points.
5 Estimation strategy
Enrolling in the NPS and contributing enough years to be eligible is effectively an individual choice although the NPS is a compulsory system. Particularly, in South Korea, self-employed workers, or individuals without jobs may easily opt out the public pension by reporting that they do not have enough income to enroll in the public pension. These disadvantaged workers’ low financial literacy may affect their choice too (Lusardi and Mitchell, Reference Lusardi and Mitchell2011a , Reference Lusardi and Mitchell b ). This presents a significant challenge to producing a consistent estimate of the impact of receiving public pension on expenditures as well as private transfers of the elderly. Using a naïve OLS estimator may lead to selection bias whose direction depends on possible channels of selection behaviors.
First, people who expect higher expenditures may be more likely to enroll in the NPS because they need more income sources when they retire. Then, this type of selection behavior leads to positive bias in OLS estimates of the impact of receiving public pension on expenditures. Second, if people who expect to receive financial support from their adult children do not enroll in the public pension, this type of selection behavior may lead to negative bias in estimating the impact of receiving public pension on receiving private transfers from children. On the other hand, if people who plan to spend and consume more than others both enroll in the public pension and receive private transfers from their adult children, then it may lead to positive bias in estimating the impact of receiving public pension on receiving private transfers. Thus, OLS estimates of the impact of receiving public pension on private transfers could be ambiguous if the positive and negative biases exist at the same time.
Our estimate improves on naïve OLS estimates. Specifically, we take advantage of the pension expansion and enrollment eligibility in 1999 to construct an IV for receiving a public pension. Using the 2006 KOWEPS, we generate an indicator variable set to 1 for individuals born in 1940–41 (58–59 years old in 1999) and 0 for those born in 1938–39 (60–61 years old in 1999). Assuming that being 58–59 compared to 60–61 is virtually random except for a higher probability of enrollment in the public pension, our indicator variable is a plausible IV for whether the elderly enroll in the public pension program and receive a public pension. The previous section provides a range of evidence that 58–59 and 60–61-year-old individuals in 1999 are virtually the same in observed characteristics. Thus, such descriptive statistics support the assumption for a valid IV as outlined in Murnane and Willett (Reference Murnane and Willett2011) and Angrist (Reference Angrist1991); it is uncorrelated with our outcome variables (total expenditures; food expenditures; receipt of financial assistance from adult children or their own siblings; and receipt of non-financial assistance from adult children or their own siblings) except through its effect on participation in the public pension program.
Our model is specified as follows:
 $$Y_i = \beta _0 + P_i \delta _1 + X_i \beta + u_i, $$
where Y i reflects each of our primary outcomes for individual i in our cross-sectional data. Our four primary dependent variables are monthly total expenditure per person, monthly food expenditures per person, whether or not an individual receives financial help from adult children or their own siblings, and whether or not an individual receives non-financial help (any informational help or emotional support through communications and visitations) from adult children or their own siblings.
P i indicating 1 if receiving public pension and 0 otherwise.
δ 1 captures the effect of receiving public pensions on outcomes.
X i includes socioeconomic characteristics such as receiving bequests from parents, residential region, education, gender, and marital status.
To consistently estimate the impact of receipt of a public pension, we use Z i (1 if born in 1940–41 and 0 if born in 1938–39) as an IV for P i using 2SLS. We estimate heteroscedasticity-robust standard errors.
Examining the first stage regression, we explore the strength of our IV. Table 2 presents the first-stage results of our 2SLS model in which we regress our indicator variable, Z i , on the probability of receiving public pensions in 2005 when the elderly were 64–67 years old (64–65 years old of the younger cohort and 66–67 years old of the older cohort). We present two regressions; one without any control variables and the other including socioeconomic characteristics such as receiving bequests from parents, residential region, education, gender, and marital status. Our linear probability models results clearly indicate that having been born in 1940–41 compared to 1938–39 had a substantively large (13.2 and 15 percentage points, with and without controls, respectively) and statistically significant impact on the likelihood of receiving public pensions. F test statistics of our IV, about 23 and 33 for respective models, are high enough (more than 10) to indicate a strong IV (Stock et al., Reference Stock, Wright and Yogo2002). We also find that including control variables does not considerably change the estimated coefficient of our IV. This is an encouraging indication of a valid IV because it demonstrates that our IV is less likely to be related to unobserved characteristics.
Table 2. First-stage regression results of main analysis using 1938–39 and 1940–41
Note: ***p < 0.01, **p < 0.05, *p < 0.1. Robust standard errors are used; the IV is generated using birth cohorts based on whether individuals were induced by the public pension expansion in 1999. Thus, men and women who were aged 58–59 (born in 1940–41) are given 1 and those who were aged 60–61 (born in 1938–39) are given 0.
Under the heterogeneous treatment effects models, our IV estimates are interpreted as the local averagetreatment effects (LATE) for individuals who were induced to enroll in public pensions due to a policy change (Card, Reference Card, Ashenfelter and Card1999). That is, our IV estimates yield the consistently estimated impacts of receiving a public pension on outcome variables for those individuals who were induced to enroll in public pensions due to the 1999 public pension expansion. As a comparison, we additionally present OLS estimates of our models, but we expect that these estimates are inconsistent due to self-selection into the public pension program. We present the OLS estimates nonetheless to demonstrate the value of using a valid IV in this particular case.
6 Results
Table 3 presents the estimated OLS and IV coefficients side by side and illustrates the bias in the OLS estimates. We have four outcome variables: monthly total expenditure per person (measured in ~US$10), monthly food expenditures per person (measured in ~US$10), and whether the elderly receive financial and non-financial help from their adult children or their own siblings. The elderly in the sample are aged 64–67 in 2005. First, OLS estimates suggest that receiving a public pension increases monthly total expenditures by about US$95 and monthly food expenditures by about US$9. Since the total monthly expenditure per person is about US$650–660 in the sample, the increase of total expenditure due to receiving a public pension is large. However, these OLS estimates will be biased upward if the elderly who plan to spend more after retirement enroll in greater numbers in the public pension program.
Table 3. The impact of receiving public pension: analysis using 1938–39 and 1940–41 birth cohorts (N = 993)

Note: ***p < 0.01, **p < 0.05, *p < 0.1. Robust standard errors are used; monthly total expenditure and food expenditures per person are calculated dividing the total household expenditures and food expenditures by number of household members in the data. They are measured in 10,000 South Korean won (~US$10 in 2005). The IV is generated using birth cohorts based on whether individuals were induced by the public pension expansion in 1999. Thus, men and women who were aged 58–59 (born in 1940–41) are given 1 and those who were aged 60–61 (born in 1938–39) are given 0. All demographic variables in Table 2 are controlled; specific regression outcomes are available upon request.
In clear contrast, the IV estimates are much smaller than the OLS estimates and are not statistically significant. This implies that our IV method using the birth cohorts may correct the upward bias in the OLS estimates. The estimated impact is about US$16 on monthly total expenditure per person and about −US$8 on monthly food consumption. These impacts are small relative to the size of average pension payments of US$150–160 per month. The question remains as to why the receipt of a public pension does not increase average monthly total expenditures or food expenditures.
There are two plausible explanations. First, individuals who signed up for public pensions may have less personal savings. That is, private contributions to public pensions may have crowded out personal retirement savings. There is support for this explanation from previous research on this subject although this research was conducted mostly in the context of developed countries (Feldstein, Reference Feldstein1974, Reference Feldstein1982; Samwick, Reference Samwick2000; Attanasio and Brugiavini, Reference Attanasio and Brugiavini2003; Attanasio and Rohwedder, Reference Attanasio and Rohwedder2003; Bloom et al., Reference Bloom, Canning, Mansfield and Moore2007). Recently, taking advantage of the 1999 South Korean pension reforms used in this study, Hong (Reference Hong2012) showed that individuals who enrolled in public pensions reduced their asset holdings by a range from 5% for older cohorts to 10% for younger cohorts in his analysis sample (age 25–54 in 2002). Particularly, Hong found that the bequest motive and precautionary savings explain 30%–60% and 20%–30% of the total reduction in assets, respectively.
An alternative explanation is that the public pension receipt may crowd out private transfers from adult children or other family members. This alternate explanation is not studied well and particularly relevant and important in countries such as South Korea which have a strong cultural heritage of children supporting their aging or elderly parents and imperfect financial markets during rapid economic development. With the disintegration of extended families and the public support of the elderly, public pensions may simply substitute for inter-family financial transfers. Thus, we focus on the effect of the receipt of a public pension on transfers to the elderly by non-residential family members.
As shown in Table 3, our IV estimate indicates that receiving a public pension reduces the probability of inter-family financial transfers by 40 percentage points. This reduction in financial support from adult children or their own siblings is quite large considering that 54% of the elderly in the data receive financial help from their adult children or their own siblings. In other words, if the elderly receive the public pension (on average about US$150–160), their probability of receiving financial help from adult children and their own siblings decrease considerably. On the other hand, receiving public pension increases non-financial help (information and emotional support) by 42 percentage points. Thus, there seems to be a shift from financial help to non-financial help from family members of pensioners. Note that these impact estimates are different from a simple OLS estimate, indicating that our IV controls for a great deal of selection in the decision to participate in the public pension program.
As mentioned earlier, our IV approach generates impact estimates for the sub-population of compliers who were induced to enroll in public pensions due to the 1999 public pension expansion. Thus, whether compliers are different from the entire population is important in interpreting our results. As discussed in Angrist and Pischke (Reference Angrist and Pischke2009), we cannot identify specific individuals who are compliers in our analysis sample, but we can find whether compliers are more or less likely to have certain characteristics as a group compared to all individuals in our sample.Footnote 7 Table 4 shows how compliers are differ from all the elderly on some basic characteristics.
Table 4. Complier characteristics compared to all the elderly in the sample of 1938–41 birth cohorts (N = 993)

Note: We cannot identify compliers in the sample as mentioned on pages 166–172 of Angrist and Pischke (Reference Angrist and Pischke2009) but we can find whether compliers are more or less likely to have certain characteristics. First, the relative likelihood that compliers have a particular characteristic is yielded using a formula suggested on page 171 of Angrist and Pischke (Reference Angrist and Pischke2009). Then, using the obtained relative likelihood values and the estimated proportion of characteristics of all individuals in the sample, we obtain the estimated proportion of characteristics of compliers.
We find that compliers are more likely to be male (28 percentage points), possess at least a high school education (25 percentage points), lived in a major city including Seoul and five other large cities (17 percentage points), and received a bequest from their parents (14 percentage points). Unfortunately, we could not examine whether compliers were more likely to be self-employed in 1999 because the 2006 KOWEPS data not include retrospective employment histories. Thus, our IV estimates are most likely to apply to better educated elderly men who lived in large cities and received a bequest from their parents. This is somewhat reassuring as lesser educated men without bequests are more likely to need inter-family transfers.
7 Bias and sensitivity analysis
We are aware of several concerns and questions related to our IV analysis. First, it is possible that our birth cohort IV is positively correlated with unobserved characteristics that increase total expenditures and food expenditures simply because the younger cohort may spend more than the older cohort. As the birth cohorts are, on average, just couple years older or younger, we believe that this potential source of bias is more theoretical than a serious problem. Nonetheless, to the extent that this problem might exist, our IV estimates would be positively biased changing the interpretation of our IV estimates to the upper bound estimates of the true impact of receiving a public pension. In other words, the consistent IV estimates for expenditures should be smaller than our IV estimates. This actually supports one of our conclusions that in the context of an urbanizing and rapidly developing country, a modest pension program is unlikely to improve the expenditures of the elderly.
Second, we are concerned that our birth cohort IV is negatively correlated with the probability of receiving inter-family transfers because the younger cohort of the elderly in our analysis is less likely to rely on adult children or their own siblings than the older cohort in a given year. If so, our IV estimate with regards to the impact on receiving private transfers should be negatively biased. In this case, the true impact size should be smaller in absolute values than what we have estimated.
Third, some may worry that our estimated impact of receiving a pension is not clearly channeled since some of the elderly lived with their adult children and their residential adult children's financial help is not reported in our data. In order to ease this concern, we also run two subsample analyses with the elderly: (1) those who lived only with their spouse or lived alone, and (2) those who lived in other types of households (as an individual or couple mostly lived with adult children or relatives). These two subsamples are mutually exclusive and comprise the full sample. Table 5 reports the results of the subgroup analysis based on living arrangements, which depart from our main findings in Table 3. In the first two columns, we present findings for the elderly who lived alone or only with their spouse. For this group, the IV estimates for total and food expenditures are small and statistically insignificant. These results are consistent with those found in Table 3. For the elderly who lived independently (alone or only with a spouse), the estimated crowding-out effect of pension receipt on the probability of receiving private transfers is very large, 72 percentage points. Although the probability of receiving financial help declined for the elderly living independently, they experienced a 76 percentage point increase in the probability of receiving non-financial help from adult children or their own siblings. Thus, it seems that public pension receipt has a much stronger crowing-out effect on the elderly who lived alone or only with a spouse. As a result, their total expenditures and food expenditures remain unchanged although they are more likely to obtain non-financial help from the adult children or their own siblings.
Table 5. The impact of receiving public pension by living arrangements

Note: ***p < 0.01, **p < 0.05, *p < 0.1. Robust standard errors are used; monthly total expenditure and food expenditure per person are calculated using the total household expenditure and food expenditures and number of household members in the data. They are measured in 10,000 South Korean won (~US$10 in 2005). The IV is generated using birth cohorts based on whether individuals were induced by the public pension expansion in 1999. Thus, men and women who were aged 58–59 (born in 1940–41) are given 1 and those who were aged 60–61 (born in 1938–39) are given 0. All demographic variables in Table 2 are controlled; specific regression outcomes are available upon request.
The third and fourth columns of Table 5 present rather different findings for the elderly who lived with adult children or other relatives. The IV estimated impacts on the total and food expenditures are also small and not statistically significant. Although such IV estimates are similar to those found in Table 3, they are mostly from the bundling of pension income with household income from other adult children and relatives. More importantly, the estimated crowding-out impact for this group is small and not statistically significant, 6.4 percentage points because the transfer to the elderly from adult children or other relatives mostly are embedded within a household and do not appear as an inter-family transfers. Thus, the living circumstances of the elderly living with adult children and other relatives are unchanged. Their total and food expenditures are unchanged as are the probabilities of both financial and non-financial assistance. This contrasts with the elderly who lived independently, who expenditures are unchanged but who are more likely to receive non-financial help and less likely to receive financial transfers.
Fourth, we also examine the relative magnitudes of the crowding-out effects of public pension receipt on private inter-family transfers based on the education level of the pensioner. In 1999, the education level of potential pensioners (born 1938–1941) was considerably less than it is today. High school matriculation was sufficient to qualify individuals for white collar jobs, including banking and public services. Therefore in Table 6, we compare individuals with a middle-school education or less to individuals with at least some high-school education. Both OLS and IV estimates are reported, but we discuss the IV results here as we have greater confidence in them.
Table 6. The impact of receiving public pension by education

Note: ***p < 0.01, **p < 0.05, *p < 0.1. Robust standard errors are used; monthly total expenditure and food expenditure per person are calculated using the total household expenditure and food expenditures and number of household members in the data. They are measured in 10,000 South Korean won (~US$10 in 2005). The IV is generated using birth cohorts based on whether individuals were induced by the public pension expansion in 1999. Thus, men and women who were aged 58–59 (born in 1940–41) are given 1 and those who were aged 60–61 (born in 1938–39) are given 0. All demographic variables in Table 2 are controlled; specific regression outcomes are available upon request.
We find that the IV estimates for total and food expenditures are small and statistically insignificant. These results are consistent with those found in Table 3. The receipt of public pensions appears to impact the higher educated pensioners the most. Receipt of a pension reduces the probability of any financial inter-family transfers by 76 percentage points. This effect is substantively smaller (a 29 percentage point reduction) and statistically insignificant for less educated pensioners. Thus crowding out appears to be more highly concentrated in the population of pensioners who were more likely to be better-off financially (due to their higher educational achievement). Interestingly, receipt of a pension is associated with a 48 percentage point increase in receipt of non-financial help from non-residential children and this increase is concentrated among those with less education. Thus, some of the most vulnerable elderly, those with the least education, benefited by pension receipt, less crowding-out, and increased non-financial assistance from family members. Ironically, none of this seems to have increased expenditures on food or other types of consumption by those with less education.
Fifth, the crowding-out effect of pension on private transfers may depend on whether or not the elderly lived in large urban areas. The elderly in large urban areas may be more independent than those in smaller cities or rural areas. Table 7 presents our subsample analysis results for the elderly in major cities (Seoul and five major cities in South Korea) as well as other smaller cities and rural areas. Consistent with the results in Table 3, the IV estimates indicate that there are no statistically significant changes of the pension expansion on either total or food expenditures. The signs of the IV estimates for financial and non-financial help from non-resident children are similar to those found in Table 3 irrespective of whether or not individuals live in more urban or rural areas. However, the results in this subsample analysis are statistically insignificant, possibly due to the smaller sample sizes available for these analyses. Thus this subsample analysis does not alter our main findings.
Table 7. The impact of receiving public pension by urban and rural areas

Note: ***p < 0.01, **p < 0.05, *p < 0.1. Robust standard errors are used; monthly total expenditure and food expenditure per person are calculated using the total household expenditure and food expenditures and number of household members in the data. They are measured in 10,000 South Korean won (~US$10 in 2005). The IV is generated using birth cohorts based on whether individuals were induced by the public pension expansion in 1999. Thus, men and women who were aged 58–59 (born in 1940–41) are given 1 and those who were aged 60–61 (born in 1938–39) are given 0. All demographic variables in Table 2 are controlled. Specific regression outcomes are available upon request.
1 Major cities include Seoul and five major cities (Kwanju, Daegu, Pusan, Ulsan, and Inchon) in South Korea.
Finally, in order to increase confidence in our IV estimates, we conducted a falsification test and re-estimated our main models for two birth cohorts both of which were too old to be affected by the public pension expansion in 1999. This falsification test sets the new IV equal to one for men and women who were aged 60–61 in 1999 (born in 1938–39) and is 0 for those who were aged 62–63 in 1999 (born in 1936–37). Remember, the oldest cohort affected by the public pension was born in 1940. As shown in Table 8, OLS estimates are very similar to what we had in Table 3 while these IV estimates are highly imprecise, uniformly insignificant, and do not suggest any stories. As expected, the estimated coefficient of this IV is also very small (0.006) and statistically insignificant.Footnote 8 Thus, this analysis works as a falsification test, providing greater confidence that the policy break among birth cohorts in our main analysis is a unique intervention and that this policy lever is driving our findings.
Table 8. The impact of receiving public pension (Falsification Test: the elderly in the 1936–37 and 1938–39 birth cohorts N = 1,032)

Note: ***p < 0.01, **p < 0.05, *p < 0.1. Robust standard errors are used; monthly total expenditure and food expenditures per person are calculated dividing the total household expenditures and food expenditures by number of household members in the data. They are measured in 10,000 South Korean won (~US$10 in 2005). All demographic variables in Table 2 are controlled. The IV in this falsification test is generated using birth cohorts that were too old to be affected by the public pension expansion in 1999. Men and women who were aged 60–61 (born in 1938–39) are given 1 and those who were aged 62–63 (born in 1936–37) are given 0. The estimated coefficient of this IV in the first stage regression is small (0.006) and statistically insignificant as we expected. The specific results are available upon request.
8 Discussion and conclusion
Many countries are now experiencing similar demographic and economic circumstances that were found in South Korea just a few decades ago. Rapid economic development and urbanization can be found in China, India, Brazil, Chile and many other countries in East Asia and Latin America (World Bank, 2013). The size of the labor force is shrinking while the elderly population is growing in these countries. Thus, the policy issue of how to support elders is common to a broad array of countries with strong traditions of elder support by family members. In many of these countries, tax-evading underground labor markets make it much harder to design a public pension program for all retirees. For example, self-employed and temporary blue-collar workers (who jointly comprised 33% of heads of households aged 30–50 in 2008 in South Korea – the Korean Household Earnings and Expenditure Survey) underreported their income because many of these workers are in underground labor markets. At the same time, traditional family support and care from adult children for elderly parents in these countries has diminished recently because industrialization and urbanization have weakened traditional family ties and obligations (Shetty, Reference Shetty2012). It is against this backdrop that we conducted this study.
Our results are mixed and overall give pause for concern about the magnitude of the pension programs that might be required to improve the economic circumstances of the elderly. Our findings suggest that receiving public pension benefits did not increase the expenditures of the elderly who were induced to participate in the 1999 expansion of the NPS. This is partly because the receipt of new pension benefits was offset by a decrease in traditional inter-family financial transfers to the elderly. The estimated crowding-out of private transfers by public pensions is large (about 40 percentage points) in absolute terms and is large relative to the 6 percentage points found in Cox et al. (Reference Cox, Eser and Jimenez1998) that investigated pension crowding-out in Peru. Also, our findings are more distinct when we examine the elderly who live only with a spouse or live alone because receiving pension income clearly channels through altruism of adult children and other relatives.
From another perspective, we can say that monthly total and food expenditures remained constant and non-financial help from children increased. Crowding-out of public pensions by reductions in familial support was less than 100%. This suggests that the NPS expansion improved the lot of the elderly in South Korea even if this was not reflected in increased spending. Perhaps more encouraging is our subsample analysis of the elderly by education attainment. The most vulnerable South Koreans (those with the least education) did not experience declines in total or food expenditures, financial help from children, and actually received more non-financial help from their non-residential children. This group of pensioners should have been better off in the aftermath of the NPS expansion.
We are troubled nonetheless by the magnitude of the reductions in financial support in the South Korean context. In this culture, care of elders is thought to fall largely on adult children and extended family members. It is possible that we would have found increases in expenditures by the elderly had NPS pension benefits been larger. However, NPS pension benefits were quite modest at that time, about US$150–200 per month. We cannot address whether or not larger pension benefits might result in more or less crowding-out. In other words, we do not know how large pension benefits would have to be to actually improve the well-being of the elderly. Also, even very generous pension programs would have no guarantee of improving or even maintaining economic circumstances in the context of an aging population. For example, Miyazawa (Reference Miyazawa2010) contends that generous public pension programs may discourage economic growth. That is, there are greater incentives for parents to educate their children when those children are ultimately responsible for elder-care. When the government takes over the role of providing for the elderly, the incentive to invest in the education of children may decrease. Smaller investments in human capital could stall or lower economic growth. As history suggests, however, this has not been a problem in South Korea.
There are two caveats to our findings. First, although the estimated crowding-out of private transfers by public pensions is large (about 40 percentage points), it is imprecise and its confidence interval overlaps with those found in previous studies. Thus, the true impact may be lower and more similar to other studies. Second, because IVs generate LATE estimates of the effects of public pension receipt, it is relevant for the sub-population of compliers (the elderly who were induced to enroll in public pension by the public pension expansion in 1999). Thus, the estimated impact is not directly generalizable to the entire elderly population in South Korea. Specifically, we find compliers in the KOWEPS data are more educated, elderly men who lived in large cities and received a bequest from their parents. Our IV estimates are likely to have greater relevance for this group of individuals.
Despite these caveats, this study is a timely complement to the work of Hong (Reference Hong2012). Hong studied younger individuals (less than age 54 in 2002) than in this study and focused on the impact of 1999 public pension expansions on individuals’ asset holdings in South Korea. In his analysis of individuals aged 25–54 in 2002, individuals who enrolled in public pensions reduced their asset holdings by 5% for the older cohort to 10% for the younger cohort. Hong found that the expansion of public pensions significantly reduced personal savings. Taken together with our findings, it is quite possible that the expansion of the NPS crowded out both private savings and private transfers.
Although the expansion of the public pension program in South Korea did not appear to increase expenditures of the elderly, there are other reasons to be cautiously optimistic about this policy tool. As noted previously by Fan (Reference Fan2010), private transfers may not provide steady income support for the elderly because their adult children's financial conditions are affected greatly by the ups and downs of the macro economy. Also, the amount of the private transfer may depend on the level of altruism of adult children toward their parents and implicit inter-family contracts of borrowing and lending may generate conflicts within extended families. In contrast, public pensions provide regular, guaranteed disposable income to the elderly regardless of the ups and downs of the macro economy and independent of the beneficence of family members. Easing the necessity for interfamily transfers may alleviate conflicts and tensions between the elderly and their adult children.
As the NPS in South Korea matures, many pensioners who contributed longer in public and private firms are expected to have enough from their public pensions to offset diminishing family support. However, workers who were self-employed or employed in temporary blue-collar jobs usually contributed substantially less, not only because their actual income was low, fluctuated, or underreported but also because their financial literacy is low (Lusardi and Mitchell, Reference Lusardi and Mitchell2011a , Reference Lusardi and Mitchell b ). Such workers constituted about 54% of pension contributors in 1999 and are disadvantaged workers that will need more financial help at their retirement (Hong, Reference Hong2009). South Korea is not alone in this matter. In most developing countries, a large percentage of workers are employed underground and their incomes are difficult to track (Bird and Zolt, Reference Bird and Zolt2005). Thus, a more comprehensive approach to elderly care is likely to be necessary. Even broader pension reforms with informative financial education is required to encourage those disadvantaged workers to contribute more out of their current income and to work longer to receive more generous benefits at retirement.


