


Information about the daily intake of food groups and nutrients is relevant to many aspects of nutritional research and public health. Data on how the intake of foods is distributed across meals provide additional information on the food habits of a specific population. Such information will be useful when formulating food-based dietary guidelines (FBDG) and when tailoring interventions for healthy eating to a target population. In fact, it has been suggested that public health advice and strategies to change dietary intake need to focus on meal types to a larger extent to be understandable and adaptable by the public( Reference Holmback, Ericson and Gullberg 1 ).
A brief summary of the most recent FBDG for the Norwegian population, published in 2011( 2 ), is presented in Table 1. Quantitative recommendations for minimum intakes are given for fruits, vegetables, fish and whole grains, although meal types are not specifically mentioned in these guidelines. In Norway, dinner has traditionally been a hot meal, while breakfast, lunch and supper/evening meal have generally been cereal-based cold meals( Reference Bugge and Døving 3 ). Lunch often consists of packed sandwiches brought from home to work or school. However, many schools and workplaces have staff canteens and hot lunches are not uncommon( Reference Bugge and Døving 3 ). Since dinner is often eaten quite early (from 15.00 to 19.00 hours)( Reference Bugge and Døving 3 ), many Norwegians have a supper/evening meal, which is generally regarded as one of the main meals( 4 , Reference Overby, Stea and Vik 5 ). However, dietary behaviour is constantly evolving, thus providing a need for updated information about eating habits and meal patterns in the population.
Table 1 Norwegian food-based dietary guidelines in brief( 2 )
It is widely recognized that dietary behaviours vary within different subgroups of the population. The link between indicators of socio-economic status and dietary quality is well established from international( Reference Darmon and Drewnowski 6 ) as well as Norwegian studies( Reference Johansson, Thelle and Solvoll 7 , Reference Hjartaker and Lund 8 ). However, little is known about how the composition of different meals varies in relation to background variables such as education and age, both internationally and in Norwegian adults specifically.
The omission of different meals is likely to have different nutritional consequences, since different meal types tend to differ in dietary composition( Reference de Castro, Brewer and Elmore 9 ). Breakfast has been the most studied meal with regard to meal skipping. Breakfast skipping has been associated with a lower dietary quality( Reference Deshmukh-Taskar, Radcliffe and Liu 10 ) and adverse health outcomes( Reference Timlin and Pereira 11 , Reference Cahill, Chiuve and Mekary 12 ), although results have been inconsistent( Reference Timlin and Pereira 11 , Reference Levitsky and Paconowski 13 ). However, depending on the missed meal’s contribution of food items and nutrients to the diet, the skipping of other meal types is likely to influence one’s diet in different ways.
The aim of the present paper was to study how different meal types contribute to the intakes of fruits, vegetables, fish and whole grains in both Norwegian adults in general and in different subgroups of the population. Moreover, we wanted to investigate the consequences of skipping the meal that was the largest contributor to the intake of each food group.
Methods
Participants and design
The present study was based on data from Norkost 3, a Norwegian dietary survey conducted in 2010–2011. The design and methodology have been described in detail elsewhere( Reference Myhre, Loken and Wandel 14 ). A representative sample (n 5000) of the Norwegian population aged 18–70 years was randomly selected from the National Register and asked to complete two telephone-administered 24 h recalls approximately four weeks apart. Of the 5000 invited, 153 were unavailable for contact. In total, 1787 participants completed two recalls (37 % participation rate). Only participants completing two 24 h recalls were included in the analyses in the present paper. All 1787 participants were included in the analyses of food group intakes by meal type and in a comparison of those having intakes of each of the food groups in accordance with the FBDG or not. Due to missing information on some of the background variables, thirty-four participants were excluded in the analyses of food group intakes by meal type, education and age, and in the analysis of skipping meals. The study was conducted according to the guidelines laid down in the Declaration of Helsinki and all procedures involving human subjects were approved by the Regional Committee for Medical and Health Research Ethics. Verbal informed consent was obtained from all participants. Verbal consent was witnessed and formally recorded.
Assessment of dietary intake
The 24 h recalls aimed to include all foods and beverages consumed by the participants in the period between waking up on the preceding day and waking up on the interview day. The interviews were performed by trained personnel using an in-house data program (KBS version 7·0) linked directly to the food composition database. This food composition database is based on the Norwegian food composition table from 2006( 15 ) and is supplemented with additional food items from reliable sources. The 24 h recall functionality of the KBS program was developed specifically for the Norkost 3 study. The interviews were conducted as a three-step process. The first step reviewed the previous day’s eating and drinking occasions including meal type, time and location of the eating/drinking occasion and a brief description of the foods and/or beverages consumed. Each eating or drinking occasion was defined by the respondent as breakfast, lunch, dinner, supper/evening meal or snack. The second step included detailed information about the food and portion sizes. The amounts of food consumed were quantified by household measures and a booklet containing photographs of foods in different portion sizes. The third step consisted of a checklist of commonly forgotten food items. Before starting the recall, the participant was asked if he or she considered the previous day a normal day with regard to food and beverage intake (yes/no). Seventy-three per cent of the recall days were regarded by the respondents as normal days with regard to food and beverage intake.
Background variables
BMI was calculated based on self-reported weight (in kilograms) and height (in metres) as weight divided by the square of height (kg/m2). The continuous BMI variable was dichotomized into ‘normal weight (BMI<25·0 kg/m2)’ and ‘overweight (BMI≥25·0 kg/m2)’. Level of education was originally grouped into eight categories ranging from ‘no education’ to ‘university/college education at master/PhD level’, but was regrouped into two categories: ‘high school, technical school, trade school or lower’ and ‘university or college’. The continuous age variable was regrouped into three age groups: 18–34 years, 35–54 years and 55–70 years. Smoking habits were originally grouped into three categories, but were regrouped into two categories: ‘smokers (daily/occasional smokers)’ and ‘non-smokers (never-smokers and previous smokers)’. Interest in a healthy diet was originally grouped into five categories ranging from ‘no interest’ to ‘very high interest’, but was regrouped into two categories: ‘no, low or moderate interest’ or ‘high or very high interest’. Region of residency was determined based on the participants’ postal code and consisted of seven categories. Weekdays were defined as Monday to Friday and weekend days as Saturday and Sunday.
Definition of food groups and the main contributing meal
The food groups ‘fruits’ and ‘vegetables’ included all types of fruits and vegetables, including fresh, frozen, canned or conserved fruits, berries and vegetables, excluding legumes and potatoes. For canned fruits and vegetables, only the fruit or vegetable part was included, and not the solution of fruit juice, sugar or salt used for preservation. Likewise, only the fruit or berry part of jams was included. For ‘fish’, all types of fish were included, including the amount of fish in sandwich spreads and ready-made dishes. All ingredients other than fish were excluded from the calculations. Shellfish and other types of seafood not classified as fish were not included, because these foods are not included in the FBDG.
‘Whole grains’ were defined to contain all parts of the entire grain seed. To qualify as a whole grain, processed grains should deliver approximately the same balance of germ, endosperm and bran as found in the original grain seed, which is in agreement with the definition given by the American Association of Cereal Chemists( 16 ). The amounts of fruits, vegetables, fish and whole grains in each food item were estimated based on recipes within the KBS software, information from the food industry, declared amounts on packaging or by using best judgement from declared ingredients.
The intakes of fruits, vegetables, fish and whole grains were calculated for each meal type for each participant as the average of two dietary recalls (Tables 3 and 4, Fig. 1). For each food group the main contributing meal type was identified. The main contributing meal was defined as the meal type contributing the highest amount in grams of the food group in question. For the comparison of days with the main contributing meal and days when the main contributing meal had been skipped, individual recall days (two for each participant) were used rather than the mean values for two days (Fig. 2). The main contributing meal was considered as skipped if it had not been reported by the participant on the day in question.
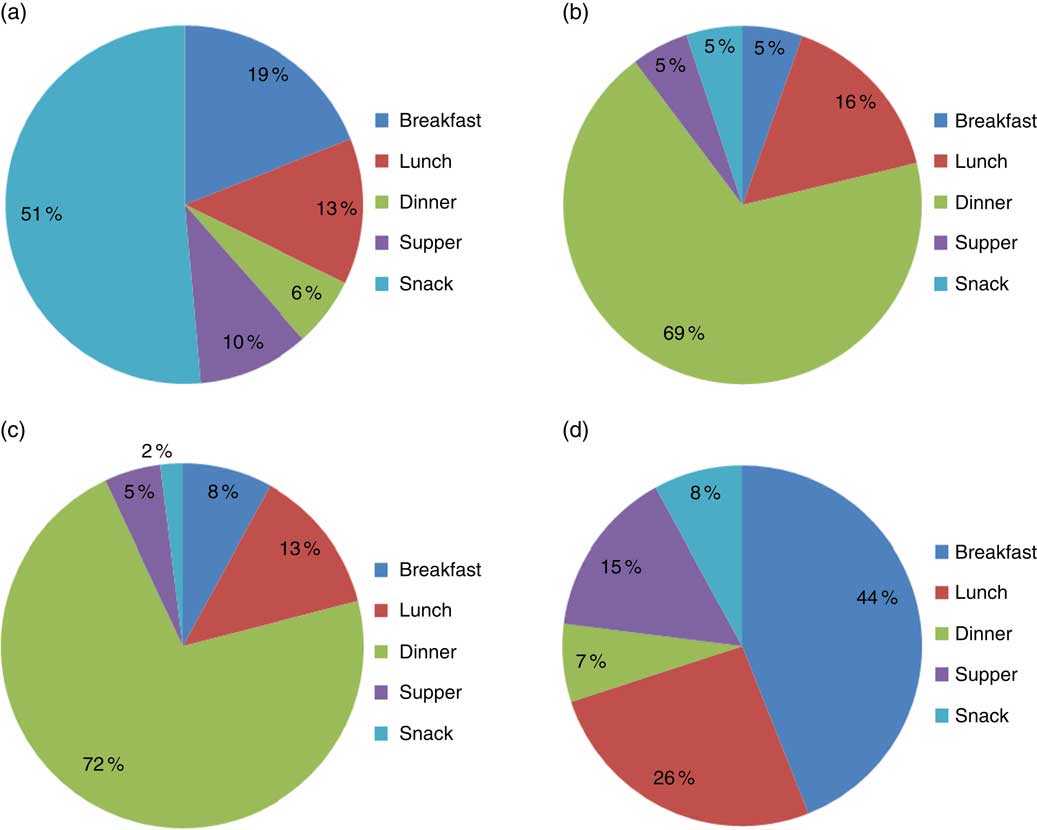
Fig. 1 Percentage contribution to total intakes from each meal type for the food groups (a) fruits, (b) vegetables, (c) fish and (d) whole grains, Norkost 3 study, 2010–2011 (n 1787)
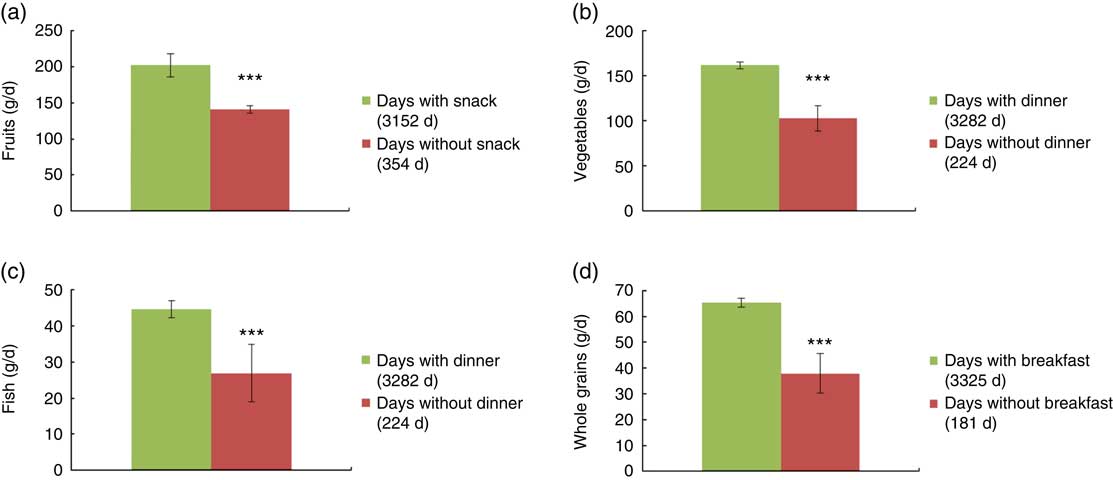
Fig. 2 Intakes of (a) fruits, (b) vegetables, (c) fish and (d) whole grains on days when the main contributing meal is included in the diet compared with days when the main contributing meal is skipped, Norkost 3 study, 2010–2011 (n 1753). Intake data from two 24 h recalls, presented as adjusted means with bootstrap 95 % confidence intervals represented by vertical bars, adjusted for gender, age, BMI, educational level, smoker/non-smoker, interest in a healthy diet, region of residency, weekend day/weekday, and if the day was a normal day or not with regard to food and beverage intake. ***P<0·001, differences between days with and without the main contributing meal were tested using linear mixed models with bootstrap. Significance level set to P<0·013 due to multiple testing
Interpretation of food-based dietary guidelines
Participants were classified as having an intake of fruit in line with the FBDG if their daily intake was 250 g or more. Similarly, participants were classified as having an intake of vegetables in line with the FBDG if their daily intake was 250 g or more. A maximum of 100 g of fruit or vegetable juice was included in the fruit/vegetable intake. Since the dietary data originated from two 24 h recalls, the recommendation of 300 g of fish per week (including minimum 200 g of oily fish) was recalculated to at least 43 g of fish per day (including minimum 29 g of oily fish). Participants were classified as having an intake of whole grains in line with the FBDG if their intake was 75 g per 10 MJ or more.
Statistical analyses
Statistical analyses were carried out using the statistical software package Stata version 13·1. All tests were two-sided. The analyses were performed separately for each food group. Our data contained repeated measurements for each person, either as food group intakes estimated from five different meal types per person (Tables 3 and 4) or as food group intakes from two individual recall days for the comparison of food group intakes on days with or without the main contributing meal (Fig. 2). To adjust for the dependency in the data due to repeated measurements for each participant, mixed models with total daily intake in grams of each of the four food groups as outcome variables were initially used with a variance component (random intercept) for participants. However, in some of the analyses this variance component was estimated to be close to zero, and the mixed models could therefore be replaced by linear regression. This was done for the analyses of: (i) the main contributing meal (Tables 3 and 4); (ii) differences in meal-to-meal intakes of each food group between participants having an intake of the food group in question in line with the FBDG and those with lower intakes (Table 3); and (iii) differences in meal-to-meal intakes according to age and education (Table 4). For the comparison of food group intakes on days with and without the main contributing meal of intake (Fig. 2), there was a considerable between-subject variation and the mixed-models analyses were retained.
To identify the main contributing meal for each food group in each gender (Table 3), meal type (breakfast, lunch, dinner, supper/evening meal or snack) was added as an independent variable to the model. To study differences in intake patterns according to whether or not the participants had an intake of each food group in line with the FBDG, an interaction between meal type and the dichotomous variable ‘following FBDG or not’ was included in the model. No additional independent factors were added to these models. As a result of the Bonferroni correction (α=0·05 divided by seventeen tests per food group for each gender), the significance level was set to P<0·003.
The main contributing meal and differences in absolute meal-to-meal intakes according to age and education were then analysed for each food group (Table 4). To determine these effects, an interaction between educational level and meal type was first added, and in a second analysis the interaction was changed to an interaction between age group and meal type. In addition to educational level and age group, adjustments were made for the categorical variables of gender, BMI, smoker/non-smoker, interest in a healthy diet and region of residency. The youngest age group (18–34 years old) was used as a reference category for the age group comparisons. As a result of the Bonferroni correction (α=0·05 divided by twenty-two tests per food group for the age group comparisons), the significance level was set to P<0·002.
For the comparison of absolute intakes of fruits, vegetables, fish and whole grains on days with and without the main contributing meal of intake (Fig. 2), mixed models were used. The dichotomous variable ‘eating main contributing meal or not’ was added as an independent variable. Adjustments were made for gender, age group, educational level, BMI, smoker/non-smoker, interest in a healthy diet, region of residency, weekend day/weekday, and if the day was a normal day or not with regard to food and beverage intake. As a result of the Bonferroni correction (α=0·05 divided by four tests, one for each food group), the significance level was set to P<0·013.
As the data contained a high number of zeros (meaning that the person had not consumed the food group in question for the respective meal or for the day in question), causing a violation of the assumption of normally distributed residuals, case bootstrapping with 1000 repetitions was performed on all analyses. To retain the dependency structure in the bootstrap samples, participants rather than individual observations were sampled. The results are presented as adjusted means, bootstrap 95 % confidence intervals and bootstrap P values.
Results
Background characteristics of the participants
Table 2 shows background characteristics of the participants (52 % women). The mean age was 47 years for men and 45 years for women (age range 18–70 years for both genders). Compared with whole-country statistics, a lower proportion of the participants belonged to the youngest age group, while a higher proportion had a university/college education than in the general population.
Table 2 Characteristics of the study participants in the Norkost 3 study, 2010–2011 (n 1787)
† For calculating percentages in each age group for the general population, only the part of the population aged 18–70 years was included (results from 2011).
‡ BMI values for the general population are based on self-reported weight and height from questionnaires, 67 % participation for men and 75 % for women (results from 2012). Decimals for the reported percentages were not available.
§ Educational level for the general population is calculated for persons aged 20–66 years (results from 2011).
|| Smoking habits for the general population are reported for persons aged 16–74 years (results from 2011). Decimals for the reported percentages were not available.
Contribution of each meal to intake of fruits, vegetables, fish and whole grains
Table 3 shows intakes in grams of fruits, vegetables, fish and whole grains according to meal type by gender, as well as meal-to-meal intake of the same food groups in participants having intakes in line with or lower than the FBDG for each food group. For both genders and among both those having an intake of the relevant food groups matching the FBDG and those who did not, the same results were found regarding the main contributing meal. The intakes of both fish and vegetables were significantly higher from the dinner meal than from any of the other meals, making dinner the main contributing meal for these food groups. For fruits, snacks were the main contributing meal type, whereas breakfast was the main contributor to the intake of whole grains. However, whole grain intake was somewhat more evenly distributed across meals than fruits, vegetables or fish.
Table 3 IntakesFootnote † of fruits, vegetables, fish and whole grains according to meal type in men and women; total intakes and intakes according to adherence to the Norwegian food based dietary guidelines (FBDG), Norkost 3 study, 2010–2011 (n 1787)
Significance level set to P<0·003 due to multiple testing.
† Mean intakes and bootstrap 95 % CI based on two 24 h recalls.
‡ Linear regression with bootstrap, comparison of meal-to-meal intake of each food group for participants meeting the FBGD and participants not meeting the FBDG for each food group separately.
§ Dietary guideline=minimum 250 g fruits/d (including maximum 100 g fruit juice).
|| Main contributing meal; intake of the food group in question from this meal is significantly higher than from each of the other meals (all P<0·001), linear regression with bootstrap.
¶ Dietary guideline=minimum 250 g vegetables/d (including maximum 100 g vegetable juice).
†† Dietary guideline=minimum 43 g fish/d including minimum 29 g oily fish/d.
‡‡ Dietary guideline=minimum 75 g whole grains/10 MJ.
Absolute intakes of the food groups in question from each meal type were significantly lower in participants having intakes lower than recommended in the FBDG, with some exceptions for meals that were minor sources to intake.
The percentage contribution from each meal to total intakes of fruits, vegetables, fish and whole grains is illustrated in Figs 1(a)–(d). Dinner contributed 69 % of vegetable intake and 72 % of fish intake. Fifty-one per cent of fruit intake was derived from snacks, while breakfast provided 44 % of total daily intake of whole grains.
Table 4 shows meal-to-meal intakes in grams of fruits, vegetables, fish and whole grains according to educational level and age group. For each of the four food groups the meal identified as the main contributing meal was the same for both educational levels and in all three age groups. Snacks were the main source of fruit intake while fish and vegetables were derived mainly from dinner. Breakfast was the main contributor to whole grains in all groups. Still, some differences in absolute meal-to-meal intakes of some of the food groups were observed between the two educational levels and between the three age groups. Participants with a university/college education had a significantly higher fruit intake from breakfast and snacks than those without a university/college education. Vegetable intake from lunch was also significantly higher in those with a university/college education compared with those without this education. The two oldest age groups had a significantly higher intake of fruits from snacks compared with the youngest group. Likewise, the intake of fish for dinner was higher in the two older age groups. For whole grains, no differences were seen according to age or gender for any of the meals.
Table 4 IntakesFootnote † of fruits, vegetables, fish and whole grains from each meal type according to educational level and age, Norkost 3 study, 2010–2011 (n 1753)
Significance level set to P<0·002 due to multiple testing.
† Data from two 24 recalls; adjusted means and bootstrap 95 % CI adjusted for gender, age, BMI, region of residency, educational level, smoker/non-smoker and interest in a healthy diet.
‡ Linear regression with bootstrap, comparison of meal-to-meal intake of each food group for participants according to educational level.
§ Linear regression with bootstrap, comparison of meal-to-meal intake of each food group for participants according to age group, the age group 18–34 years is used as reference category.
|| Main contributing meal; intake of the food group in question from this meal is significantly higher than from each of the other meals (all P<0·001), linear regression with bootstrap.
Meal skipping days with and without the main contributing meal
Ninety-eight per cent of the participants had breakfast on at least one recall day. Likewise, 88 % had consumed lunch on at least one recall day, 99 % had consumed dinner on at least one recall day, 71 % had consumed supper/evening meal on at least one recall day and 95 % had consumed a snack on at least one recall day. The corresponding figures for the consumption of each meal on both recall days were 92 % of participants consuming breakfast on both days, 59 % of participants consuming lunch on both days, 89 % of participants consuming dinner on both days, 33 % of participants consuming supper/evening meal on both days and 82 % of participants consuming at least one snack on both days.
With regard to intakes of fish and whole grains on days with and without the main contributing meal of intake, intakes were about twice as high on days with the main contributing meal as on days when the main contributing meal was not consumed (Figs 2(c) and (d)). For fruits and vegetables, intake was approximately 50 % higher on days with the main contributing meal compared with days without this meal (Figs 2(a) and (b)).
Discussion
The current study showed that dinner was the most important meal for the intake of fish and vegetables, while snack meals were the most important meal type for the intake of fruits. Breakfast was the most important meal for intake of whole grains. This pattern was found both in participants with intakes of the food groups in question in line with the FBDG and in participants with lower intakes. The same pattern was also seen in participants with high and low education and across three age groups. A lower intake of the food groups in question was reported on days when the main contributing meal was skipped.
Contribution of each meal to intake of fruits, vegetables, fish and whole grains
Data on how meals contribute to the intake of various food groups are scarce. Kearney et al. looked at the intakes of several food groups according to meal type in Dutch dietary data from 1997–1998( Reference Kearney, Hulshof and Gibney 17 ). Similar to the findings in our study, dinner was an important source of fish and vegetables, while snacks contributed substantially to fruit intake. Other studies have also found that fruits are a common component of snacks( Reference Piernas and Popkin 18 – Reference Ovaskainen, Reinivuo and Tapanainen 21 ). However, the contribution of different meal types to intakes of different food items is likely to vary in different populations and population subgroups, e.g. fruits were not found to be main components in snacks in French adults( Reference Bellisle, Dalix and Mennen 22 ) or elderly Swedish women( Reference Andersson, Nydahl and Gustafsson 23 ).
The comparison of meal-to-meal intakes of fruits, vegetables fish and whole grains according to intake level, educational level and age primarily showed the same pattern of distribution of the food groups across meals. Nevertheless, the comparison of absolute intakes from each meal showed that participants with a higher education had a higher intake of vegetables for lunch than participants without a university/college education. This may be explained in part by availability, as those with a higher education may be more likely to have non-manual jobs with cafeterias at the worksite where vegetables may be available( Reference Wandel and Roos 24 ). With regard to age, the two older age groups had higher intakes of fruit from snacks than the youngest age group. This finding suggests that younger persons choose snacks containing less fruit than the older generations. Likewise, the two older age groups had higher intakes of fish for dinner. This age gradient in fish consumption is well recognized in the Norwegian population( Reference Johansson and Solvoll 25 ), but the observation that this difference is mainly caused by differences in intake at the dinner meal has not been previously described.
Meal skipping
The analyses exploring differences in the intake of each food group on days with and without the main contributing meal showed that the intake of whole grains was higher on days with breakfast than on days without breakfast. Studies from other countries have also shown that omitting breakfast or having irregular breakfast habits is associated with a less favourable dietary intake, such as lower total daily intakes of various nutrients( Reference Nicklas, Myers and Reger 26 , Reference Barr, DiFrancesco and Fulgoni 27 ) and a low frequency of fruit and vegetable intake( Reference Lazzeri, Pammolli and Azzolini 28 , Reference Pedersen, Meilstrup and Holstein 29 ). Fish and vegetable intakes were particularly low on days when dinner was not consumed. The study of fish and vegetable intakes from each meal also revealed that intakes from meals other than dinner were low. The consequences of skipping dinner have not been discussed much in the scientific literature. However, our study indicates that skipping dinner may have unwanted nutritional consequences, particularly concerning the intakes of fish and vegetables. Skipping snacks is not usually labelled meal skipping, but snacks make an important contribution to daily fruit intake and refraining from eating snacks was associated with a lower intake of fruit.
Meal skipping was generally quite low for breakfast, dinner and snacks in the Norkost 3 study. Since participation was rather low at 37 %, these figures may not necessarily be representative of meal patterns in the population as a whole. However, in a nationally representative Norwegian postal survey from 2005 (57 % participation rate), 81 % reported having breakfast daily, while corresponding figures for lunch, dinner and supper/evening meal were 70 %, 84 % and 43 %, respectively (J Ramm, Statistics Norway, personal communication, 17 January 2014)( 4 ). These figures are not directly comparable to our data, as different methods were used for collecting information about meal habits. Still, the results from the postal survey are quite similar to our results, suggesting that a meal pattern consisting of three or four main meals is still being practised by a considerable part of the population.
Fruits and vegetables are commonly grouped together when discussing nutrition and health but, as pointed out by others( Reference Trudeau, Kristal and Li 30 , Reference Vergnaud, Norat and Romaguera 31 ), it may be preferable in some settings to discuss fruits and vegetables separately. While fruits are most commonly eaten raw, vegetables may be consumed either raw or cooked. As seen in our data, intake patterns for fruits and vegetables differ in that they are consumed in different meals. Therefore, somewhat different approaches may be beneficial when promoting intakes of fruits and vegetables, respectively.
Various ways of defining meal types have been used in previous publications. For instance, meals have been defined based on the time of consumption( Reference Alexy, Freese and Kersting 32 ), the content of the meal( Reference Gregori, Foltran and Ghidina 33 ) or the respondents’ own definition( Reference Ovaskainen, Tapanainen and Pakkala 34 ). In the Norkost 3 study, meal types were based on the respondents’ own definition. In contrast to most other meal-related publications, we have included supper/evening meal as one of the main meals, since it is quite common to have supper/evening meal in Norway( Reference Bugge and Døving 3 , Reference Overby, Stea and Vik 5 ). A comparison of snacks and supper/evening meal showed that supper/evening meal differed from snacks in that fruit intake was significantly lower and whole grain intake significantly higher (data not shown). Hence, we found it more appropriate to treat supper/evening meal as a separate meal, rather than including supper/evening meal in snacks.
Strengths and limitations
Strengths of the Norkost 3 study include a fairly large sample size and detailed descriptions of the types and amounts of foods and beverages consumed at each specific meal. However, a main limitation of the study is the low participation rate of 37 %. Compared with the general population, participants were more likely to have a higher education; participation was also lower in the youngest age group. Because we see higher intakes of fruits and fish in the higher age groups, and higher intakes of fruits and vegetables in persons with a higher education, the low participation rate may have contributed to higher intake estimates of these food groups than what would have been found if the sample had been more representative. Consequently, the estimates presented herein may serve as a ‘best-case scenario’. Nevertheless, the observed meal habits are likely to be more representative, as largely the same patterns regarding meals as sources of fruits, vegetables, fish and whole grains were seen regardless of education and age, and between high and low consumers.
The Norkost 3 study provided dietary data from two recall days; therefore, we had to make the assumption that based on the two interviews, those having a high intake of fruits, vegetables, fish and whole grains were more likely to have a higher intake of these food items in general. This assumption is likely to weaken possible associations between background characteristics and dietary intake due to misclassification of a number of individuals.
Calculation of BMI for the present study was based on self-reported weight and height. As self-reported weight might be prone to under-reporting( Reference Scribani, Shelton and Chapel 35 , Reference Nyholm, Gullberg and Merlo 36 ), this might have led to an underestimation of the proportion of participants having a BMI over 25·0 kg/m2. However, as BMI was treated as a covariate in the analyses rather than a dependent variable, this limitation is likely to be less of a problem.
Practical implications
As pointed out by Holmback et al.( Reference Holmback, Ericson and Gullberg 1 ), FBDG may profit from the inclusion of meal-based recommendations. The findings from the present study provide insight into the meal habits of a group of Norwegian adults and may be useful when planning interventions to increase the intake of foods recommended in FBDG. Because dinner was the main source of fish and vegetables, increased intake of these food groups from other meals, preferably replacing energy-dense, nutrient-poor foods, would be beneficial. The intake of fish-based sandwich spreads should be encouraged, as only small amounts of fish were included in meals other than the dinner meal. Salads or the use of vegetables as sandwich topping would be ways of incorporating vegetables into the lunch meal. Fruits were primarily eaten as a part of snack meals, but vegetables may also be good candidates for snacks. However, because one consequence of increasing vegetable intake from snacks might be that vegetables replace fruit in the diet, the intake of both fruits and vegetables at all meals should be encouraged. In general, the inclusion of fruits, vegetables, fish and whole grains in more meal types is likely to increase total intake and decrease the vulnerability of intake to missing the main contributing meal.
Conclusion
The current study showed that intakes of fruits, vegetables, fish and whole grains are quite dependent on one main contributing meal type, although intake of whole grains was somewhat more evenly distributed across meals than the other food groups. The same main contributing meals were found in participants with high and low intakes of the food groups in question, in participants with a high and low education and across three age groups. Inclusion of these foods in other meals in addition to the main contributing meal, preferably replacing energy-dense nutrient-poor foods, should be promoted.
Acknowledgements
Acknowledgements: The authors are grateful to all participants in the Norkost 3 survey. They also wish to thank Øivind Skare who provided assistance with the statistical analyses. Financial support: This work was supported by the Research Council of Norway (grant number 199545). The Research Council of Norway had no role in the design, analysis or writing of this article. Conflict of interest: None. Authorship: L.F.A. and J.B.M. formulated the research questions. J.B.M. carried out the data analyses and drafted the first manuscript. E.B.L., M.W. and L.F.A. assisted and provided advice at all stages of the work. All authors have critically read and revised the article. Ethics of human subject participation: The study was conducted according to the guidelines laid down in the Declaration of Helsinki and all procedures involving human subjects were approved by the Regional Committee for Medical and Health Research Ethics.


