


Dyslipidaemia consists of different abnormalities in lipid profile and is one of the main risk factors for several diseases such as CVD, diabetes mellitus, hypertension, stroke and acute pancreatitis( Reference Reiner and Tedeschi-Reiner 1 ). The prevalence of dyslipidaemia depends on socio-economic status and ethnicity( Reference de Souza, Souto Filho and de Souza 2 ). It is increasing in most developed( Reference Wietlisbach, Paccaud and Rickenbach 3 ) and developing countries owing to unhealthy diets and lifestyle changes( Reference Yamada, Wong and Kodama 4 , Reference Hodge, Dowse and Toelupe 5 ). The main factors for dyslipidaemia are genetic, diet and lifestyle. According to previous studies, trans-fatty acids (TFA) play an important role in lipid profile disorders( Reference Ruixing, Qiming and Dezhai 6 ).
There are two sources of dietary TFA: (i) industrial TFA, which are produced technologically during the partial hydrogenation of vegetable oils; and (ii) ruminant TFA, such as vaccenic acid and conjugated linoleic acid (CLA) that are synthesized by rumen bacteria via the metabolism of MUFA and PUFA( Reference Rice, Kraft and Destaillats 7 – Reference Gebauer, Chardigny and Jakobsen 9 ). Clinical studies have reported that dietary intake of industrial TFA has a deleterious effect on lipoprotein concentrations; however, ruminant TFA may be less detrimental to blood lipid levels than industrial TFA( Reference Motard-Belanger, Charest and Grenier 10 ). Two isomers of CLA are cis-9, trans-11 (c9,t11) and trans-10, cis-12 (t10,c12)( Reference Risérus, Vessby and Arnlöv 11 – Reference Naumann, Carpentier and Saebo 17 ). The abundance of these isomers is different in foods and industrial supplements( Reference Risérus, Vessby and Arnlöv 11 – Reference Blankson, Stakkestad and Fagertun 13 , Reference Sluijs, Plantinga and de Roos 18 – Reference Laso, Brugué and Vidal 22 ).
CLA is produced naturally by the rumen bacteria of ruminants( Reference Berven, Bye and Hals 14 , Reference Kamphuis, Lejeune and Saris 19 , Reference Noone, Roche and Nugent 23 – Reference Desroches, Chouinard and Galibois 27 ) or by bioconversion of vaccenic acid in the ruminant mammary gland( Reference Brown, Trenkle and Beitz 26 , Reference Aminot-Gilchrist and Anderson 28 ). Moreover, it can even be produced synthetically by partial hydrogenation of linoleic acid( Reference Whigham, O’Shea and Mohede 20 , Reference Chen, Lin and Huang 25 ). The main dietary sources of CLA are ruminant meats such as beef and lamb, and dairy products such as milk and cheese( Reference Risérus, Vessby and Arnlöv 11 , Reference Berven, Bye and Hals 14 – Reference Petridou, Mougios and Sagredos 16 , Reference Kamphuis, Lejeune and Saris 19 , Reference Whigham, O’Shea and Mohede 20 , Reference Noone, Roche and Nugent 23 , Reference Sofi, Buccioni and Cesari 24 , Reference Colakoglu, Colakoglu and Taneli 29 ). The mean CLA intake is estimated at 0·3–2·6 g/d and daily intake of CLA through natural sources is 160 mg/d approximately( Reference Laso, Brugué and Vidal 22 , Reference Raff, Tholstrup and Basu 30 ).
Animal studies have shown that CLA might have various beneficial effects, e.g. prevention of carcinogenesis, decrease body fat, enhancement of lean body mass, empowering the immune system and prevention of diabetes and CVD( Reference Berven, Bye and Hals 14 , Reference Mougios, Matsakas and Petridou 15 , Reference Pfeuffer, Fielitz and Laue 21 , Reference Gaullier, Halse and Hoivik 31 – Reference Steck, Chalecki and Miller 33 ). However, the findings of human studies are controversial( Reference Naumann, Carpentier and Saebo 17 , Reference Chen, Lin and Huang 25 , Reference Brown, Trenkle and Beitz 26 , Reference Raff, Tholstrup and Basu 30 , Reference Wanders, Brouwer and Siebelink 34 ). These differences may be related to the different forms and doses of CLA, study populations and duration of trials( Reference Chen, Lin and Huang 25 ).
Some human studies have reported that CLA supplementation had no significant effect on plasma lipid concentrations( Reference Sluijs, Plantinga and de Roos 18 , Reference Pfeuffer, Fielitz and Laue 21 ); whereas another study found that CLA supplementation could significantly reduce total cholesterol (TC) and LDL cholesterol (LDL-C) in both genders and HDL cholesterol (HDL-C) only in women( Reference Lambert, Goedecke and Bluett 12 ). Moreover, there are inconsistent findings on foods enriched in CLA. Some studies have claimed that CLA-rich dairy products significantly increased TC and LDL-C and decreased HDL-C; however, they had no significant effect on TAG concentration( Reference Wanders, Brouwer and Siebelink 34 ). On the other hand, another study indicated that the consumption of skimmed milk enriched with CLA had no significant effect on plasma lipid variables such as TAG, TC, LDL-C and HDL-C levels( Reference Laso, Brugué and Vidal 22 ).
Studies on different forms of CLA, i.e. commercial natural products enriched in CLA or supplement forms, showed various findings; therefore it is necessary to summarize the controversial findings. The present study aimed to review the association of CLA consumption in two forms, foods enriched in CLA or CLA supplements, with serum lipid profile in human studies.
Methods
Literature search
The search was conducted in the following databases: PubMed, Cochrane Library, Google Scholar, Scopus and Science Direct, from 1 June to 23 November 2013. Keywords such as ‘trans-10 cis-12-conjugated linoleic acid’, ‘cis-9 trans-11-conjugated linoleic acid’, ‘CLA fatty acid’, ‘CLA’, ‘conjugated linoleic acid’, ‘trans fatty acid’, ‘TFA’, ‘Triglycerides’, ‘lipoprotein triglyceride’, ‘Lipoproteins, HDL’, ‘Cholesterol, HDL’, ‘Cholesterol, LDL’, ‘Lipoproteins, LDL’, ‘LDL’, ‘HDL’, ‘Total cholesterol’, ‘TG’, ‘triglyceride’, ‘triacylglycerol’, ‘TAG’, ‘lipid profile’, ‘low density lipoprotein’ and ‘high density lipoprotein’ were used. Keywords and medical subject heading (MeSH) terms are presented in Table 1. Age, gender and language were not limited during the search. Clinical trials that investigated the association of CLA intakes either in the form of supplements or enriched foods with lipid profile in healthy adults were included. Animal studies, studies on unhealthy individuals, study designs other than clinical trial, studies that investigated the effect of TFA other than CLA and studies that investigated outcomes other than lipid profile were excluded. Inappropriate forms of CLA, such as CLA plus n-3 fatty acid, CLA plus amino acid, CLA plus chromium picolinate, CLA plus creatine monohydrate or CLA plus exercise were excluded because these forms did not permit us to isolate the precise effect of CLA. Articles without complete data or placebo and articles on participants with metabolic and genetic disorders were excluded. Title and abstract of papers were screened and relevant papers were selected. Then, full texts of relevant papers were read and findings were re-screened. A flowchart of the literature search is shown in Fig. 1.
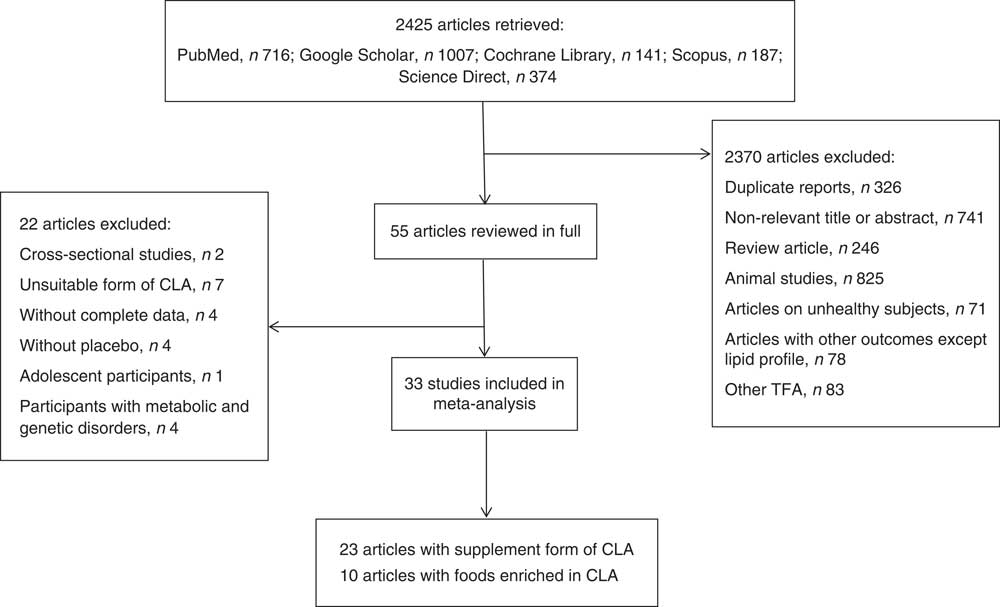
Fig. 1 Flowchart of the literature search
Table 1 Search strategy for PubMed, Cochrane Library, Google Scholar, Scopus and Science Direct databases

Relevant papers were selected according to the title and abstract by three authors (S.-M.D.-R. and M.H.-B., R.K.). Two independent reviewers (S.-M.D.-R. and M.H.-B.) screened papers and read full texts of relevant papers. They assessed full texts for inclusion criteria and extracted data. Statistical analysis was done (M.M.) and cases of disagreement were resolved in consultation with a fourth arbitrating investigator (R.K.). Summaries of the clinical trials that investigated the association of CLA supplementation and foods enriched in CLA with lipid profile in human studies are shown in Tables 2 and 3, respectively.
Table 2 Summary of clinical trials on the association of conjugated linoleic acid (CLA) supplementation and lipid profile in human studies
Table 3 Summary of clinical trials on the association of enriched foods with conjugated linoleic acid (CLA) and lipid profile in human studies

Data extraction
Data of thirty-three articles that investigated the effect of CLA intake in either supplement form or enriched foods on lipid profile in healthy adult populations were entered into meta-analysis. Mean and standard deviation for TC, HDL-C, LDL-C and TAG before and after placebo or CLA consumption were extracted. Data from the following studies were not extracted: four studies without complete data for analysis( Reference Tholstrup, Raff and Straarup 35 – Reference Engberink, Geleijnse and Wanders 38 ), four studies without a placebo group( Reference Gaullier, Halse and Høye 32 , Reference Sahin, Uyanik and Inanc 39 – Reference Tricon, Burdge and Kew 41 ), one study that considered special polymorphisms (PPARγ2, Pro12Ala) of healthy adults( Reference Rubin, Herrmann and Much 42 ), one study done on adolescents( Reference Bonet Serra, Quintanar Rioja and Viana Arribas 43 ) and participants of three studies had signs of metabolic syndrome or borderline hyperlipidaemia( Reference Venkatramanan, Joseph and Chouinard 44 – Reference Basu, Riserus and Turpeinen 46 ). Complete information about excluded studies is shown in Fig. 1.
Two structural forms of CLA, i.e. TAG and NEFA, and two isomeric forms, i.e. cis-9, trans-11 isomer (c9,t11) and trans-10, cis-12 isomer (t10,c12), were used as intervention groups( Reference Gaullier, Halse and Høye 47 , Reference Kim 48 ). There were different proportions (approximately 50:50 or 80:20; all proportions stated in the paper are by weight) of these isomers and we extracted results of all of them( Reference Naumann, Carpentier and Saebo 17 , Reference Noone, Roche and Nugent 23 ). Two studies reported their results stratified by gender or BMI( Reference Lambert, Goedecke and Bluett 12 , Reference Laso, Brugué and Vidal 22 ). We entered their results into meta-analysis separately.
Statistical analysis
All outcomes were recorded as continuous variables, and the effect size was measured by analysis of the mean and standard deviation before and after the intervention for the case and control groups. Pooled meta-analyses were completed on studies that reported the same outcomes. The I 2 statistic was used to test for heterogeneity; if there was significant heterogeneity, the random-effects model was used. I 2 values of 25 %, 50 % and 75 % were used as evidence of low, moderate and high heterogeneity, respectively. Sensitivity analysis was done by successively removing a particular study that had the highest impact on the heterogeneity test. Comprehensive Meta-Analysis (CMA) software version 2 was used to carry out the data analysis. P values <0·05 were considered statistically significant. All reported P values resulted from two-sided versions of the respective tests. Potential publication bias was evaluated by Egger’s regression test( Reference Egger, Davey Smith and Schneider 49 ). The trim and fill method was used to assess the potential effect of any publication bias on the meta-analysis results( Reference Duval and Tweedie 50 ).
Results
Conjugated linoleic acid supplementation and LDL cholesterol
The summary mean difference and 95 % confidence interval for all fifteen clinical trial studies that investigated the effects of CLA supplementation on LDL-C are shown in Fig. 2. Heterogeneity among studies was significant (I 2=52 %; P heterogeneity=0·040). The clinical trial studies( Reference Risérus, Vessby and Arnlöv 11 , Reference Blankson, Stakkestad and Fagertun 13 , Reference Sluijs, Plantinga and de Roos 18 , Reference Pfeuffer, Fielitz and Laue 21 , Reference Colakoglu, Colakoglu and Taneli 29 , Reference Watras, Buchholz and Close 51 – Reference Smedman and Vessby 53 ) contributed most to heterogeneity. In an analysis excluding these studies, CLA supplementation led to a significant decrease in LDL-C level (mean difference=−0·218; 95 % CI −0·358, −0·077; P=0·002); the test for heterogeneity was not statistically significant (I 2=0 %; P heterogeneity=0·934). Publication bias was not significant (Egger’s test P value=0·17).
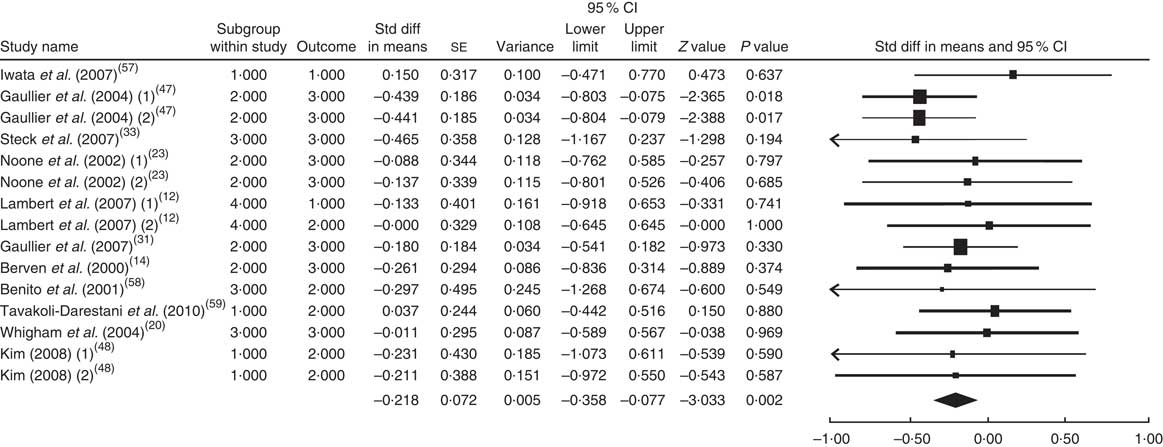
Fig. 2 Meta-analysis of the effect of conjugated linoleic acid supplementation on LDL cholesterol in published clinical trials. The study-specific standardized difference (Std diff) in means and 95 % CI are represented by the black square and horizontal line, respectively; the area of the black square is proportional to the specific-study weight to the overall meta-analysis. The centre of the black diamond presents the pooled standardized difference in means and its width represents the pooled 95 % CI
Conjugated linoleic acid supplementation and HDL cholesterol
The summary mean difference and 95 % confidence interval for all seventeen clinical trial studies that investigated the effects of CLA supplementation on HDL-C are shown in Fig. 3. Heterogeneity among studies was significant (I 2=50 %; P heterogeneity=0·030). The clinical trial studies( Reference Risérus, Vessby and Arnlöv 11 , Reference Blankson, Stakkestad and Fagertun 13 , Reference Sluijs, Plantinga and de Roos 18 , Reference Pfeuffer, Fielitz and Laue 21 , Reference Colakoglu, Colakoglu and Taneli 29 , Reference Watras, Buchholz and Close 51 – Reference Smedman and Vessby 53 ) contributed most to heterogeneity. In an analysis excluding these studies, CLA supplementation led to a slight and non-significant decrease in HDL-C level (mean difference=−0·051; 95 % CI −0·188, 0·086; P=0·468); the test for heterogeneity was not statistically significant (I 2=0 %; P heterogeneity=0·649). Publication bias was not significant (Egger’s test P value=0·94).
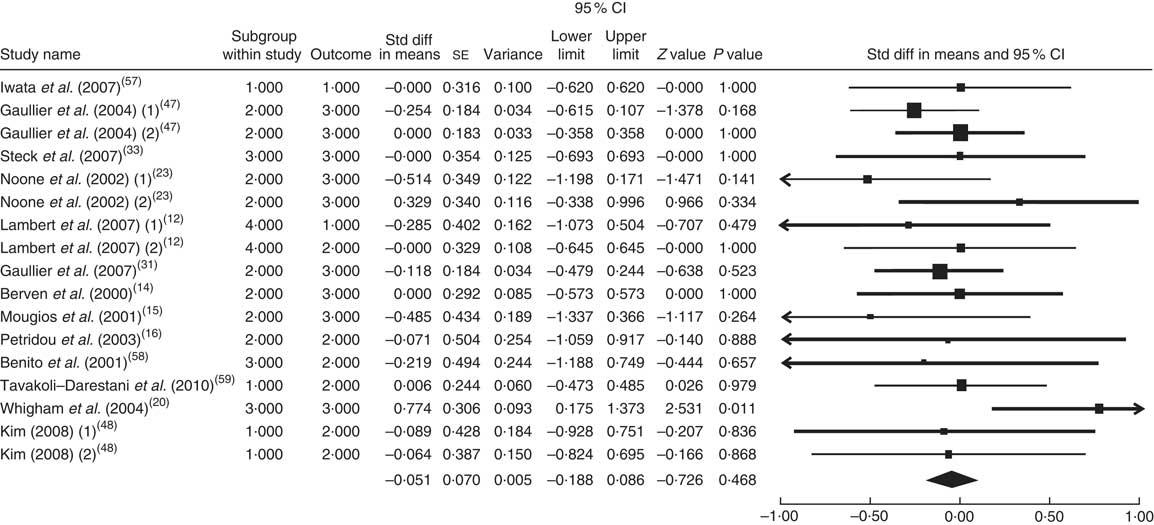
Fig. 3 Meta-analysis of the effect of conjugated linoleic acid supplementation on HDL cholesterol in published clinical trials. The study-specific standardized difference (Std diff) in means and 95 % CI are represented by the black square and horizontal line, respectively; the area of the black square is proportional to the specific-study weight to the overall meta-analysis. The centre of the black diamond presents the pooled standardized difference in means and its width represents the pooled 95 % CI
Conjugated linoleic acid supplementation and total cholesterol
The summary mean difference and 95 % confidence interval for all seventeen clinical trial studies that investigated the effects of CLA supplementation on TC are shown in Fig. 4. Heterogeneity among studies was significant (I 2=55 %; P heterogeneity=0·034). The clinical trial studies( Reference Risérus, Vessby and Arnlöv 11 , Reference Blankson, Stakkestad and Fagertun 13 , Reference Sluijs, Plantinga and de Roos 18 , Reference Pfeuffer, Fielitz and Laue 21 , Reference Colakoglu, Colakoglu and Taneli 29 , Reference Watras, Buchholz and Close 51 – Reference Song, Grant and Rotondo 54 ) contributed most to heterogeneity. In an analysis excluding these studies, CLA supplementation led to a slight and non-significant increase in TC level (mean difference=0·009; 95 % CI −0·128, 0·146; P=0·896); the test for heterogeneity was not statistically significant (I 2=0 %; P heterogeneity=0·956). Since publication bias existed, we tried to evaluate the effect of publication bias by the trim and fill method. After eliminating the effect of publication bias, the combined mean difference was 0·0089 (95 % CI −0·125, 0·152), which remained consistent with previous results.
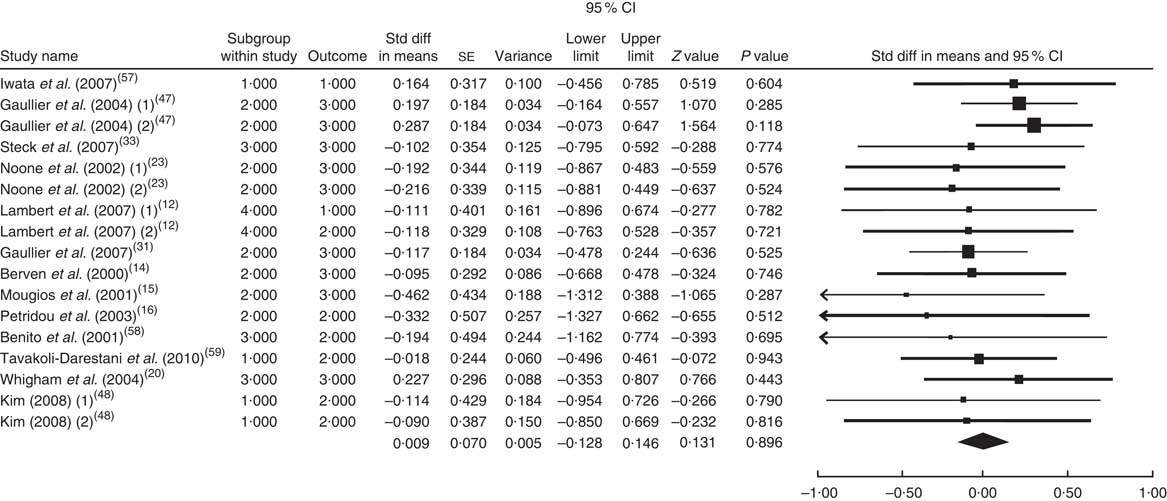
Fig. 4 Meta-analysis of the effect of conjugated linoleic acid supplementation on total cholesterol in published clinical trials. The study-specific standardized difference (Std diff) in means and 95 % CI are represented by the black square and horizontal line, respectively; the area of the black square is proportional to the specific-study weight to the overall meta-analysis. The centre of the black diamond presents the pooled standardized difference in means and its width represents the pooled 95 % CI
Conjugated linoleic acid supplementation and TAG
The summary mean difference and 95 % confidence interval for all eighteen clinical trial studies that investigated the effects of CLA supplementation on TAG are shown in Fig. 5. Heterogeneity among studies was significant (I 2=54 %; P heterogeneity=0·041). The clinical trial studies( Reference Risérus, Vessby and Arnlöv 11 , Reference Blankson, Stakkestad and Fagertun 13 , Reference Sluijs, Plantinga and de Roos 18 , Reference Pfeuffer, Fielitz and Laue 21 , Reference Colakoglu, Colakoglu and Taneli 29 , Reference Watras, Buchholz and Close 51 – Reference Smedman and Vessby 53 ) contributed most to heterogeneity. In an analysis excluding these studies, CLA supplementation led to a non-significant decrease in TAG level (mean difference=−0·065; 95 % CI −0·200, 0·070; P=0·344) and the test for heterogeneity was not statistically significant (I 2=0 %; P heterogeneity=0·954). Publication bias was not significant (Egger’s test P value=0·08).
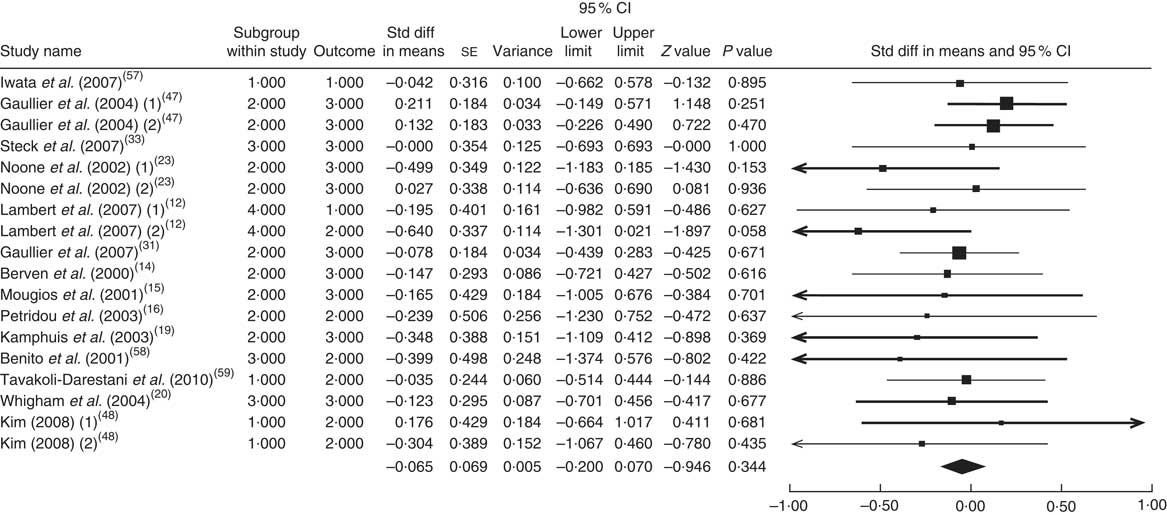
Fig. 5 Meta-analysis of the effect of conjugated linoleic acid supplementation on TAG in published clinical trials. The study-specific standardized difference (Std diff) in means and 95 % CI are represented by the black square and horizontal line, respectively; the area of the black square is proportional to the specific-study weight to the overall meta-analysis. The centre of the black diamond presents the pooled standardized difference in means and its width represents the pooled 95 % CI
Foods enriched in conjugated linoleic acid and LDL cholesterol
The summary mean difference and 95 % confidence interval for all ten clinical trial studies that investigated the effects of foods enriched in CLA on LDL-C are shown in Fig. 6. Heterogeneity among studies was significant (I 2=51 %; P heterogeneity=0·023). One clinical trial study( Reference Brown, Trenkle and Beitz 26 ) contributed most to heterogeneity. In an analysis excluding that study, we found that foods enriched in CLA led to a significant decrease in LDL-C level (mean difference=−0·231; 95 % CI −0·438, −0·024; P=0·028); the test for heterogeneity was not statistically significant (I 2=1 %; P heterogeneity=0·965). Publication bias was not significant (Egger’s test P value=0·18).
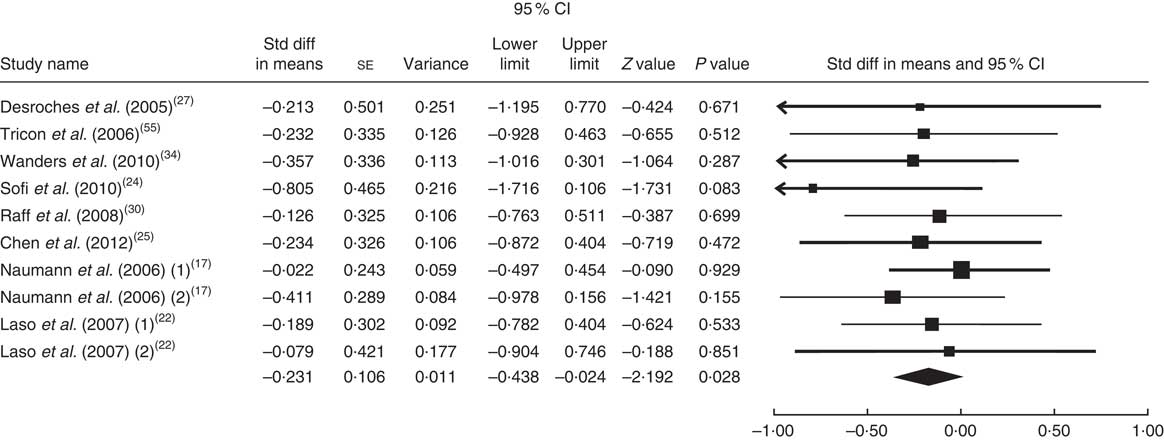
Fig. 6 Meta-analysis of the effect of natural foods enriched with conjugated linoleic acid on LDL cholesterol in published clinical trials. The study-specific standardized difference (Std diff) in means and 95 % CI are represented by the black square and horizontal line, respectively; the area of the black square is proportional to the specific-study weight to the overall meta-analysis. The centre of the black diamond presents the pooled standardized difference in means and its width represents the pooled 95 % CI
Foods enriched in conjugated linoleic acid and HDL cholesterol
The summary mean difference and 95 % confidence interval for all eleven clinical trial studies that investigated the effects of foods enriched in CLA on HDL-C are shown in Fig. 7. Heterogeneity among studies was significant (I 2=50 %; P heterogeneity=0·045). One clinical trial study( Reference Brown, Trenkle and Beitz 26 ) contributed most to heterogeneity. In an analysis excluding that study, foods enriched in CLA led to a non-significant increase in HDL-C level (mean difference=0·075; 95 % CI −0·121, 0·270; P=0·455) and the test for heterogeneity was not statistically significant (I 2=19 %; P heterogeneity=0·262). Publication bias was not significant (Egger’s test P value=0·07).
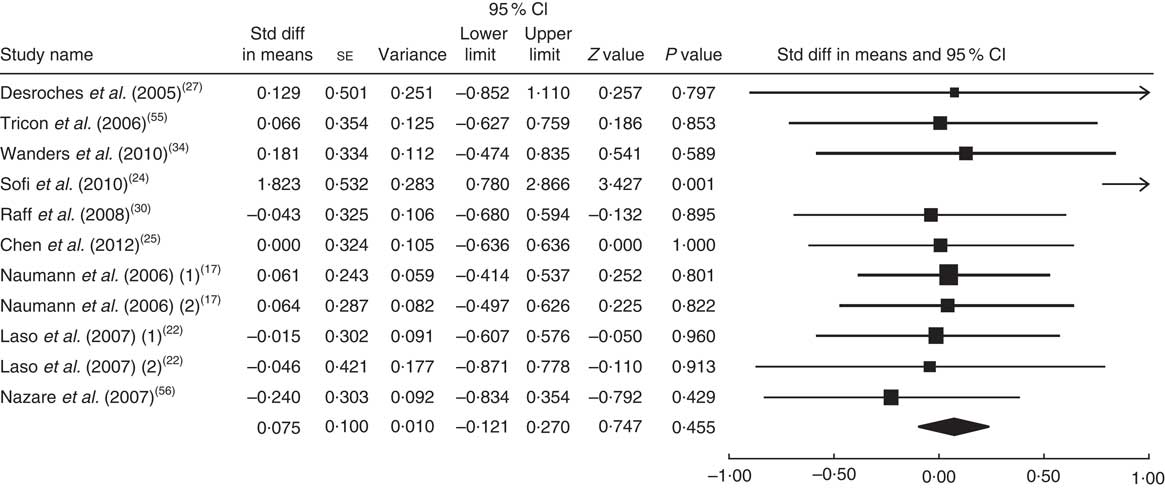
Fig. 7 Meta-analysis of the effect of natural foods enriched with conjugated linoleic acid on HDL cholesterol in published clinical trials. The study-specific standardized difference (Std diff) in means and 95 % CI are represented by the black square and horizontal line, respectively; the area of the black square is proportional to the specific-study weight to the overall meta-analysis. The centre of the black diamond presents the pooled standardized difference in means and its width represents the pooled 95 % CI
Foods enriched in conjugated linoleic acid and total cholesterol
The summary mean difference and 95 % confidence interval for all eleven clinical trial studies that investigated the effects of foods enriched in CLA on TC are shown in Fig. 8. Heterogeneity among studies was significant (I 2=58 %; P heterogeneity=0·018). One clinical trial study( Reference Brown, Trenkle and Beitz 26 ) contributed most to heterogeneity. In an analysis excluding that study, we found that foods enriched in CLA led to a non-significant decrease in TC level (mean difference=−0·158; 95 % CI −0·349, 0·042; P=0·124) and the test for heterogeneity was not statistically significant (I 2=10 %; P heterogeneity=0·345). Publication bias was not significant (Egger’s test P value=0·84).
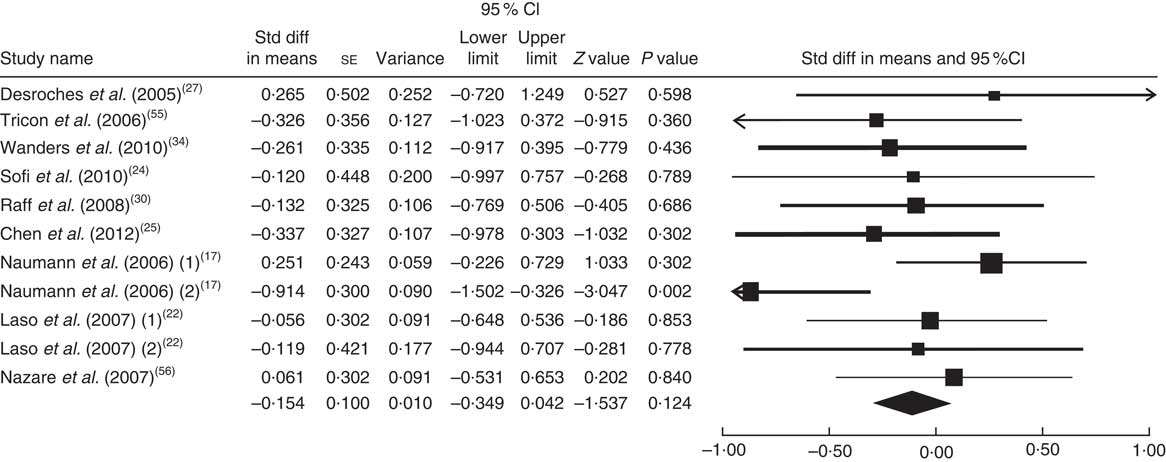
Fig. 8 Meta-analysis of the effect of natural foods enriched with conjugated linoleic acid on total cholesterol in published clinical trials. The study-specific standardized difference (Std diff) in means and 95 % CI are represented by the black square and horizontal line, respectively; the area of the black square is proportional to the specific-study weight to the overall meta-analysis. The centre of the black diamond presents the pooled standardized difference in means and its width represents the pooled 95 % CI
Foods enriched in conjugated linoleic acid and TAG
The summary mean difference and 95 % confidence interval for all eleven clinical trial studies that investigated the effects of foods enriched in CLA on TAG are shown in Fig. 9. Heterogeneity among studies was significant (I 2=56 %; P heterogeneity=0·033). One clinical trial study( Reference Brown, Trenkle and Beitz 26 ) contributed most to heterogeneity. In an analysis excluding that study, we documented that foods enriched in CLA led to a non-significant decrease in TAG level (mean difference=−0·078; 95 % CI −0·274, 0·117; P=0·433); the test for heterogeneity was not statistically significant (I 2=6 %; P heterogeneity=0·384). Publication bias was not significant (Egger’s test P value=0·71).
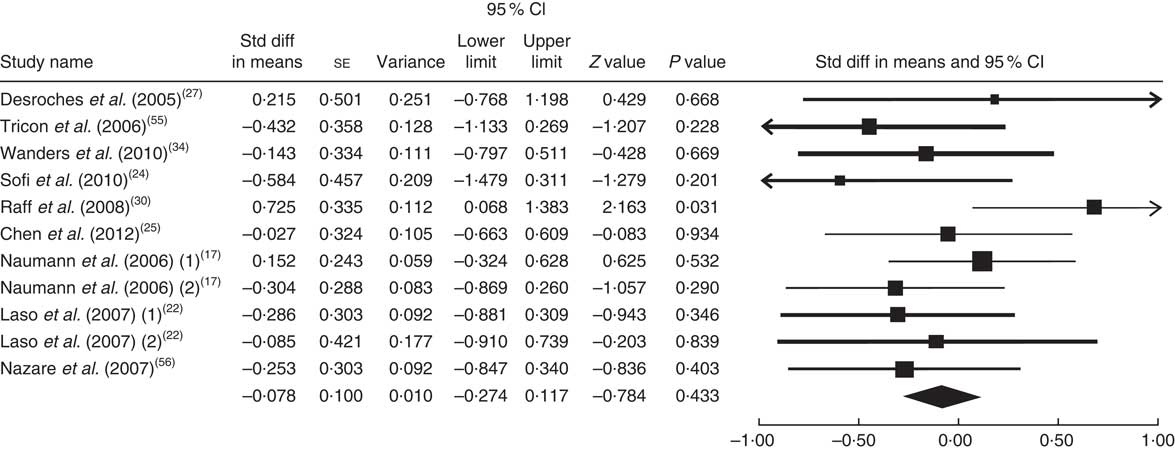
Fig. 9 Meta-analysis of the effect of natural foods enriched with conjugated linoleic acid on TAG in published clinical trials. The study-specific standardized difference (Std diff) in means and 95 % CI are represented by the black square and horizontal line, respectively; the area of the black square is proportional to the specific-study weight to the overall meta-analysis. The centre of the black diamond presents the pooled standardized difference in means and its width represents the pooled 95 % CI
Sensitivity analyses
To identify the source of the heterogeneity between studies, we performed sensitivity analyses by including and excluding some studies. Sensitivity analyses were done sequentially for all of the lipids and all of the studies. In a sensitivity analysis excluding one study at a time, we consistently found statistically the same results. Ranges of summary mean differences were (−0·242, −0·178), (−0·097, −0·016), (0·001, 0·017) and (−0·110, −0·040) for the effect of CLA supplementation on LDL-C, HDL-C, TC and TAG, respectively. Also the sensitivity analysis results based on the effect of enriched foods with CLA for different lipids according to summary mean differences were (−0·280, −0·200), (−0·082, −0·641), (−0·460, −0·222) and (−0·156, −0·047) for LDL-C, HDL-C, TC and TAG, respectively.
Discussion
The present meta-analysis is the first quantitative review of thirty-three randomized controlled clinical studies investigating the effect of CLA supplements and foods enriched in CLA on serum lipids separately. Our meta-analysis showed that intake of foods enriched in CLA decreased LDL-C levels significantly, decreased TC and TAG concentrations non-significantly and increased HDL-C levels non-significantly. CLA supplements decreased LDL-C, HDL-C and TAG levels and increased TC level; however, only the effect on LDL-C level was statistically significant. According to our analysis, consumption of foods enriched in CLA and CLA supplements has favourable effects on LDL-C level.
Some studies, in agreement with our results, showed that a mixture of CLA isomers decreased LDL-C level significantly in healthy adults( Reference Lambert, Goedecke and Bluett 12 , Reference Wanders, Brouwer and Siebelink 34 , Reference Sahin, Uyanik and Inanc 39 , Reference Tricon, Burdge and Kew 41 ). Noone et al.( Reference Noone, Roche and Nugent 23 ) observed that the daily intake of 3 g CLA supplement (50:50 and 80:20) decreased LDL-C levels non-significantly in CLA groups. However, von Loeffelholz( Reference von Loeffelholz, Kratzsch and Jahreis 40 ) claimed that CLA supplementation for 6 months increased LDL-C and TC concentrations significantly. Some studies showed that CLA supplementation( Reference Gaullier, Halse and Høye 47 , Reference Smedman and Vessby 53 ) or foods enriched in CLA( Reference Laso, Brugué and Vidal 22 , Reference Chen, Lin and Huang 25 ) led to a slight, non-significant increase in LDL-C level.
We found that TC level decreased and HDL-C level increased non-significantly after intake of foods enriched in CLA and our findings are in accordance with other studies( Reference Naumann, Carpentier and Saebo 17 , Reference Laso, Brugué and Vidal 22 , Reference Desroches, Chouinard and Galibois 27 ). According to our meta-analysis, CLA supplementation led to an adverse non-significant effect on TC or HDL-C level, which is in agreement with some studies on CLA supplements( Reference Lambert, Goedecke and Bluett 12 , Reference Mougios, Matsakas and Petridou 15 , Reference Gaullier, Halse and Hoivik 31 , Reference Steck, Chalecki and Miller 33 , Reference Tholstrup, Raff and Straarup 35 , Reference von Loeffelholz, Kratzsch and Jahreis 40 , Reference Gaullier, Halse and Høye 47 , Reference Smedman and Vessby 53 , Reference Song, Grant and Rotondo 54 ) and is in disagreement with other studies( Reference Pfeuffer, Fielitz and Laue 21 , Reference Sahin, Uyanik and Inanc 39 , Reference Tricon, Burdge and Kew 41 ).
Our analysis showed that TAG level decreased non-significantly after intake of either CLA supplements or CLA-enriched foods, similar to previous studies on either enriched foods or CLA supplements. Some findings suggested that CLA had no significant effect on TAG concentration( Reference Risérus, Vessby and Arnlöv 11 – Reference Kamphuis, Lejeune and Saris 19 , Reference Pfeuffer, Fielitz and Laue 21 , Reference Laso, Brugué and Vidal 22 , Reference Sofi, Buccioni and Cesari 24 – Reference Desroches, Chouinard and Galibois 27 , Reference Colakoglu, Colakoglu and Taneli 29 – Reference Wanders, Brouwer and Siebelink 34 , Reference Albers, Van der Wielen and Brink 36 , Reference von Loeffelholz, Kratzsch and Jahreis 40 , Reference Gaullier, Halse and Høye 47 – Reference Smedman and Vessby 53 , Reference Tricon, Burdge and Jones 55 – Reference Tavakoli-Darestani, Hosseinpanah and Hedayati 59 ). However, Chen et al.( Reference Chen, Lin and Huang 25 ) reported that TAG level increased in individuals who consumed foods enriched in CLA. Some trials reported a significant increase in TAG concentration after consuming CLA supplements( Reference Whigham, O’Shea and Mohede 20 , Reference Tholstrup, Raff and Straarup 35 , Reference Tricon, Burdge and Kew 41 , Reference Song, Grant and Rotondo 54 ).
The proportion of CLA isomers and their dosage may be important to determine the effect of CLA on lipid profile. Noone et al.( Reference Noone, Roche and Nugent 23 ) showed that CLA supplementation with the 50:50 proportions of cis-9, trans-11 and trans-10, cis-12 isomers caused a significant reduction in plasma TAG concentrations; however, this effect disappeared with the 80:20 proportion of CLA isomers. Mougios et al.( Reference Mougios, Matsakas and Petridou 15 ) investigated the effect of CLA capsules that included 0·7–1·4 g CLA mixture for 4–8 weeks. They showed that low-dose CLA intake decreased TAG and TC and high CLA intake did not change TAG and TC levels.
Findings from human studies that investigated the effects of CLA mixtures or cis-9, trans-11 and trans-10, cis-12 CLA isomers separately on lipid profile in either enriched foods or supplement forms are controversial. This may be related to differences in the CLA forms (TAG or NEFA), doses of CLA (0·59–6·8 g in supplement forms and 1·17–73·7 g in enriched foods), variation in isomers and their proportions, duration of studies (from 4 weeks to 2 years in supplement forms and from 5 weeks to 5 months in enriched foods), variation in subjects’ body weight and different control groups. As placebo, most of the studies used olive oil or oleic acid extracts; some of them used safflower oil, sunflower oil or linoleic acid extracts; and a few studies used soyabean oil solely or in combination with palm oil. Studies enriched different kinds of dairy products such as cheese, milk, yoghurt, butter and ice cream with CLA. Furthermore, the CLA content of milk and other dairy products ranged from 0·34 % to 1·07 % of total fat, which is influenced by the diet of cows. In European countries, where cows are traditionally pasture grazed, their milk contains higher CLA levels than in countries where cows are mainly fed corn, such as the USA. These can lead to different results in studies( Reference Smit, Baylin and Campos 60 ).
The mechanism of lowering cholesterol level by CLA remains to be determined( Reference Aminot-Gilchrist and Anderson 28 ). It was suggested that CLA could decrease LDL-C particles by forbidding the secretion of apo B or by increasing the clearance rate of circulating LDL-C through increasing activity of the LDL receptor( Reference Grundy and Denke 61 , Reference Yotsumoto, Hara and Naka 62 ). According to evidence, dietary CLA enhances the fecal excretion of total neutral sterols( Reference Yeung, Yang and Huang 63 ) and inhibits cholesterol absorption through down-regulation of intestinal acyl-CoA cholesterol acyltransferase( Reference Aminot-Gilchrist and Anderson 28 ). CLA can decrease TAG level by inhibiting the expression and activity of hepatic stearoyl-CoA desaturase. This enzyme is involved in the desaturation of substrate for the synthesis of TAG( Reference Pariza, Park and Cook 64 ).
According to our meta-analysis, foods enriched in CLA and CLA supplements have beneficial effect on LDL-C concentration. CLA did not affect other lipids in the profile. Foods enriched in CLA increased HDL-C and tended to decrease TC non-significantly. Nutrients such as calcium, potassium, vitamin D and vitamin B, or bioactive peptides in dairy products, have been shown to be associated with beneficial outcomes. These nutrients and CLA can influence the lipid profile synergistically( Reference Smit, Baylin and Campos 60 ).
There are some concerns about the potential safety of CLA for human subjects. Studies have shown that supplementation with CLA or trans-10, cis-12 isomer could induce insulin resistance, lipodystrophy in animals, fatty liver, C-reactive protein enhancement and undesirable changes in lipid profile in man( Reference Gudbrandsen, Rodriguez and Wergedahl 65 , Reference Vyas, Kadegowda and Erdman 66 ).
There is no consensus on the recommended dosage of CLA; however, according to evidence, 3 g/d seems to be most desirable. Consumption of CLA supplements is not recommended in pregnancy( Reference Kelly 67 , Reference Oleszczuk, Oleszczuk and Kwiecińska 68 ).
Conclusion
The present review showed that both CLA supplements and foods enriched in CLA caused a significant reduction in LDL-C level. Foods enriched in CLA, in comparison with CLA supplementation, had a beneficial effect on the whole lipid profile although only the effect on LDL-C level was statistically significant.
Acknowledgements
Financial support: This research received no specific grant from any funding agency in the public, private or not-for-profit sectors. Conflict of interest: None. Authorship: Relevant papers were selected according to the title and abstract by three authors (S.-M.D.-R., M.H.-B. and R.K.). Two independent reviewers (S.-M.D.-R. and M.H.-B.) screened papers and read the full text of relevant papers. They assessed full texts for inclusion criteria and extracted data. Statistical analysis was done (M.M.) and cases of disagreement were resolved in consultation with a fourth arbitrating investigator (R.K.). Ethics of human subject participation: Ethical approval was not required.


