


Family meals are an important family practice associated with positive health outcomes among children and adolescents( Reference Fiese and Schwartz 1 ), but few studies have examined the epidemiology of family meals among adults. For children and adolescents, a higher frequency of family meals is associated with healthier diets( Reference Burgess-Champoux, Larson and Neumark-Sztainer 2 – Reference Hammons and Fiese 4 ) and a lower likelihood of reporting disordered eating behaviours( Reference Neumark-Sztainer, Wall and Story 5 ), substance use( Reference Neumark-Sztainer, Larson and Fulkerson 6 ) and depressive symptoms( Reference Musick and Meier 7 ). Family meals may help to prevent obesity in children and adolescents( Reference Valdes, Rodriguez-Artalejo and Aguilar 8 ) and some researchers have found an inverse association between family meal frequency and BMI among parents( Reference Sobal and Hanson 9 – Reference Chan and Sobal 11 ). Fruit and vegetable consumption may also be higher among parents who eat family meals more often( Reference Berge, MacLehose and Loth 12 ). Studies of family meals have predominantly relied on data collected from samples of children or adolescents and their parents. An exception is a study of commensal eating patterns that included adults living in one community and found that approximately two-thirds ate dinner with family members, but the authors did not examine if the presence of children affected this pattern( Reference Sobal and Nelson 13 ). Little is known about the epidemiology of family meals in families without minor children. Such families include married couples who do not have children and those couples whose children have grown and no longer live at home. In 2010, more than half of the husband–wife family households in the USA did not include children( Reference Lofquist, Lugaila and O’Connel 14 ).
Whether the frequency of family meals among adults who do and do not live with minor children differs relative to sociodemographic characteristics is unclear. Studies have consistently demonstrated that individuals’ health status( Reference Schiller, Lucas and Peregoy 15 , Reference Phelan and Link 16 ) and their health-related behaviours( Reference Hiza, Casavale and Guenther 17 – Reference Hamrick, Andrews and Guthrie 19 ) are associated with sociodemographic factors, and the amount of time adults allocate to other health and family-related activities depends on family composition. Parents with minor children tend to engage in less physical activity( Reference Bellows-Riecken and Rhodes 20 ) and devote more time to housework and child care( Reference Sayer, England and Bittman 21 ) than their counterparts who do not live with children. With this shift in time allocation to housework and their families, adults who live with minor children may be more likely to regularly eat family meals at home than adults who do not.
Currently one study provides limited data about the potential effect of having minor children in the household and sociodemographic characteristics on family meal frequency. Sobal and Hanson examined the frequency and demographic predictors of family meals among 882 adults in the USA responding to a 2009 random-digit-dial telephone survey( Reference Sobal and Hanson 9 ). They found that controlling for other demographic characteristics, the presence of minor children (under age 18 years) in the household was not associated with family meal frequency. Sobal and Hanson acknowledged the limitations of their study for examining differences in the frequency of family meals by demographic characteristics, such as the inability to perform stratified analysis due to the small sample size, and called for future research among a large and diverse sample of US adults( Reference Sobal and Hanson 9 ).
Our objectives in the present study were to investigate the epidemiology of family meals in a large representative survey of Ohio adults. We describe the prevalence of family meals eaten at home among adults whose families did and did not include minor children overall and in relation to sociodemographic characteristics. We hypothesized that adults living with minor children would eat family meals more regularly than adults who did not live with minor children.
Methods
The 2012 Ohio Medicaid Assessment Survey (OMAS) is a cross-sectional, dual-frame telephone survey of the health behaviours, health status and demographic characteristics of Ohio’s non-institutionalized population( 22 ). From late May to early October of 2012, trained interviewers surveyed 22929 adults (aged 19 years and older) who had been living in Ohio for at least one month( 22 , 23 ). The sampling procedures were based on a complex, multistage design and included an oversample of African Americans and households with children. Both landline and cell phones were included. For the landline sample, an adult in the household was randomly selected using the most recent birthday method( Reference Groves, Fowler and Couper 24 ), while for the cell phone sample, the individual who answered the phone was interviewed if they were 19 years or older( 22 ). A pilot test of the questionnaire was conducted in April and necessary revisions to skip patterns and question wording were incorporated prior to the full fielding( 25 ). Survey weights accounting for respondents’ unequal probability of selection were applied and analyses support valid inference about the characteristics of Ohio’s adult population. We analysed the publically available, de-identified version of the 2012 OMAS data set( 26 ).
Analytic sample
Our analyses included adults who lived with one or more family member. Respondents reported both the total number of people living in their household and the number of those in the household who were family members (i.e. related to the respondent by birth, marriage, adoption or legal guardianship). Family members living elsewhere, such as grown children, were not included in this measure of family size.
Adults who did not live with any family members were not asked about family meals and were excluded from our analyses (7788 of the 22929 OMAS respondents). Of the 15141 adult respondents who lived with at least one family member, 14453 (95 %) had complete information on the number of people in their family and family meal frequency. We excluded an additional 396 respondents who were missing data on sociodemographic measures. Thus, our final analytic sample consisted of 14057 respondents.
Measures
Presence of minor children
We classified adults as living with minor children if their family included at least one child aged 18 years or younger who lived in the home. We defined adults living without minor children as those who lived with one or more adult family member and did not live with children <19 years old.
Family meal frequency
Frequency of family meals was assessed based on response to the following question( 27 ): ‘These next questions are about the meals you ate together with your family at home in the past week. During the past week, on how many days did you and your family eat at least one meal together at your home or residence?’ The interviewer emphasized the bolded words when asking the question and the response options ranged from 0 to 7d. The OMAS did not include any measure of family meals eaten away from home. We describe the prevalence of family meals among adults living with and without minor children relative to this eight-level variable (i.e. 0–7d in the past week). To present associations with sociodemographic characteristics, we categorized individuals as reporting family meals on 0–2d, 3–5d or 6–7d in the past week. We chose these categories a priori as approximations for family meals occurring on few, some or most days of the week.
Sociodemographic characteristics
We constructed categorical measures from data on respondents’ self-reported gender, age, race, ethnicity, educational attainment, marital status and employment status. Age was reported in years or respondents selected one of six age categories: 19–24 years, 25–34 years, 35–44 years, 45–54 years, 55–64 years and ≥65 years. We combined these categories in some analyses as: 19–34 years, 35–54 years and ≥55 years. To assess educational attainment, respondents were asked to report the highest level of school they had completed or the highest degree they had received. This question had eight response categories, from which we constructed a five-level measure: less than high school, high-school graduate or equivalent, some college (including associate’s or technical degree), 4-year college graduate or bachelor’s degree, and advanced degree. We categorized marital status as currently married or not. Respondents reported whether they worked (full- or part-time) or whether they were not currently employed.
The measurement of respondents’ race and ethnicity in the OMAS was consistent with the Office of Management and Budget’s 2003 revised Standards for the Classification of Federal Data on Race and Ethnicity( 28 ). Respondents self-reported whether they were of Hispanic or Latino origin and then identified which one or more of five listed races best described their race. We classified respondents as Hispanic (any race), non-Hispanic white, non-Hispanic black or African American, and all other races, including those who indicated multiple races (non-Hispanic).
Analysis
The goal of our analysis was descriptive. We described the overall distribution of family meal frequency among adults living with and without minor children and the prevalence of family meals occurring few, some or most days per week within each of these adult populations stratified by sociodemographic characteristics. Our analyses accounted for the complex survey design and we present weighted percentages and 95 % confidence intervals. For each sociodemographic stratum we also present a P value for the difference in family meal frequency between adults living and not living with minor children. To estimate these P values, we fit an ordinal logistic model predicting the three-level family meal frequency measure from living with minor children, the sociodemographic characteristic and their interaction and performed a two-way Wald test. This test evaluated whether or not the pattern of family meal frequency across each sociodemographic characteristic statistically differed among those who were or were not living with minor children. A P value <0·05 indicates that the pattern of family meal frequency observed among those living with and without minor children is different and that this difference is unlikely to be due to chance. All of our analyses were conducted in the statistical software package STATA 13·0.
Results
Our sample contained 5766 Ohio adults living with minor children and 8291 Ohio adults not living alone or with minor children. Sociodemographic characteristics were distributed differently between adults living with minor children and adults not living with minor children. As would be expected, adults living with minor children tended to be younger (Table 1). Adults living with minor children were also more likely to be currently employed (69 % v. 51 %) and were somewhat more likely to be female (55 % v. 50 %), of minority race/ethnicity (18 % v. 13 %) or not currently married (37 % v. 31 %). Although the difference was significant due to the large sample size, visual inspection suggested that the educational attainment of these two groups was similar (Table 1).
Table 1 Sociodemographic characteristics of adults in Ohio who did and did not live with minor children; 2012 Ohio Medicaid Assessment Survey (OMAS)

Column percentages may not sum to 100 % due to rounding.
* P<0·05 for the difference in the distribution of the weighted percentages of each sociodemographic characteristic between adults living and not living with minor children.
† Percentages are weighted using sampling weights and indicate the percentage of adults in Ohio with each sociodemographic characteristic. Unweighted n provides the number of adults in the sample.
The distribution of family meal frequency for adults not living with minor children mirrored that of adults who were living with minor children (Fig. 1). About half of Ohio adults ate a meal together with their family most (6–7) days of the week (Table 2), and this practice of regular family meals was slightly less prevalent among those living with minor children (47 % v. 51 %). Few in either group reported zero family meals during the past week (5 % and 7 % for those living with and without minor children, respectively). In this large study, the P value for the difference in family meal frequency among adults living and not living with minor children was statistically significant at 0·032 (Table 2).
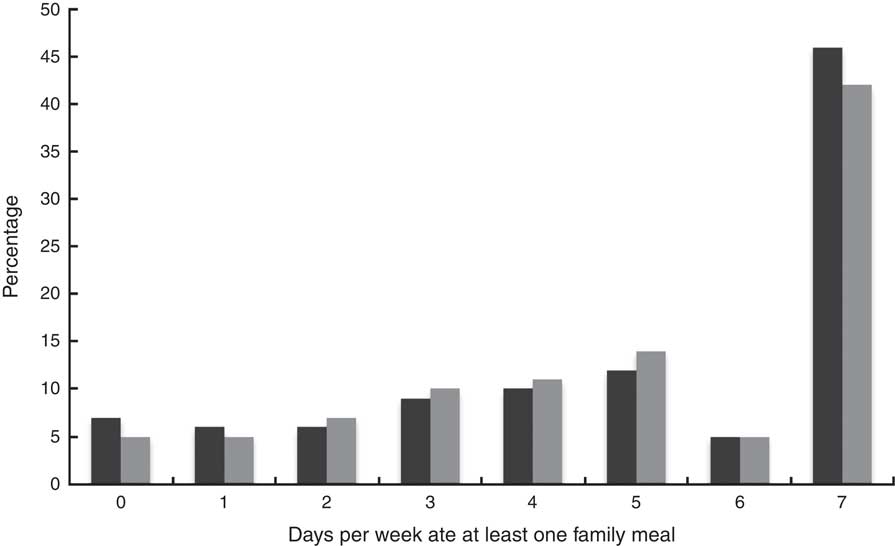
Fig. 1 The distribution of family meal frequency among adults in Ohio who did (![]() ) and did not live with minor children (
) and did not live with minor children (![]() ); 2012 Ohio Medicaid Assessment Survey (OMAS)
); 2012 Ohio Medicaid Assessment Survey (OMAS)
Table 2 Estimated prevalence of family meals eaten at home on few (0–2), some (3–5) or most (6–7) days of the week among adults in Ohio who did and did not live with minor children, stratified by adults’ sociodemographic characteristics; 2012 Ohio Medicaid Assessment Survey (OMAS)

Analyses use sampling weights and are representative of Ohio’s adult population· Row percentages may not sum to 100 % due to rounding.
*P value for the significance of the interaction between each sociodemographic characteristic and living with minor children on family meal prevalence.
To explore variation by sociodemographic characteristics, the prevalence of family meals eaten at home few, some and most days of the week among adults living with and without minor children is presented in Table 2 within strata of gender, employment status, race/ethnicity, educational attainment, marital status and age group. With the exception of gender, statistical testing indicated an effect of minor children on the frequency of family meals within strata of sociodemographic characteristics (Table 2). However, relatively minor differences in the distribution of family meals were statistically significant given the sample size. For example, the significance testing indicated that the effect of employment status on family meal frequency was different for adults living and not living with minor children (P=0·003 for test of an interaction between employment and living with minor children). However, a visual comparison of the two groups suggested they had similar distributions of family meal frequency by employment status. Similarly for race/ethnicity, educational attainment and marital status, small differences in the distribution of family meal frequency between adults living and not living with minor children resulted in statistically significant tests of interaction.
Age differed from the other sociodemographic characteristics in that the effect of living with minor children on family meal frequency was evident both through statistical testing and visual comparison (Table 2). Among adults not living with minor children, the percentage of older adults (≥55 years) who ate family meals most days was more than double the percentage of young adults (19–34 years) who did so (62 % v. 28 %), but age was not related to family meal frequency for those with minor children in the family (Table 2). We further explored these associations in post hoc analyses to determine the extent to which these patterns were an artifact of how we had combined the age groups. Figure 2 shows an increasing prevalence of regular family meals across six age groups for adults not living with minor children, while the prevalence of family meals 6–7d/week among adults living with minor children was relatively constant and did not trend upwards with age.
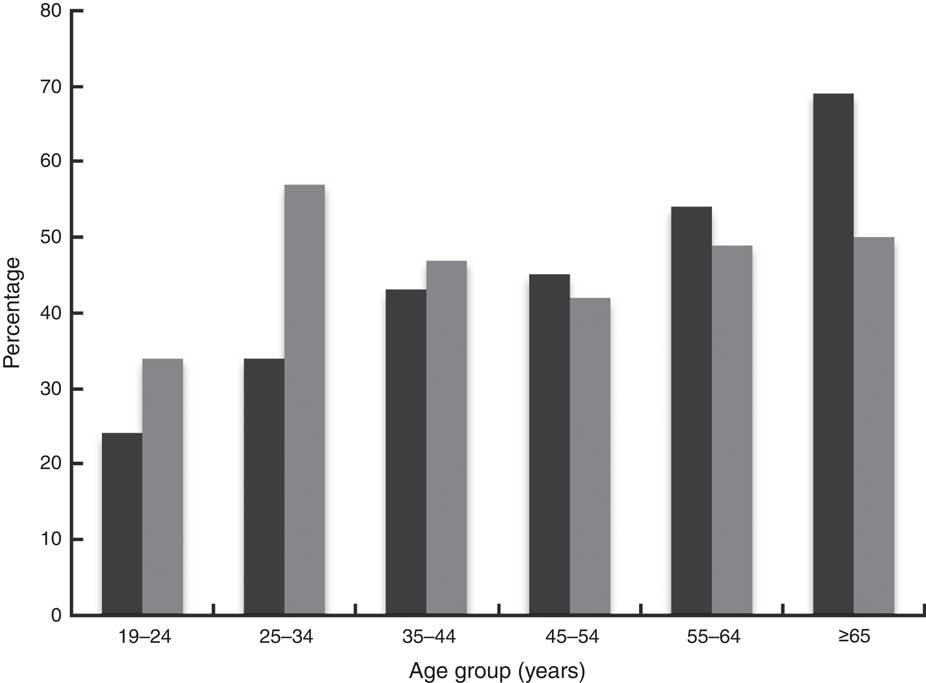
Fig. 2 Estimated prevalence of eating family meals at home most (6–7) days of the week among adults in Ohio who did (![]() ) and did not live with minor children (
) and did not live with minor children (![]() ), stratified by adults’ age; 2012 Ohio Medicaid Assessment Survey (OMAS)
), stratified by adults’ age; 2012 Ohio Medicaid Assessment Survey (OMAS)
With the exception of age group just discussed, adults with and without minor children experienced comparable patterns of family meal frequency within strata of sociodemographic characteristics. The frequency of family meals was similar for men and women, and across levels of educational attainment in both groups (Table 2). There was greater variation in the percentage of adults eating family meals most days within strata of employment, race/ethnicity and marital status for both those living with and without children; family meals were less frequent among adults who were employed, of non-Hispanic black race/ethnicity or not currently married (Table 2).
Given this variation in family meal frequency relative to sociodemographic characteristics and differences in the sociodemographic composition of the two groups (Table 1), we explored the extent to which adjusting for these potentially confounding sociodemographic differences impacted the association between family meal frequency and living with minor children. We fit an ordinal logistic regression model to predict what the frequency of family meals would be among adults living with minor children if they had the same sociodemographic characteristics as those not living with children. We found that an estimated 13 %, 31 % and 56 % of adults who live with minor children would be predicted to eat family meals few, some and most days per week, respectively. Thus, adjusting for sociodemographic characteristics, the percentage of Ohio adults living with minor children predicted to eat family meals most days of the week was higher than the unadjusted prevalence of 47 %.
Discussion
Our study provides population-level prevalence estimates of family meal frequency among adults residing in Ohio who do and do not live with minor children. Little information about family meal patterns among adults, particularly those not living with children, has been previously reported. Our results demonstrate that most adults regularly eat family meals and relatively few adults never share a meal with their families at home. Furthermore, we find little evidence that the presence of minor children in the family produces unique patterns of family meal frequency within sociodemographically defined strata. These findings build on a literature base that has predominantly examined family meal patterns among children and their parents, and highlight the importance of studying adult populations.
In contrast to our hypothesis, we did not find strong evidence that living with minor children affects the overall distribution of family meal frequency. Public health recommendations currently target families with children by emphasizing how family mealtimes can foster happier and healthier children( Reference Cook and Dunifon 29 ). Adults living in families with minor children might have therefore placed greater value on family meals and eaten together more often. However, we found similar family meal patterns among adults living and not living with minor children. In exploratory analyses adjusted for sociodemographic characteristics, we found the difference between the predicted and observed percentages remained relatively small, further suggesting that living with minor children may not have a large impact on whether or not adults eat family meals. Sobal and Hanson also did not find an effect of having minor children in the household on family meal frequency after adjusting for other demographics in their study of family meals among 882 US adults( Reference Sobal and Hanson 9 ).
When stratified by age group, we did observe distinct patterns of family meal frequency among adults whose families did and did not include minor children. Age- and cohort-related differences in time availability and norms of shared meals may account for the linear increase in family meal frequency among adults who did not live with minor children. Older adults may eat family meals more often than younger adults because they are less likely to be employed and may therefore have more time available to prepare and eat family meals. It is also possible that cohort differences in expectations and priorities are evident when we examine family meal frequency among adults without children in the household. Many young adults report time constraints for preparing and eating meals( Reference Larson, Nelson and Neumark-Sztainer 30 , Reference Pelletier and Laska 31 ), whereas among older adults, family mealtime experiences from earlier in their lives may influence current behaviour( Reference Wethington and Johnson-Askew 32 , Reference Pucciarelli and Thomas 33 ). It is unclear how living with minor children affects these or other aspects of the family dynamic to produce the more stable frequency of family meals across age groups we observed. However, only 9 % of adults living with minor children were 55 years of age or older and these individuals likely differ in many ways from older adults who do not live with minor children.
The prevalence of family meals varied by race/ethnicity, marital status and employment status, but in similar ways among adults living and not living with minor children. Our analyses indicated that it was less common for non-Hispanic black adults in Ohio to eat family meals on most days of the week than non-Hispanic white or Hispanic adults. This pattern is consistent with studies of racial/ethnic disparities in food-related behaviours( Reference Tashiro 34 ) and diet quality among adults( Reference Hiza, Casavale and Guenther 17 , Reference Beydoun and Wang 35 ) and with the lower reported prevalence of family meals among African-American adolescents compared with white adolescents( Reference Neumark-Sztainer, Wall and Fulkerson 36 ). Sobal and Hanson did not observe differences in family meal frequency relative to race/ethnicity( Reference Sobal and Hanson 9 ), but it is difficult to make a direct comparison to our results because they presented analyses adjusted simultaneously for multiple sociodemographic variables. Our findings were consistent with those reported by Sobal and Hanson relative to employment and marital status( Reference Sobal and Hanson 9 ); employment was associated with a lower frequency of family meals and marriage was associated with a higher frequency. Differences in social norms and cultural practices can influence the types of food eaten and the timing, social setting and location of eating occasions( Reference Devine 37 , Reference Axelson 38 ), and our results suggest that there are underlying disparities in family meal frequency that are unrelated to having children in the household.
The strengths of our study include the large size and sampling approach, which allow valid inferences to be made to the population of Ohio. Demographically, Ohio is similar to the USA overall with respect to age and sex composition( Reference Howden and Meyer 39 ), as well as in the average size and age structure of its families( Reference Lofquist, Lugaila and O’Connel 14 ), but there are fewer racial/ethnic minorities in Ohio than the USA as a whole( Reference Humes, Jones and Ramirez 40 ). A limitation of our study is the lack of comprehensive data on family composition. We had sociodemographic data for the adult respondent and they reported how many adults and children were in their family and living in their household, but we did not know the ages or other characteristics of these family members. This prevented us from further classifying families into additional sub-categories. For instance, the adults not living with minor children included those who never had children and those whose children were grown and no longer lived at home. Similarly, not all adults who lived with minor children were parents of those children. Finally, we relied on self-reported data about the frequency of family meals and social desirability bias could have produced inflated estimates.
Eating family meals at home is a common activity among all Ohio adults, not just those who live with minor children. Future studies should explore if other characteristics of adults and their families are associated with family meal frequency. Our findings support expanding research that examines family meal patterns and the health benefits of eating together to include all adults, rather than just those with minor children. If a higher frequency of family meals is associated with improved health outcomes for all adults, then public health initiatives should encourage all families to eat together.
Acknowledgements
Acknowledgements: The authors thank Courtney Lynch, Abigail Shoben and Corrine McConnaughy for their comments. Financial support: This research received no specific grant from any funding agency in the public, commercial or not-for-profit sectors. Conflict of interest: None. Authorship: Both authors have participated sufficiently in the work to take public responsibility for the content. R.T. conceptualized the study, performed the analysis and led the writing of the manuscript. S.E.A. oversaw the project and contributed to the study conceptualization, design of the analysis and writing of the manuscript. Both authors contributed to the interpretation of the findings and approved the final manuscript. Ethics of human subject participation: Ethical approval was not required.


