


Dietary recommendations are aimed at chronic disease prevention and investigators have begun to evaluate their effects on disease risk and mortality( Reference McCullough, Feskanich and Stampfer 1 ). Researchers at the US Department of Agriculture created the Healthy Eating Index (HEI) score to measure the concordance of dietary patterns with these guidelines( Reference McCullough, Feskanich and Stampfer 1 ) and diet quality( Reference Guenther, Casavale and Reedy 2 ). It is calculated from self-report methods for assessing dietary intake( Reference Kennedy, Ohls and Carlson 3 ).
Self-report methods for assessing dietary intake can be divided into three general categories: (i) recall of foods eaten; (ii) diet histories or retrospective questionnaires; and (iii) diet records. Diet recalls are designed to quantitatively assess recent nutrient intake and usually involve the recollection of all foods consumed during the previous 24 h. However, this method is not representative of habitual intake, which is often of interest in studies of diet and health. In contrast, diet histories and FFQ provide better estimates of usual or habitual diet and dietary patterns at the group level, but there are problems associated with recall, seasonality and their ability to identify individual differences in energy intake. Diet records, involving the weighing or quantifying (usually in household measures) of all foods and drinks consumed over a period typically ranging from 3 to 7 d, has often been considered the most accurate and precise method of dietary assessment. However, the need to weigh and record intake over several days can be seen as tedious and time consuming and thus is often associated with poor compliance and/or an alteration of the diet during the recording period( Reference Hill and Davies 4 ).
Because of the existence of these limitations and others, such as subject difficulty in completing questionnaires, the need for trained personnel to review the information collected, etc., there is growing interest in the possibility of using biological markers of dietary intake( Reference Neuhouser, Patterson and King 5 ). K is present in many foods such as vegetables, fruits, pulses and dairy products, all of which are necessary in an adequate diet( 6 ). The concentration of K in urine correlates well with its dietary intake( Reference Tasevska, Runswick and Bingham 7 ). In addition, low 24 h urinary K excretion (i.e. low K concentration in a 24 h urine sample, which is all the urine collected during a chosen day after the first urination of that day (discarded), but including the first urination of the following day) has been associated with an increased risk of developing type 2 diabetes( Reference Chatterjee, Colangelo and Yeh 8 ), stroke( Reference O’Donnell, Yusuf and Mente 9 ) and hypertension( Reference Hedayati, Minhajuddin and Ijaz 10 ). Easily and cheaply analysed, 24 h urinary K is a good candidate marker of food habits and diet quality( Reference Tasevska, Runswick and Bingham 7 , Reference Mente, Irvine and Honey 11 ). Limited data are available on K intake estimated by 24 h urinary K excretion and dietary quality. Some studies have been carried out in specific population groups and none in representative samples. For example, in one study involving a group of patients with kidney stones, 24 h urinary K correlated with the recommended foods score (RFS, an index of overall diet quality)( Reference Mente, Irvine and Honey 11 ); and in a sample of seventy-six children aged 6 years, increased diet quality (defined as adherence to the Icelandic food-based dietary guidelines) was associated with higher 24 h urinary K excretion( Reference Kristbjornsdottir, Halldorsson and Thorsdottir 12 ). Nevertheless, it needs to be determined whether this holds true for the general adult population.
The aim of the present work was to examine the correlation between 24 h urinary K excretion and diet quality in representative members of the adult Spanish population.
Materials and methods
Study participants
Data were obtained from the FANPE Study (‘Fuentes Alimentarias de Nutrientes en Población Española’; Dietary Sources of Nutrients in the Spanish Population), which was conducted under a contract with the Spanish Agency for Food Safety and Nutrition (AESAN) to determine food sources of energy and nutrients (with particular attention to Na intake) in the Spanish population( Reference Ortega, López-Sobaler and Ballesteros 13 ).
The study was conducted in accordance with the Declaration of Helsinki. All procedures were approved by the Ethics Committee of the Faculty of Pharmacy of the Universidad Complutense, Madrid. Written, informed consent to be included was obtained from all participants.
The study participants were 196 men and 222 women (total 418) aged 18–60 years (mean 36·4 (sd 11·8) years), selected to be representative of the Spanish adult population. The sample size was planned following the method of the Spanish INTERSALT study( 14 ). Assuming a drop-out rate of 25 %, the initial sample size required was 406 participants. Sampling was performed in fifteen randomly selected Spanish provinces (with the proviso that the great majority of Spain’s autonomous regions be represented), including the capital city of each and a randomly chosen small town or village. The total number of sampling points was therefore thirty. At each sampling point participants were divided into six subgroups, taking into account their sex (male/female) and age (18–30 years, 31–44 years or 45–60 years).
The sample size and the number of participants by sex and age to be included at each sampling point were determined, and candidate participants were contacted between January and February 2009. Candidates were randomly identified among the residents of each population and invited to take part via telephone (or in person in some villages). Individuals with abnormal urine dipstick findings, a diagnosis of diabetes, hypertension or renal disease, or who had been prescribed diuretics, were excluded. All selected participants were healthy and lived in their own homes. To be representative of the Spanish population, it was calculated that a sample size of 406 individuals would be needed. Nevertheless, a greater number of potential participants were contacted having in mind the possibility of refusal to participate and not meeting the inclusion criteria. Participants who refused to participate in the study were randomly replaced by another person with the same characteristics (area of residence, age, sex, socio-economic status). Of 1835 people spoken to, 492 (26·8 %) accepted the invitation to be included in the study. Of these, seventy-four were excluded (five with abnormal urine dipstick results, fifteen diagnosed with diabetes, forty-six with hypertension, two with renal disease and six who took diuretics). The final study sample therefore consisted of 418 participants (53·6 % women; 22·8 % of the originally contacted sample).
Measurement of 24 h urinary K excretion
The pH, density and the presence of leucocytes, nitrites, protein, glucose, ketones, urobilinogen, bilirubin and blood in spot urine samples were tested using Combur Test® reactive strips (Roche Diagnostics, S.L., Barcelona, Spain). Each reagent strip, impregnated with a chemical, reacts with the substance present in urine and quickly changes colour (60–120 s). The colour of the strip was compared with the colour chart present on the bottle label.
Urinalysis was considered abnormal if the following findings were detected:
-
1. >10–25 white blood cells/μl;
-
2. positive nitrites;
-
3. 1+ or greater proteins (1+, 2+ and 3+ correspond to 30 mg/dl, 100 mg/dl and 500 mg/dl, respectively);
-
4. 1+ or greater glucose (1+, 2+, 3+ and 4+ correspond to 50 mg/dl, 100 mg/dl, 300 mg/dl and 1000 mg/dl, respectively);
-
5. +1 or greater ketones (1+, 2+ and 3+ corresponds to 10 mg/dl, 50 mg/dl and 150 mg/dl, respectively);
-
6. +1 or greater urobilinogen (1+, 2+, 3+ and 4+ corresponds to 1 mg/dl, 4 mg/dl, 8 mg/dl and 12 mg/dl, respectively);
-
7. +1 or greater bilirubin (1+, 2+ and 3+); or
-
8. >5–10 red blood cells/μl.
None of the study participants presented these abnormalities.
Concentration of K in participants’ 24 h urine samples was determined using an indirect potentiometer with a selective solid membrane connected to an Olympus AU 5400 Autoanalyser (Mishima, Japan)( Reference Ng, Altaffer and Ito 15 ) (CV=1·1 %). Twenty-four-hour urinary K was not measured in three participants. Participants were classified in terms of whether their 24 h urinary K excretion was ≥93 mmol/d (group AP = adequate potassium) or <93 mmol/d (group IP = inadequate potassium). This value is related to a self-reported K intake of 4700 mg/d, which is regarded as adequate by the US Department of Agriculture( 6 ) for the adult population, bearing in mind that 77 % of K intake is lost in the urine( Reference Tasevska, Runswick and Bingham 7 ).
The urine creatinine concentration was determined according to the modification of the Jaffé reaction using the same Olympus AU 5400 Autoanalyser. The intensity of the colour developed was measured at a wavelength of 520 nm( Reference Kroll, Chesler and Hagengruber 16 ) (CV=2·8 %). All reagents were supplied by Olympus.
To exclude participants with obviously incomplete collections, we limited the analysis to those whose 24 h urinary creatinine value was at least 800 mg for women and at least 1200 mg for men. Furthermore, participants with 24 h urine volume below 500 ml were excluded. Thus, a total of fifty-eight individuals were excluded from the study, leaving 360 participants remaining.
To confirm the proper collection of 24 h urine, the correlation between urinary creatinine and the muscular mass of each participant was taken into account( Reference López-Sobaler and Quintas 17 ). Fat-free mass was therefore calculated, bearing in mind the creatinine excreted in the 24 h urine, using the following equationReference Forbes and Bruining 18 :
 $${\rm Fat{\hbox-}free \ mass (kg)}=0 \cdot 02908\, {\times}{\rm creatinine (mg/d)}{\plus}{\rm \,7}\! \cdot \!{\rm 38}{\rm .}$$
The results were compared with the fat-free mass results obtained by the electrical bio-impedance method.
In the present study, a positive significant correlation (r=0·646; P <0·001) was found between fat-free mass determined by the electrical bio-impedance method and that determined via the creatinine content of the 24 h urine. This shows that the 24 h urine samples were adequately collected.
Diet assessment
Food intake was determined using an interviewer-administered 24 h recall method on two consecutive days( Reference Ortega and Povea 19 ). All interviews were conducted by trained field researchers and using the five-step multiple-pass method( Reference Dwyer, Picciano and Raiten 20 ). Participants were asked about the consumption of foods that are often forgotten (non-alcoholic and alcoholic beverages, sweets, sauces, salt, fats, etc.), all foods consumed on the preceding day (where appropriate, the brands of these foods were also recorded) and the size of the servings consumed (approximate weights or household measures). For this, measurement aids such as measuring cups, spoons, a ruler and a food model booklet were provided, to assist participants in estimating accurate quantities of foods and beverages consumed. In addition, participants indicated the food preparation method (bake, fry, broil, etc.) and whether weights or sizes corresponded to raw or cooked food, with or without bone, with or without skin, etc.
The energy and nutrient intakes were then calculated using food composition tables( 21 ). DIAL software version 3·0·0·5 (Alce Ingeniería, Madrid, Spain) was used to process all data( Reference Ortega, López-Sobaler and Andrés 22 ).
The self-report dietary intake data were validated by taking into account the discrepancy between energy intake and theoretical energy expenditure (the latter being calculated bearing in mind body the weight, sex, age and physical activity level of each participant), using the following formula:
 $${{{\rm Theoretical\ energy\ expenditure-energy\ intake}} \over {{\rm\ Theoretical\ energy\ expenditure}}}{\rm {\times}100}{\rm .}$$
In participants of stable weight, energy intake should be similar to the estimated energy expenditure; thus a negative value indicates the component involving the declared energy intake to be greater than the theoretical energy expenditure (probable overestimation), while a positive value indicates it to be lower than the theoretical energy expenditure (probable underestimation)( Reference Ortega, Quintas and Sánchez-Quiles 23 ).
The quality of the participants’ diets was determined using the HEI( Reference Kennedy, Ohls and Carlson 3 ), taking into account the number of servings recommended for the different food groups and the nutritional aims set out for the Spanish population( Reference Ortega, Requejo and Navia 24 ). The HEI was used in the examination of ten dietary factors: the number of servings of cereals, vegetables, fruits, dairy products and meat/fish/eggs consumed daily; and the fulfilling of nutritional aims with regard to fat intake, SFA intake, cholesterol intake, Na intake and dietary variety (number of different types of foods consumed in 3 d). Each component of the index has a maximum score of 10 and a minimum score of 0. Intermediate scores were computed proportionately. The lowest component scores (0) was given when there was not compliance with recommended ranges (>45 % energy from fat, >15 % energy from SFA, >450 mg cholesterol/d, >4800 mg Na/d) and amounts (0 serving/d for the food groups and dietary variety ≤6 foods/3 d). The highest component scores (10) were given when the recommended ranges (≤30 % energy from fat, <10 % energy from SFA, <300 mg cholesterol/d, <2400 mg Na/d) or amounts (6–10 servings grains/d, 3–5 servings vegetables/d, 2–4 servings fruits/d, 2–3 servings milk and dairy products/d, 2–3 servings meat, fish, eggs/d and dietary variety ≥16 foods/2 d) were reached.
The diet was deemed excellent when over 80 points were scored, very good when a score of 71–80 was obtained, good when the score was 61–70, acceptable when 51–60 and inadequate when the score was below 50 points( Reference Kennedy, Ohls and Carlson 3 ). Furthermore, diets were classified as ‘need improvements’ when the HEI score was between 51 and 80 points( 25 ).
Time schedule of measurements
Once the interviewer had contacted the participant, explained in detail the work to be undertaken and each participant had given his/her written consent to participate, three meetings were planned on consecutive days.
-
1. Day 1: At this meeting, personal data and health information were collected to confirm the meeting of inclusion criteria. The interviewer also gave each participant appropriate containers and instructions for collecting the spot and 24 h urine samples. The instructions given to the participants for collecting 24 h urine samples were: (i) to begin the urine collection in the morning; (ii) to flush away the first urination; (iii) to collect the subsequent urinations in the proper container; (iv) to collect the rest of the urinations, day and night, for 24 h, using the container provided to them for collecting urine; and (v) to avoid using other containers. The collection finished when the first urination of the second day was included in the collection.
-
2. Day 2: The interviewer picked up the spot urine sample and once again went over the instructions for the proper collection of the 24 h urine sample. Anthropometric and activity data were also collected. The first 24 h diet recall was administered.
-
3. Day 3: Each participant provided his/her 24 h urine sample to the interviewer. After measuring its volume, it was divided into three aliquots and stored. Some information on socio-economic data was collected. The second 24 h diet recall was administered.
In those cases where collection of either the spot or the 24 h urine sample had to be repeated, further meetings were planned.
The same questionnaires were used in all thirty areas and were administered following the same protocol. All work was performed between January and September 2009.
Covariate assessment
Recording of health variables
Information about health conditions and medication use (required to determine whether the participants met the inclusion criteria), supplements and manufactured dietary foods was collected.
Blood pressure was measured in the right arm of seated participants following a 5 min rest period, using an Omron HEM-907XL automated sphygmomanometer (Omron Health Care, Inc., Vernon Hills, IL, USA), which is a valid method to use in the clinical setting( Reference Myers, Valdivieso and Kiss 26 ). Of the 360 remaining participants, we found that thirty-one of them had high values of blood pressure (more than 140/90 mmHg), and they were excluded from the study. Thus, the final sample size was 329 participants. Owing to the high exclusion rate, the representativeness of the sample was lost.
Physical activity
All participants completed a questionnaire on their usual physical activity( Reference Ortega, Requejo and López-Sobaler 27 ). A coefficient of activity was obtained using the information of this questionnaire. In this way, participants indicated the length of time spent sleeping, eating and playing sports, etc., both on working days and weekends. Thereafter, the time spent in each activity was multiplied by a specific factor (1, 1·5, 2·5, 5 or 7): 1 was used for sleeping and resting, 1·5 for very light activities (those that can be done sitting or standing up, such as ironing, typing or painting), 2·5 for light activities (e.g. walking), 5 for moderate activities (e.g. playing tennis, skiing, dancing) and 7 for intensive activities (e.g. cutting down trees, playing basketball). The values recorded were summed and then divided by 24 h. These data provided two coefficients, one for weekdays and one for weekends. The weekday coefficient was multiplied by 6; the coefficient for the weekend day was then added to this and the total divided by 7( 28 , Reference Ortega, Requejo and Quintas 29 ). This provided a final coefficient of activity for each participant, which was multiplied by the BMR to provide the predicted energy expenditure for each( 28 , Reference Ortega, Requejo and Quintas 29 ).
Anthropometric information
Weight and height were determined using a digital electronic balance (Seca Alpha, Seca GmbH & Co., Igni, France; range 0·1–150 kg, precision 100 g) and a Harpenden digital stadiometer (Pfifter, Carlstadt, NJ, USA; range 70–205 cm, precision 1 mm), respectively. For both measurements, participants were barefoot and wore only underwear. All data were collected following norms set out by the WHO( 30 ). BMI (kg/m2) was calculated from the body weight and height values (BMI = weight/height2).
Percentage body fat (%BF) was determined by measuring the participants’ electrical bio-impedance using an OMRON BF306 Body Fat Monitor (Shimogyo-ku, Kyoto, Japan); this is a valid method for use in the clinical setting( Reference Deurenberg, Andreoli and Borg 31 ). Using the value for this variable and knowing a participant’s body weight, the fat mass and fat-free mass can be calculated as follows:
 $${\rm Fat\ mass \ (kg)}={\rm \,\%\,BF}{\times}{\rm body\ weight \ (kg)/100}$$
and
 $${\rm Fat{\hbox-}free\ mass \ (kg)}={\rm body\ weight\ (kg)}{\minus}{\rm fat\ mass\ (kg)}{\rm .}$$
Socio-economic data
Data were collected from all participants on their educational level, job and number of people who lived in their house.
Statistical analysis
Means and standard deviations were calculated for all variables and the normality of the data was checked.
Nutrient intakes were adjusted for total energy intake using the nutrient residual method( Reference Willett and Stampfer 32 ). Student’s t test (or the Mann–Whitney U test if the distribution of the results was not homogeneous) was used to compare means between groups. In presenting the results, when the quantitative variables are statistically different between groups, the significance appears in the mean column if the variable is homogeneous. The χ 2 test was used to determine the significance of differences between proportions.
Relationships between variables were examined by multiple linear regression analysis, controlling for the following covariables: sex, age, BMI, energy intake, under-reporting of energy intake (%) and coefficient of activity. Logistic regression analysis was used to identify risk or protection factors with respect to following an adequate diet, expressed as the odds ratio and 95 % confidence interval. All calculations were made using the statistical software package IBM SPSS Statistics 19. Significance was set at P<0·05.
Results
The mean (for all studied participants) 24 h urinary K excretion and HEI score were 73·5 (sd 32·3) mmol/d and 59·5 (sd 13·4) points, respectively. According to HEI score, 27·4 % of the participants had inadequate diets (HEI <50 points) and 64·7 % had diets that needed improvement (HEI =51–80 points). BMI, fat-free body mass, coefficient of activity, energy intake, under-reporting of energy intake, and 24 h urinary K and creatinine excretions were greater among men than women. Women, however, obtained better HEI scores (Table 1).
Table 1 General characteristics of the study population by sex: Spanish adults (n 329) aged 18–60 years, FANPE Study (‘Fuentes Alimentarias de Nutrientes en Población Española’; Dietary Sources of Nutrients in the Spanish Population), January–September 2009

BF, body fat; FM, fat mass; FFM-EBI, fat-free mass obtained by electrical bio-impedance; FFM-C, fat-free mass estimated from 24 h urinary creatinine excretion; HEI, Healthy Eating Index.
Student’s t test (or the Mann–Whitney U test if the distribution of the results was not homogeneous) was used to compare means between groups.
*P<0·05, ** P<0·01, *** P<0·001 (significant difference between sexes).
Self-reported energy intake was positively related to self-reported K intake (Spearman’s correlation coefficient =0·615; P<0·001), but was unrelated to 24 h urinary K excretion (Spearman's correlation coefficient =0·046; P=0·411). Self-reported K intake and 24 h urinary K excretion were positively related (Spearman’s correlation coefficient =0·233; P<0·001).
The AP group had a higher mean age and included fewer women than the IP group. AP participants also had higher 24 h urinary K excretion, consumed more fruits and vegetables and had a more varied diet than the IP participants. Further, the AP participants had higher total HEI scores, as well as higher scores for the HEI dietary components of servings fruits/d and servings vegetables/d, and dietary variety (Table 2).
Table 2 Dietary intake, physical activity, demographic characteristics, HEI components and their scores in the study population by 24 h urinary potassium excretion: Spanish adults (n 326) aged 18–60 years, FANPE Study (‘Fuentes Alimentarias de Nutrientes en Población Española’; Dietary Sources of Nutrients in the Spanish Population), January–September 2009

HEI, Healthy Eating Index; IP, inadequate potassium; AP, adequate potassium.
Student’s t test (or the Mann–Whitney U test if the distribution of the results was not homogeneous) was used to compare means between groups.
*P<0·05; ** P<0·01; *** P<0·001 (significant difference between IP and AP groups).
† Data adjusted for covariables of sex, age, BMI, energy intake, under-reporting of energy intake and coefficient of activity.
After taking into account the covariables sex, age, BMI, energy intake, under-reporting of energy intake and coefficient of activity, it was seen that an increase in intake of fruits, vegetables or dairy products of 1 serving/d was associated with an increase in 24 h urinary K excretion of 3·791, 4·625 or 3·312 mmol/d, respectively. As dietary variety increased by one food item, 24 h urinary K excretion increased by 3·150 mmol/d. As the HEI component score for daily servings of fruits, vegetables and dairy products and dietary variety increased by 1, 24 h urinary K excretion increased by 1·305, 2·738, 1·356 and 3·451 mmol/d, respectively (Table 3).
Table 3 Associations between HEI components scores and 24 h urinary potassium excretion (results from multivariable-adjusted linear regression analyses)Footnote †: Spanish adults (n 326) aged 18–60 years, FANPE Study (‘Fuentes Alimentarias de Nutrientes en Población Española’; Dietary Sources of Nutrients in the Spanish Population), January–September 2009
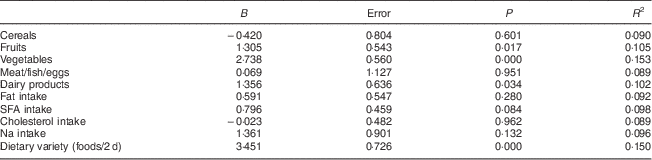
HEI, Health Eating Index.
† Adjusted for covariables of sex, age, BMI, energy intake, under-reporting of energy intake and coefficient of activity.
Finally, for every 1 mmol/d increase in 24 h urinary K excretion, the quality of the diet increased by 0·55 points on the HEI scale (R 2 =0·134; P<0·001; Fig. 1). Correcting for the same covariables as above, logistic regression showed the AP participants to be less likely to have inadequate diets (HEI <50 points) than the IP participants (OR =0·439; 95 % CI 0·201, 0·961; P=0·039).
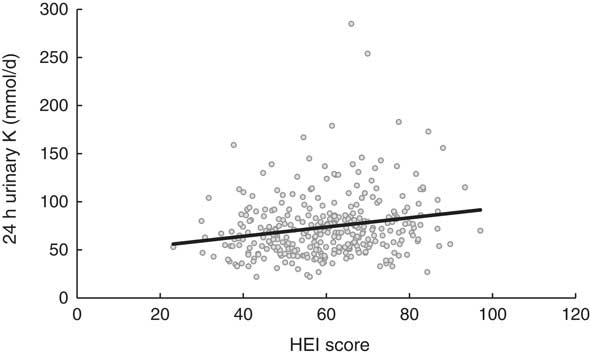
Fig. 1 Relationship between 24 h urinary K excretion and the Healthy Eating Index (HEI) score among Spanish adults (n 326) aged 18–60 years, FANPE Study (‘Fuentes Alimentarias de Nutrientes en Población Española’; Dietary Sources of Nutrients in the Spanish Population), January–September 2009. Relationship adjusted for covariables of sex, age, BMI, energy intake, under-reporting of energy intake and coefficient of activity (R 2=0·134; P<0·001)
Discussion
The mean 24 h urinary K excretion observed in the present study (73·5 (sd 32·3) mmol/d) is within the range found in previous studies( Reference Laatikainen, Pietinen and Valsta 33 – Reference Huggins, O’Reilly and Brinkman 37 ) and reflects a mean level of K intake below that considered appropriate for a healthy diet (<4700 mg/d)( 6 ). Twenty-four-hour urinary K excretion is related to the intake of vegetables, fruits and dairy products( 6 ), foods that are components of the HEI( Reference Kennedy, Ohls and Carlson 3 ). If the consumption of these foods is low, also expected are low values for K intake, 24 h urinary K and HEI score. Owing to this fact, the low mean 24 h urinary K value would be related to a low intake of vegetables, fruits and milk in the study population. The average diet of the present participants is acceptable and in need of improvement (mean HEI score 59·5 (sd 13·4) points), according to the ranges of the HEI. Indeed, 27·4 % of the present participants had inadequate diets, and 64·7 % had diets that needed improvement; these values are similar to those reported by other authors for both Spain and further afield( Reference Morimoto, Latorre Mdo and César 38 , Reference Norte Navarro and Ortiz Moncada 39 ). Many studies have related K intake to diet quality since this nutrient is present in vegetables, fruits and dairy products – basic components of any adequate diet that help prevent the appearance of chronic disease( 6 ). A recent study reported a Canadian population to have low K (and high Na) intakes, and recommended increasing the consumption of dairy products, fruits and vegetables with the aim of reducing the high blood pressure values also recorded( Reference Tanase, Koski and Laffey 40 ). Certainly, Park( Reference Park 41 ) observed that participants who ate four to six servings of vegetables daily enjoyed a 32 % reduction in the risk of stroke, while those who consumed more than six servings daily enjoyed a reduction of 69 %, and that the intake of K (among other nutrients) showed a significant negative association with the risk of stroke.
Although self-report methods available for obtaining information regarding dietary intake can be performed to determine the intake of nutrients such as K, they suffer from certain limitations, such as participants finding difficulty in completing the necessary questionnaires, the need for trained personnel to review the information collected and the requirement of an up-to-date food nutrient content database. Further, some respondents, especially those who are overweight/obese or underweight, do not report their intake accurately( Reference Prentice, Sugar and Wang 42 ). Moreover, when questionnaires are not completed by the participants themselves (e.g. when studying children), recording errors can occur, leading to distorted energy and nutrient intakes when data are calculated( Reference Ortega and Povea 19 ). Thus, there is growing interest in the possibility of using biological markers of dietary intake( Reference Neuhouser, Patterson and King 5 ). In the present study, 24 h urinary K excretion was found not to be related to energy intake (r=0·046; P=0·411), but to be positively related to self-reported K intake adjusted (r=0·261; P<0·001) and not adjusted by energy intake (r=0·233; P<0·001), as reported by other authors( Reference Tasevska, Runswick and Bingham 7 ). The lack of an association of 24 h urinary K excretion with self-reported energy intake may reflect inaccuracy in the self-report of the latter. It could be also be due to some aspect of K metabolism, but a biomarker of energy intake (i.e. doubly labelled water) has not been measured to test the association between it and 24 h urinary K. The measurement of 24 h urinary K excretion has the advantage over other biochemical methods of being non-invasive and inexpensive. It should be noted, however, that K excretion via the urine varies depending on age, sex, the amount of physical activity undertaken and BMI( Reference Hedayati, Minhajuddin and Ijaz 10 , Reference Zhang, Temme and Sasaki 43 – Reference Schlanger, Bailey and Sands 45 ), for which adjustment was made in the present study. Furthermore, it must be stated that using the 24 h urine method has some limitations. For example, 24 h urine collections may be difficult to obtain due to forgetfulness, misplacement of samples, lack of container capacity, erroneous inclusion of urine from the first void, or loss of urine during defecation. This is particularly so when studying individuals performing their routine lifestyles. Furthermore, it may be inconvenient to carry containers of urine around for a full day, which may reduce the number of individuals wanting to participate in a study( Reference Garde, Hansen and Kristiansen 46 ). Besides this, 24 h urine collections are not a practical method when large epidemiological surveys are conducted on the general population. This is especially true when compliance to 24 h urine collections cannot be guaranteed as, for example, in low-income areas, where appropriate freezing of the 24 h urine samples may not be possible( Reference Remer, Fonteyn and Alexy 47 ). In addition, in large epidemiological studies measuring urine produced over 24 h is challenging because specimens must be collected and stored during working periods. This collecting period may increase errors and therefore lead to inaccurate estimates( Reference Mill, Silva and Baldo 48 ).
As reported by Mente et al.( Reference Mente, Irvine and Honey 11 ), in the present study 24 h urinary K excretion was related to the consumption of vegetables, fruits and dairy products, as well as to their component HEI scores. These foods are important sources of this nutrient( 21 ) and their consumption, along with cereals, is recommended when trying to follow a varied, balanced diet. In fact, their consumption has been reported to be lower than that recommended in different studies( 6 , Reference Ortega, Quintas and Sánchez-Quiles 23 ). The excretion of K in the urine was also positively associated with dietary variety and its HEI component score. This is to be expected in people whose diets include vegetables, fruits and dairy products since they generally follow more adequate and balanced diets (with a number and size of food portions and an energy profile more adequate) overall. In a study in which the consumption of fruits and vegetables was increased in a group of overweight/obese women who also followed a hypoenergetic diet for 6 months, energy and lipid profiles improved, as did the number of different foods consumed (measured over 3 d periods) and their HEI scores( Reference Ortega, Rodríguez-Rodríguez and Aparicio 49 ).
In the present work, 24 h urinary K showed a significant, positive relationship with HEI score. In addition, those with a 24 h urinary K excretion >93 mmol/d had a 43·9 % lower chance of having an inadequate diet than those with a 24 h urinary K excretion <93 mmol/d. In a cohort of US male professionals, the HEI was weakly inversely associated with risk of major chronic disease when comparing the highest (82·8) with the lowest quintile (52·2) of the HEI (0·89; 95 % CI 0·79, 1·00; P<0·001) and moderately associated with lower risk of CVD (0·72; 95 % CI 0·60, 0·88; P<0·001)( Reference McCullough, Feskanich and Rimm 50 ). Similarly, in a cohort of 67 272 US female nurses, being in the highest HEI quintile (82·4) was associated with a 14 % reduction in CVD risk (0·86; 95 % CI 0·72, 1·03; P=0·085)( Reference McCullough, Feskanich and Stampfer 51 ). Thus, because HEI score is positively associated with 24 h urinary K excretion and inversely associated with the risk for various chronic diseases, studies exploring the association between 24 h urinary K excretion and those diseases are needed.
The present work suffers from the limitation that the response rate was relatively low, which indicates that the sample may not be representative of the Spanish population. Nevertheless, it seems that low participation rates do not necessarily indicate a high level of bias inherent in a study, and this situation does not invalidate the results obtained( Reference Galea and Tracy 52 ). Because of day-to-day within-person variability of K intake, multiple measurements are recommended to estimate usual dietary intake( Reference Tasevska, Runswick and Bingham 7 , Reference Willett 53 ). In one study, 8 d of urinary collections and 16 d of dietary records provided estimates which were almost as high as 30 d samples( Reference Tasevska, Runswick and Bingham 7 ). However, multiple urine collections are not practical in usual clinical practice and would reduce the relevance of the test for health-care providers( Reference Mente, Irvine and Honey 11 ). Finally, although urinary excretion over a 24 h period has been used as the gold standard to establish patterns of Na and K consumption( Reference Willett 53 ), this method has some limitations. First, and the most important limitation, is the inaccuracy of the urine volume. Second, the occurrence of circadian variations secondary to urine filtration and tubular secretion or reabsorption may introduce other estimate deviations besides those secondary to urine collection( Reference Koopman, Koomen and Krediet 54 ). Finally, in large epidemiological studies conducted on the general population, measuring urine produced over 24 h is challenging because specimens must be collected and stored during working periods. This collecting period may increase errors and therefore lead to inaccurate estimates( Reference Mill, Silva and Baldo 48 ). The methodological limitations of the present study make it difficult for any definite conclusions to be made. For this reason, larger controlled studies, with repeated measurements of 24 h urinary K excretion and collecting diet information for a longer period of time, are needed to establish more clearly the relationship between quality diet and 24 h urinary K excretion. Finally, under-reporting of energy intake must be taken into account when assessing dietary intake in population-based studies. Under-reporting introduces systematic bias and affects analyses of the major components of energy intake, macronutrients, micronutrients and toxic substances in foods. This bias cannot be removed in data analysis, but it needs to be taken into consideration when interpreting dietary data. The doubly labelled water method provides an accurate measure of total energy expenditure which, on the assumption that total energy expenditure equals energy intake, can be used as an indirect biomarker of energy intake and used to determine the extent of under-reporting in self-report dietary measures. However, cost makes its use difficult in studies( Reference Rennie, Coward and Jebb 55 ), and it has not been measured in the present work. The estimated energy requirements method allows under-reporting to be quantified and takes into account an individual’s activity level. Estimated energy requirements can be calculated from regression equations based on doubly labelled water data( 56 ), but they have not been used in the present work. As in other research( Reference Ortega, Requejo and Quintas 29 , Reference Ortega, Rodríguez-Rodríguez and Aparicio 49 ), WHO equations have been used to calculate BMR and to calculate predicted energy expenditure and under-reporting of energy intake.
Conclusion
In conclusion, the present results suggest that 24 h urinary K excretion is correlated with overall diet quality. It is worth mentioning that 24 h urine collections can be inconvenient and cumbersome for the patient and sometimes inaccurate due to missed samples and voiding problems. Nevertheless, although self-report methods for assessing dietary intake are also inconvenient and cumbersome for the patient, they are subject to more sources of both random and systematic error than biochemical methods (i.e. 24 h urinary K excretion). Self-report tools can be tested against more reliable and objective methods of assessment such as doubly labelled water to measure energy intake. These methods are not subject to the same sources of error and bias as self-report instruments. However, they are expensive and are usually impractical in a public health surveillance context. For these reasons, and because 24 h urinary K excretion is related to the consumption of vegetables, fruits and dairy products, as well as to their component HEI scores, it may be used by health professionals in testing diet quality, providing effective dietary counselling to patients following inadequate diets because of poor food choices and in monitoring the response to dietary interventions.
Acknowledgements
Financial support: The present study was supported by the AESAN (Spanish Agency for Food and Nutritional Safety, Spanish Ministry of Health and Consumer Affairs) (project 337/2008). AESAN had no role in the design, analysis or writing of this article. Conflict of interest: None. Authorship: R.M.O. contributed to the study design. E.R.-R., P.A.C. and L.G.G.-R. performed the data collection. E.R.-R., R.M.O., P.A.C. and L.G.G.-R. were involved in the data analysis and the interpretation of results. E.R.-R and R.M.O. contributed to the writing of the manuscript. Ethics of human subject participation: All procedures were approved by the Ethics Committee of the Faculty of Pharmacy of the Universidad Complutense, Madrid.


