


The United Nations’ criterion for an ‘ageing society’ is that people aged 65 years and over comprise 7 % of the total population( Reference Meiko 1 ). Based on this criterion, Taiwan has been qualified as an ageing society since September 1993. By the end of 2010, 10·74 % of the population in Taiwan was aged 65 years and over, with an ageing index of 68·6 %. During 2008–2010, the ageing index increased by 10·5 % showing a rising trend that is expected to continue( 2 ). Given this trend, it is believed that research on elders (defined as residents aged 65 years and over) should focus not only on caring for sick elders but also on healthy ones, so as to promote their health and improve their quality of life.
Chronic diseases like cancer, cerebrovascular illness, heart disease and diabetes are among the top ten causes of death in Taiwan( 3 ). Most of these are highly correlated to dietary habits( 4 – Reference Bertsias, Linardakis and Mammas 6 ). Fruits and vegetables are rich in nutrients like vitamin C, vitamin E, carotene, folic acid, minerals and edible fibre, and eating them can significantly reduce the occurrence of the above-mentioned chronic diseases( Reference Heavey, McKenna and Rowland 7 , Reference Tsugane 8 ), the metabolic syndrome( Reference Esmaillzadeh, Kimiagar and Mehrabi 9 ) and cancer( Reference Johnson 10 , Reference Pavia, Pileggi and Nobile 11 ).
The dietary guidelines published by Taiwan’s Department of Health highlight the recommended daily amount of consumption of fruits and vegetables. The new guidelines improved on earlier ones by recommending a daily intake of 2–4 servings of fruits and 3–5 servings of vegetables( 12 ). However, insufficient fruit and vegetable intake remains a major concern for public health in Taiwan. A 1999–2000 survey on the health conditions of the ageing population in Taiwan showed that the average daily vegetable intake of elderly people aged 65 years and over was 2·9 servings, while male seniors consumed 1·4 servings of fruit and female seniors consumed 1·1 fruit servings daily( 13 ). All of these averages were lower than the levels recommended by the Department of Health. Another survey in 2006 on middle-aged and elderly people showed that only 60 % ate fruits and vegetables on a daily basis( Reference Tsai, Liou and Chang 14 ). Consuming an adequate amount of fruits and vegetables, however, is of vital importance during the ageing process as it can effectively reduce and even prevent the occurrence of diseases and aid in overall fitness( Reference Lai, Liou and Huang 15 ).
The research participants for studies of fruit and vegetable consumption behaviour have usually been comprised of Taiwan’s younger generation (residents below the age of 65 years), as observed by various authors( Reference Wei, Wei and Lu 16 – Reference Ping and Cheng 18 ). However, the dietary habits of older and younger generations differ greatly. Not enough research has been conducted on the consumption habits of elders in Taiwan. We therefore targeted the elderly population in Renai District, Keelung City, Taiwan and explored factors that influence their consumption behaviour, so as to further understand the current fruit and vegetable consumption of seniors in that area. To do so, we examined how differences in demographic variables, social psychological variables and environmental variables relate to daily fruit and vegetable consumption behaviour. We expected the results of our research will help in providing elders in the community with an appropriate dietary education programme. We expected that the empirical research data from our study will be adopted by relevant government authorities in the formulation of future policies aimed at improving nutrition policies for ageing residents. Based on the above considerations, our research had the following objectives:
-
1. To understand the demographic variables of study participants and their current consumption level of fruits and vegetables.
-
2. To explore the relationship of demographic variables, social psychological factors and environmental factors with fruit and vegetable consumption behaviour of the participants.
-
3. To analyse the predictive capability of fruit and vegetable consumption behaviour based on demographic variables, social psychological and environmental factors.
Materials and methods
Research structure
We designed the research structure based on our research objectives and on related research papers (as shown in Fig. 1) in order to explore the relationship of the various subject factors with the participants’ fruit and vegetable consumption behaviour.
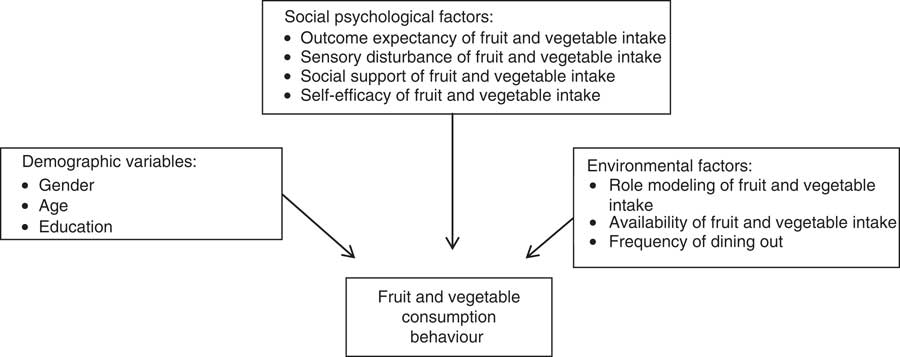
Fig. 1 Research structure
Data collection and ethical concerns
The population used for our research consisted of 6995 residents aged 65 years or older in Renai District, Keelung City, Taiwan( 19 ). At the time of the study, there were twenty-nine administration units in Keelung City’s Renai District, with a total of 688 ageing residents. Before conducting the survey, official approval from the Public Health Service Center of Keelung City’s Renai District was obtained. (The study did not require the approval of the country’s National Bioethics Committee.) Written informed consents were also obtained from all participants. Our interviewers were carefully trained before their visits to the study participants and we made sure that the interviewers explained the purpose of our research. The study participants were assured that data collected from them would be strictly confidential. We conducted anonymous interviews only after obtaining their approval. Anyone who felt uncomfortable during the interview was allowed to quit immediately. The study participants in this case were those aged 65 years and over and without significant cognitive deficit. A total of 398 effective samples of the survey were retrieved. Nine participants declined being interviewed, and 281 had a local residence registration but did not actually reside there. The overall effective response rate to the questionnaire was 57·8 %. In order to test if the returned samples were effective enough to represent the population, we conducted χ 2 testing on age and gender of the returned samples and found no significant difference between the returned samples (age χ 2=2·39, P=0·49; gender χ 2=0·24, P=0·62) and the population, indicating that the samples we obtained could effectively represent our population.
Materials
Based on our research structure, a self-structured, open questionnaire was designed in order to analyse the beliefs regarding outcome expectancy, cognitive deficit and self-efficacy of fruit and vegetable consumers, as well as their social support and role models. After the answers to the open questionnaire were collected, we assorted and classified the results based on their frequency, thus creating the ‘structured questionnaire’, which was more useful for the elderly participants. The structure of the open questionnaire is presented in Table 1.
Table 1 The structure of the open questionnaire
We first used the open questionnaire to interview the elders in Kuang-Hwa Administration Unit. Next, we collected all the answers and selected the top 70 % most common ones in order to revise our initial questionnaire. In the participants’ responses to the first question (‘What is the benefit of eating fruits and vegetables?’) in the open questionnaire, 70 % of the most frequent answers included providing a balanced diet, increasing energy, preventing constipation, strengthening immunity, detoxifying the system, beautifying skin, controlling weight, reducing chances of suffering cancer, CVD and canker, and protecting eyesight. In the responses to the second question (‘Under what circumstance would you hesitate to eat fruits and vegetables?’), 70 % of the most frequent answers included high prices, dining out, difficulty in chewing, dining alone at home and the availability of alternative choices. In the responses to the third question (‘Who would encourage you to eat fruits and vegetables in your day-to-day life?’), 70 % of the most frequent answers were sons and daughters, friends, spouses and health-care providers. In the responses to the last question (‘Who likes to eat fruits and vegetables and who does not in your day-to-day life?’), 70 % of the most frequent answers were spouses, siblings, children, daughters-in-law and grandsons. We then drew up a preliminary structured questionnaire based on the research structure and related research papers before having it reviewed, tested and modified by experts, in order to come up with a final version. The results of Cronbach’s α coefficient test on the questionnaire ranged from 0·80 to 0·97, indicating an acceptable level of consistency in all the measuring tables in the questionnaire.
Measuring table of fruit and vegetable consumption behaviour
Taking into account the relatively poor memory of the ageing population, we designed a weekly measuring table of five daily servings of fruit and vegetable consumption. The measuring table includes one question only. The interviewer would bring a picture of one serving of fruits and vegetables so as to illustrate what two servings of fruits and three servings of vegetables would look like.
Outcome expectancy of fruit and vegetable intake
Study participants would determine the probability and importance of the outcomes of consuming fruits and vegetables, such as providing a balanced diet, increasing energy, preventing constipation, strengthening immunity, detoxifying the system, beautifying skin, controlling weight, reducing chances of suffering cancer, CVD and canker as well as protecting eyesight. The measuring table has eleven questions and is designed according to the 5-point Likert scale, which includes the following items: ‘least possible and least important’ (1 point), ‘impossible and unimportant’ (2 points), ‘neutral’ (3 points), ‘possible and important’ (4 points) and ‘very possible and very important’ (5 points). The method of calculating scores is to add up the multiple of probability of outcomes and the multiple of the importance of outcomes. A higher average score indicates that more positive outcomes could be expected from intake of fruits and vegetables and vice versa.
Sensory disturbance of fruit and vegetable intake
There are several facts and beliefs that reduce study participants’ willingness to consume fruits and vegetables, including high prices, dining out, busy schedules, lack of availability, poor methods of cooking, pesticide residues, difficulty in chewing, etc. The measuring table for assessing the obstacles in consuming fruits and vegetables has fourteen questions, which adopt a 5-point Likert scale: ‘strongly disagree’ (1 point), ‘disagree’ (2 points), ‘undecided’ (3 points), ‘agree’ (4 points) and ‘strongly agree’ (5 points). A higher average score indicates higher sensory disturbance in consuming fruits and vegetables and vice versa.
Self-efficacy of fruit and vegetable intake
There are some specific personal reasons that could impede the study participants from consuming fruits and vegetables, including poor chewing ability, dining alone at home and the availability of alternative choices such as meat. The measuring table, containing five questions, assesses confidence in overcoming the above obstacles to consume five daily servings of fruits and vegetables. It also adopts a 5-point Likert scale and has the following items: ‘least confidence’ (1 point), ‘low confidence’ (2 points), ‘normal confidence’ (3 points), ‘high confidence’ (4 points) and ‘strong confidence’ (5 points). A higher average score suggests better self-efficacy of fruit and vegetable intake and vice versa.
Social support for fruit and vegetable intake
The measuring table provided to study participants would assess the support from other people (such as sons and daughters, friends, spouses and health-care providers) in the most recent month. The support consists of emotional support (encouraging, reminding and applauding) as well as informative support (meaning information relating to the benefits of fruits and vegetables). The measuring table has sixteen questions and adopts a 5-point Likert scale: ‘never’ (1 point), ‘seldom’ (2 points), ‘sometimes’ (3 points), ‘often’ (4 points) and ‘very often’ (5 points). A higher average score means stronger support for the consumption of fruits and vegetables and vice versa.
Role models for fruit and vegetable intake
The measuring table assesses the frequency of fruit and vegetable consumption of people related to the study participant, within the most recent month. These people could be spouses, siblings, children, daughters-in-law and grandsons. The measuring table has sixteen questions and adopts a 5-point Likert scale: ‘never’ (1 point), ‘seldom’ (2 points), ‘sometimes’ (3 points), ‘often’ (4 points), ‘very often’ (5 points) and the absence of significant people (0 points). A higher average score indicates the presence of strong role models.
Availability of fruits and vegetables
This measures the availability of fruits and vegetables when dining out and dining at home within the most recent month. For example, if the study participants stored fruits and vegetables in their refrigerators, the possibility of these being consumed for dinner is high. The measuring table has five questions and adopts a 5-point Likert scale: ‘never’ (1 point), ‘seldom’ (2 points), ‘sometimes’ (3 points), ‘often’ (4 points) and ‘very often’ (5 points). A higher average score means higher availability of fruits and vegetables and vice versa.
Frequency of dining out
This measures the frequency of eating out for breakfast, lunch and dinner and calculates the weekly frequency of eating out.
Data analysis
The research collected data through individual interviews and used the SPSS for Windows 15·0 statistical software package to run data analyses. The statistics tools we used included percentage, mean, standard deviation, t test, χ 2 test, one-way ANOVA, Scheffé post hoc comparisons, Pearson product–moment correlation analysis, co-linearity tests and multiple regression.
In order to test if the returned samples were effective enough to represent the population, we conducted χ 2 testing on age and gender of the returned samples. Percentage, mean and standard deviation were used in this case to describe the demographic variables of the study participants and their current consumption level of fruits and vegetables. In order to understand the relationship of a nominal variable with fruit and vegetable consumption behaviour, we conducted a t test or one-way ANOVA test on the nominal variable and the consumption behaviour. When a significant difference was detected, we then conducted Scheffé post hoc comparisons to analyse the differences among groups. We also ran Pearson product–moment correlation analyses for the continuous variables and fruit and vegetable consumption behaviour. Before performing the related statistics, we reviewed the patterns of skew and peak for the continuous variables. The results showed that the absolute values of coefficients of skew and peak patterns were less than 1·5, a result defined as normal distribution. To analyse the predictive capability of fruit and vegetable consumption behaviour of study participants based on independent variables, we further ran multiple regression analyses on significantly correlated independent variables. Before running the multiple regressions, we conducted diverse co-linearity tests on significantly correlated independent variables, such as education level, outcome expectancy, social support, self-efficacy, frequency of dining out and role models. The variance inflation factor of each independent variable ranged from 2·03–2·75<10, with tolerance 0·53–0·72>1 and confidence interval less than 30. There was no significant co-linearity problem among the independent variables. The consumption behaviour of the illiterate group was less than that of the groups with other education levels. In the multiple regression models, education level was classified into ‘illiterate group’ and ‘educated group’. In multiple regression analysis, if the independent variable is a nominal variable, it should be converted to a dummy variable so as to add up the effect of a continuous variable on the nominal variable. Meanwhile, the converted dummy variable can be used as a forecasting variable for the multiple regression. Education level is also a nominal variable, which should be converted to a dummy variable before running the multiple regression analysis. The illiterate group was classified as the reference group, in contrast to the educated group. In all analyses, a 5 % level of statistical significance was used.
Results
Distribution of personal background factors
Table 2 shows there were 184 men (46·2 %) and 214 women (53·8 %) in the effective samples collected. Their age ranged from 65 to 95 years and the mean age was 73·93 (sd 5·95) years. With regard to education level, those having college and university education level accounted for 6·8 % (n 27) of the population, high school for 15·8 % (n 63), junior high school for 16·1 % (n 64), elementary school for 37·2 % (n 148) and the illiterate accounted for 24·1 % (n 96).
Table 2 Analysis of correlation between distribution of personal background factors and fruit and vegetable consumption behaviour among elderly residents aged 65 years or older (n 398), Renai District, Keelung City, Taiwan

Description of fruit and vegetable consumption
The mean number of days on which study participants consumed five daily servings of fruits and vegetables in a week was 2·86. Participants having five daily servings of fruits and vegetables accounted for 31·2 % of the total population; those having five daily servings of fruits and vegetables for 1–6 d/week accounted for 27·1 %; and the others having less than five daily servings accounted for 41·7 %. This reflects the fact that the consumption of fruits and vegetables by elders is generally insufficient and lower than the level recommended by the Department of Health in its published guidelines.
Factors influencing fruit and vegetable consumption behaviour
The correlation between each variable and fruit and vegetable consumption behaviour is described below.
Analysis of difference between personal background factors and fruit and vegetable consumption behaviour
According to Table 2, the personal background factor that influenced the elders’ fruit and vegetable consumption behaviour was education level (F=7·302, P<0·001). The Scheffé post hoc comparison showed that seniors with higher levels of education consumed more fruits and vegetables than others.
Relationship between social psychological and environmental factors and fruit and vegetable consumption behaviour
According to Table 3, except for sensory disturbance and availability of fruits and vegetables, the other five variables demonstrated a significant correlation with fruit and vegetable consumption behaviour. Our analysis is as follows.
Table 3 Metrics of correlation between social psychological and environmental factors and fruit and vegetable consumption behaviour among elderly residents aged 65 years or older (n 398), Renai District, Keelung City, Taiwan
The population having a more positive outcome expectancy of fruit and vegetable intake would have better fruit and vegetable consumption behaviour. Of all the expectations, the top three were detoxifying bad substances (r=0·335, P<0·001), strengthening immunity (r=0·241, P<0·001) and reducing the possibility of cancer (r=0·232, P<0·001).
Total social support had a significantly positive correlation with fruit and vegetable consumption behaviour (r=0·369, P<0·001), suggesting that more social support would effectively help elders increase consumption. These social supports come from health-care providers (r=0·310, P<0·001), friends (r=0·276, P<0·001), spouses (r=0·275, P<0·001) and sons and daughters (r=0·090, P=0·038). With regard to the correlation between social support and consumption behaviour, ‘encouraging me to have fruits and vegetables’ (r=0·404, P<0·001), ‘providing information on the benefits of fruits and vegetables’ (r=0·376, P<0·001), ‘applauding me for having fruits and vegetables’ (r=0·312, P<0·001) and ‘reminding me to eat fruits and vegetables’ (r=0·309, P<0·001) all exhibited a significant positive correlation with consumption behaviour. The correlation with ‘encouraging me to eat fruits and vegetables’ was the highest.
Self-efficacy had a significant positive correlation (r=0·145, P=0·004) with fruit and vegetable consumption behaviour, indicating that higher self-efficacy would help trigger a higher level of consumption. Among them, ‘When there is alternative choice of meat, I would stick with fruits and vegetables’ scored the highest (3·88 points) and ‘When dining out, I would still choose fruits and vegetables’ scored the lowest (3·45 points), meaning that dining out could have a negative impact on the confidence of study participants. According to Table 3, self-efficacy of fruit and vegetable intake had a significantly negative correlation (r=−0·406, P<0·001) with sensory disturbance, a result similar to that of Salehi et al. in 2010( Reference Salehi, Eftekhar and Mohammad 20 ).
Role models had a significant positive correlation (r=0·224, P<0·001) with consumption behaviour. The higher the role model scores were, the greater the fruit and vegetable intake of the participants. Among them, sons and daughters were the most influential role models (r=0·237, P<0·001), followed by spouses (r=0·188, P<0·001).
Frequency of dining out showed a significant negative correlation (r=–0·279, P<0·001) with consumption behaviour, meaning that a lower frequency of dining out resulted in improved consumption of fruits and vegetables.
Multiple regression analysis of the factors that influence fruit and vegetable consumption behaviour
To understand the factors influencing elders’ consumption behaviour, we further ran multiple regression analyses on independent variables with significant correlation, such as education level, outcome expectancy, social support, self-efficacy, frequency of dining out and role models. According to Table 4, the independent variables could explain a total of 24·2 % variance, while achieving statistical significance (F=11·28, P<0·001). The important predictive variables that reached significant levels included educated group (β=0·24, P<0·001), outcome expectancy (β=0·21, P<0·001), social support (β=0·30, P<0·001) and frequency of dining out (β=−0·12, P=0·024).
Table 4 Regression analysis of the correlation between education level, social psychological and environmental factors and fruit and vegetable consumption behaviour among elderly residents aged 65 years or older (n 398), Renai District, Keelung City, Taiwan
From the above results, it was found that the dummy variable, educated group, under education level showed better consumption behaviour than the illiterate group, while frequency of dining out had a negative impact on consumption behaviour. On the other hand, outcome expectancy and social support both positively influenced consumption behaviour. The absolute value of the standardized regression coefficient of social support was the largest among them.
Discussion
Description of fruit and vegetable consumption behaviour
Study participants consuming five daily servings of fruits and vegetables accounted for 31·2 % of the total population; those consuming five daily servings of fruits and vegetables for 1–6 d/week accounted for 27·1 %; and the others consuming less than five daily servings accounted for 41·7 %, meaning that their consumption of fruits and vegetables is insufficient. In the observation published by Jaime and Monteiro in 2005, 14·8 % of Brazilian men and 20·6 % of Brazilian women consumed five servings of fruits and vegetables per day( Reference Jaime and Monteiro 21 ). In their study, Salehi et al. observed that seniors in Iran consumed 1·76 servings of fruits and vegetables per day( 19 ). Riediger and Moghadasian indicated in their 2008 research that 47 % of Canadians consumed five daily servings of fruits and vegetables( Reference Riediger and Moghadasian 22 ). The above findings all suggest that insufficient consumption of fruits and vegetables by elders is a common issue in many countries.
Factors influencing fruit and vegetable consumption behaviour
Education level had a significant impact on fruit and vegetable consumption behaviour, and the educated group demonstrated better consumption behaviour than the illiterate group. Past studies have also indicated that seniors who received higher education usually had better consumption behaviour( Reference Jaime and Monteiro 21 , Reference Viebig, Pastor-Valero and Scazufca 23 ). The government’s health-related authorities should put an emphasis on high-risk groups (the illiterate and those with a high frequency of dining out) when promoting fruit and vegetable intake programmes for elders. Relevant special education programmes should be provided.
The items in outcome expectancy of fruit and vegetable intake that had the strongest correlation with consumption behaviour were detoxification, strengthening immunity and reducing the chances of cancer. Thus if the importance of these items were emphasized elders could understand the benefits of consuming fruits and vegetables and thereby increase their consumption.
Social support from sons and daughters, friends, spouses and health-care providers had a positive correlation with consumption behaviour. Among them, health-care providers accounted for the highest level of support. Besides family members and friends, medical staff should actively enhance elders’ consumption behaviour by encouraging them to eat more fruits and vegetables. Among the types of support available, ‘providing information on the benefits of fruits and vegetables’, ‘encouraging me to eat fruits and vegetables’, ‘reminding me to have fruits and vegetables’ and ‘applauding me for eating fruits and vegetables’ all showed a significant positive correlation with consumption behaviour. The correlation of ‘encouraging me to eat fruits and vegetables’ was the highest. Thus, when providing elders with health education they should actively inspired, in addition to informing them of the benefits of fruits and vegetables. According to the results of a study by Salehi et al. in 2010, elders’ consumption of five daily servings of fruits and vegetables could be increased if they are provided with increased social support( Reference Salehi, Eftekhar and Mohammad 20 ). Another study by Shaikh et al. in 2008 also found a positive correlation between social support and fruit and vegetable intake( Reference Shaikh, Nebeling and Yeh 24 ). Thrasher et al. indicated in their 2004 study that increasing social support for elders could improve their dietary behaviour and knowledge regarding healthy diets( Reference Thrasher, Campbell and Oates 25 ). The health education policy for the elders’ fruit and vegetable consumption behaviour should include an overall consideration of applying social support, which would help with their consumption. This could be done through the help of family members, friends and health-care providers. When educating the elders, encouragement and family involvement are the two most important factors. Self-learning methods of small groups in the fruit and vegetable health education programmes could be considered, as the elderly could thus learn from each other in an interactive, harmonious environment. The most important thing is that health-care providers should never neglect the important role played by them in providing support and encouragement for seniors.
Self-efficacy was significantly positively correlated with fruit and vegetable consumption behaviour. Our research showed that self-efficacy would enhance consumption; however, in the case of dining out, self-efficacy scored much lower for fruit and vegetable consumption. Therefore, this factor needs to be taken into account when designing any training programme to improve consumption behaviour. Dining out could lower the elders’ control over consuming a balanced diet including fruits and vegetables. Therefore, there is a need to provide ways of promoting fruit and vegetable intake for elders who have a higher frequency of dining out. The number of elders who always eat out and the reasons behind this could also be further analysed. It is suggested that the government could provide a balanced diet through meal delivery services for elders who live alone.
Likewise, role models had a significant positive correlation with fruit and vegetable consumption behaviour. It was found that sons, daughters and spouses are better role models for elders’ fruit and vegetable consumption behaviour, which could help elders change their dietary habits to enhance their consumption behaviour. On the other hand, dining out had a significantly negative correlation with fruit and vegetable consumption behaviour, which means that a lower frequency of eating out will have a positive impact on consumption.
Multiple regression analysis of factors influencing fruit and vegetable consumption behaviour
The largest absolute value of standardized regression coefficients was for social support, meaning that it has the greatest explicative capability for fruit and vegetable consumption behaviour of elders. Thus, health education for seniors should consider the application of social support, so as to enhance fruit and vegetable consumption.
Constraints to the study
Constrained by time, manpower and budget, the population of our study failed to cover the entire nation but was limited to only Keelung City’s Renai District. Meanwhile, the study did not include complete demographic variables and other kinds of health issues, such as obesity, chronic disease and disability degree.
Conclusion
In the current study we investigated the current status of fruit and vegetable intake among seniors and assessed the relationship between personal background factors, social psychological factors and environmental factors. It was found that the significant predictors of fruit and vegetable intake are education level, outcome expectancy, social support and frequency of dining out. Our findings support the conclusion that health education strategies to increase fruit and vegetable intake among seniors should include the variables of social support and outcome expectancy.
Acknowledgements
Financial support: This research received no specific grant from any funding agency in the public, commercial or not-for-profit sectors. Conflict of interest: None. Authorship: P.-T.H. was responsible for the conception and design of the research, data interpretation, manuscript writing and final approval of the manuscript. I.-J.C. was responsible for the conception and design of the research and data interpretation. P.-H.L. was responsible for data collection and data analysis. W.C. was responsible for data collection and data analysis. S.-Y.Y. was responsible for data collection. Ethics of human subject participation: Official approval from the Public Health Service Center of Keelung City’s Renai District was obtained before conducting the survey. The study did not require the approval of the country’s National Bioethics Committee. Written informed consent was also obtained from all participants.


