


Currently, extra-uterine growth restriction (EUGR) remains a health problem in premature neonates, especially in critically ill and malnourished newborn infants. However, there is no clear consensus about the definition of EUGR; this term is descriptive of stunted growth owing to a severe nutritional deficit during the first few weeks of life in preterm infants. EUGR has been described as having a growth value < 10th ( Reference Martín, Brown and Ehrenkranz 1 ) or 3rd( Reference Curtis and Rigo 2 ) percentile (P) at the time of discharge from the neonatal intensive care unit( Reference Sakurai, Itabashi and Sato 3 ) or at 36 weeks of corrected gestational age (CGA)( Reference Mestan, Yu and Matoba 4 ).
Children with a history of intra-uterine growth restriction may display nutritional disorders and metabolic alterations, higher prevalence of obesity and the metabolic syndrome, hypertension, type 2 diabetes and CVD at later stages( Reference Malavazos, Corsi and Ermetici 5 ). In IUGR children, the increase in pro-inflammatory cytokine concentrations may be a result of adipose tissue changes( Reference Maiorana, Del Bianco and Cianfarani 6 ). Similarly, the EUGR condition may also determine an early programming in the adipose tissue.
Recently, our research group has documented some metabolic changes in EUGR children. Plasma adipokine concentrations and antioxidant system parameters are altered in EUGR children compared with those in prepubertal healthy children. These changes may be associated with a higher risk of the metabolic syndrome or CVD later in life( Reference Ortiz-Espejo, Pérez-Navero and Olza 7 – Reference Ortiz-Espejo, Gil Campos and Muñoz Villanueva 10 ). Children with a history of EUGR might develop early signs of low-grade inflammation even at the prepubertal stage. However, thorough research would allow early diagnosis and early monitoring of EUGR children as well as allow devising nutritional programmes and prevention strategies. The goal of the present study was to compare pro-inflammatory markers in prepubertal EUGR children with those in a reference population.
Experimental methods
Selection of participants
In the present study, two groups of Caucasian children at a prepubertal stage (Tanner stage 1)( Reference Tanner 11 ) were enrolled: EUGR group and reference population group. The EUGR group included thirty-eight participants with a mean age of 8·42 (sd 3·02) years meeting the following eligibility criteria: (1) having a history of premature birth (before the completion of 37 weeks of pregnancy); (2) having been delivered between 1996 and 1998; (3) having a birth weight ≤ 1500 g and above P10 for gestational age (GA); (4) meeting both EUGR characteristics defined in the present study (weight < P3 at 36 weeks of CGA( Reference Mestan, Yu and Matoba 4 ) and at the time of discharge( Reference Martín, Brown and Ehrenkranz 1 , Reference Curtis and Rigo 2 ) from the neonatal intensive care unit); (5) being free of any disease unrelated to prematurity and EUGR. The exclusion criteria were as follows: (1) failure to meet the age requirements or perinatal criteria for EUGR; (2) presence of underlying inflammatory or metabolic disease; (3) displaying signs of puberty.
Initially, the clinical records of fifty-five participants with a history of EUGR were obtained. Consent was obtained from forty-four participants (excluding eleven, as they could not be located or had moved out of the study area). Due to being in Tanner stage >1, six subjects were excluded.
The reference population group included 123 randomised sex (fifty-nine males and sixty-four females) and age (8·93 (sd 1·32))-matched Caucasian prepubertal children in good health, meeting the following eligibility criteria: (1) being a healthy full-term neonate with adequate birth weight for GA (2500–3500 g and 38–42 weeks of GA); (2) having been delivered between 1996 and 1998; (3) displaying no disease at baseline (including perinatal stage). Healthy children were recruited from a group with a low suspicion of disease, but they needed to undergo a blood analysis. For these children, medical check-up by the paediatrician, physical examination and blood analysis proved normal. These children were included in the study after the evaluation of the test results and ruling out of disease.
Study design
The present study is a descriptive, analytical, observational case–control study. Low-grade inflammation biomarkers in prepubertal children with a history of EUGR were compared with those in a reference healthy population group in the study. Both groups of participants were selected in accordance with the percentile charts of age, sex and CGA developed by Carrascosa et al. ( Reference Carrascosa Lezcano, Ferrández Longás and Yeste Fernández 12 ).
Perinatal clinical records were collected and reviewed. Neonates with EUGR received parenteral nutrition, which included carbohydrates, proteins, amino acids, oligoelements, vitamins and long-chain fatty acids in amounts established at the neonatal intensive care unit, according to their maturity state and clinical progression. These children also received enteral nutrition – initially trophic and then full-feeding – in the form of a special formula for premature neonates. None of the infants was breast-fed. Personal and family health records of all the participants were documented.
The present study was conducted according to the guidelines laid down in the Declaration of Helsinki and was approved by the Institutional Ethical Committee of the Hospital. Written informed consent was obtained from all parents or legal guardians and verbal consent was obtained from all children. Verbal consent was witnessed and formally recorded.
Anthropometry and blood pressure measurement
At birth, anthropometric data including weight, crown-to-heel height, and head and chest circumferences were collected. Specifically, birth weight was assessed at 36 weeks of CGA and again at discharge according to the percentile charts of age, sex and CGA( Reference Carrascosa Lezcano, Ferrández Longás and Yeste Fernández 12 ).
In both groups of prepubertal children, anthropometry and a complete physical examination with Tanner staging( Reference Tanner 11 ), blood pressure (BP) measurement and biochemical analysis were performed. The prepubertal stage was also validated through serum hormone levels. Weight and height were measured in all the participants in barefoot and minimal clothing according to standard protocols with a HEALTH SCALE® ADE RGT-200 stadiometer (ADE Germany). BMI was measured as the ratio of weight:height squared (kg/m2). The z-scores for weight, height and BMI were estimated for all the participants. Normal growth was assessed using the growth percentile charts of the Spanish population( Reference Hernández, Castellet and Narvaiza 13 ). Waist circumference was measured midway between the lowest rib and the high point of the iliac crest with a measuring tape at the end of expiration. Systolic blood pressure and diastolic blood pressure were measured with a digital random-zero sphygmomanometer (Dinamap V-100; GE HealthCare), with the subjects resting supine for ≥ 5 min and placing a paediatric cuff around the left arm. Percentiles for systolic blood pressure and diastolic blood pressure were established according to the subject's age and sex( 14 ).
Blood collection and biochemical analysis
Blood samples were collected at 09.00 hours after a 12 h overnight fast and at rest. An intravenous catheter was inserted into a median cubital vein to collect two 3 ml blood samples, which were used to extract serum and plasma, respectively. Serum samples were analysed within 2 h of collection, while plasma samples were divided into aliquots and frozen at − 80°C until analysis. The serum concentrations of biochemical markers associated with metabolic disorders (uric acid and ferritin), liver enzymes, aspartate aminotransferase (CV ≤ 4·6 %), alanine aminotransferase (CV ≤ 5·2 %) and γ-glutamyl transferase (CV ≤ 4·8 %) were determined. Lipid profile was determined by measuring the concentrations of total cholesterol (CV ≤ 3 %), HDL (CV ≤ 4 %), LDL, TAG (CV ≤ 5 %), apoA-1 (CV ≤ 4·8 %) and apoB (CV ≤ 6·5 %). The concentrations of carbohydrate metabolism markers glucose (CV ≤ 5 %) and insulin (CV ≤ 7 %) were also determined. Homeostatic model assessment of insulin resistance (HOMA-IR = insulin (mU/l) × glucose (mmol/l)/22·5) values were also calculated. The concentrations of the following sex hormones were determined: follicle-stimulating hormone; luteinising hormone; oestradiol; testosterone. The analyses were carried out using the autoanalyser Architect i2000SR and c16000 (Abbott Diagnostics®, Abbott Laboratories).
Pro-inflammatory biomarker assay
The serum concentrations of C-reactive protein (CRP) (intra-assay CV 3·06 % and inter-assay CV 1·7 %) and plasma concentrations of hepatocyte growth factor (HGF) (intra-assay CV 7·7 % and inter-assay CV 11 %), IL-6 (intra-assay CV 7·8 % and inter-assay CV 18 %), IL-8 (intra-assay CV 7·9 % and inter-assay CV 15 %), monocyte chemotactic protein type 1 (MCP-1; intra-assay CV 7·9 % and inter-assay CV 18 %), neural growth factor (NGF; intra-assay CV 6 % and inter-assay CV 4 %), TNF-α (intra-assay CV 7·8 % and inter-assay CV 16 %) and plasminogen activator inhibitor type 1 (PAI-1; intra-assay CV 6·6 % and inter-assay CV 10 %) of both groups were measured. The concentrations of CRP were quantified using the autoanalyser Architect c16000 (Abbott Diagnostics®, Abbott Laboratories) by turbidimetric immunoassay with latex particles. The concentrations of the remaining biomarkers were determined using the Luminex® xMAP™ multiplex technology on a Labscan™ 100 flow analyser and using LINCOplex assay kits (Millipore Corporation) by an immunoassay on the surface of fluorescent-coded microspheres( Reference Kellar and Douglass 15 ).
Statistical analysis
As all the possible candidates from the database of a hospital neonatal unit were selected, previous sample size estimation was not necessary, but assuming a difference of 30 % in mean values for the main study variables between the EUGR group and the control group, an α-error of 0·05, a β-error of 0·1 in a bilateral contrast of hypothesis, and a loss to follow-up of 15–20 %, thirty-seven EUGR children and 111 control children group were required (1:3) for the present study. Means and standard deviations were calculated for quantitative variables, and counts (n) and percentages (%) were calculated for qualitative variables. The adjustment to a normal distribution was assessed using the Shapiro–Wilk test. Homogeneity of variances was estimated using Levene's test. Proportions (%) were compared using the statistical χ2 for contingency tables. Mean values obtained for quantitative variables in both groups were compared using the Mann–Whitney U test. BP values and inflammatory biomarker concentrations were adjusted by GA and birth weight and length. These data are expressed as means with their standard errors and adjusted P values.
Spearman's correlation coefficient (ρ) was calculated to establish the relationship between quantitative variables. A factorial analysis was carried out to determine whether the inflammatory biomarkers could be grouped into a relatively small number of factors of biological significance that would explain the presence of low-grade inflammation at prepubertal age. Accordingly, parameters were grouped into components based on whether having a value >0·6 or not. A multiple linear regression analysis was carried out to identify the factors associated with plasma TNF-α concentrations. A corrected coefficient of determination (R 2) was used to determine the global fit of the model. Data analysis was carried out using the statistics software SPSS18® (PASW Statistic 18, Inc.).
Results
Table 1 summarises the main perinatal characteristics of EUGR children. During the gestational period, 22 % of the mothers had hypertension. Diseases with the highest prevalence among the EUGR neonates were sepsis (64 %) and hyaline membrane disease (60 %). Among the EUGR neonates, 23 % had patent ductus arteriosus, 20 % had intraventricular haemorrhage (generally grade 2) and 9 % had necrotising enterocolitis. Treatment with inotropes and corticosteroids was undergone by 61 and 30 % of the neonates, respectively.
Table 1 Major perinatal data of infants with extra-uterine growth restriction (EUGR) and anthropometric parameter, blood pressure and biochemical marker values of prepubertal children with a history of EUGR and control children (Mean values and standard deviations or standard errors; median values and interquartile ranges (IQR))

CGA, corrected gestational age; WC, waist circumference; SBP, systolic blood pressure; DBP, diastolic blood pressure; GGT, γ-glutamyl transferase.
* Statistical significance obtained by the χ2 test.
† Statistical significance obtained by the Mann–Whitney U test.
‡ sem.
§ Adjusted P value.
The anthropometric measurement, BP and metabolic parameter values of both groups at prepubertal age are given in Table 1. Some of them have been published previously( Reference Ortiz-Espejo, Pérez-Navero and Olza 7 – Reference Ortiz-Espejo, Gil Campos and Muñoz Villanueva 10 ). Statistically significant differences in sex and z-scores for weight, height and BMI were found between the two groups. The subjects were grouped into percentiles for weight, height and BMI for age and sex. The EUGR group had weight and height values below P50 and BMI values below or equal to P25 (P< 0·001 for all cases). The EUGR group had higher BP – both systolic blood pressure and diastolic blood pressure – when compared with the reference group even after adjustment for GA, weight and length at birth (Table 1). In Fig. 1, specifically the distribution of children by percentiles for BP is shown. A significant proportion of subjects in the EUGR group had BP values above P95 when compared with the reference group.
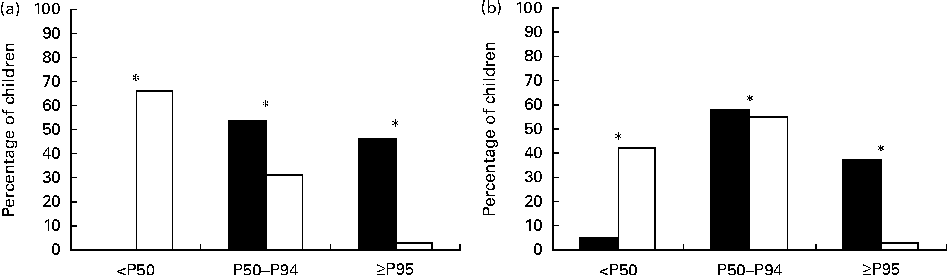
Fig. 1 Percentiles of systolic blood pressure (a) and diastolic blood pressure (b) in prepubertal children with a history of extra-uterine growth restriction (n 38; ■) and in a reference group (n 123; □). Values are percentages of children in each percentile. *P< 0·001.
The concentrations of biochemical markers in both groups were within the normal range, although the EUGR group had lower serum HDL-cholesterol concentrations and higher glucose concentrations than the reference group (Table 1). The plasma concentrations of inflammatory markers TNF-α, HGF, CRP, IL-8 and MCP-1 were significantly higher in the EUGR group than in the healthy group (Fig. 2). No differences were observed between the two groups with regard to the concentrations of IL-6 (EUGR: 1·97 (sd 1·61) v. reference group: 4·42 (sd 7·92) pg/ml; P= 0·282), NGF (EUGR: 9·66 (sd 6·28) v. reference group: 20·53 (sd 36·11) pg/ml; P= 0·624) and PAI-1 (EUGR: 16 362·07 (sd 6810·43) v. reference group: 18 482·44 (sd 13 614·09) pg/ml; P= 0·575). After adjustment for GA, weight and length at birth, significant differences between the two groups were found with regard to only TNF-α concentrations (EUGR: 7·47 (sd 0·61) v. reference: 3·41 (sd 0·23) pg/ml; adjusted P< 0·001).
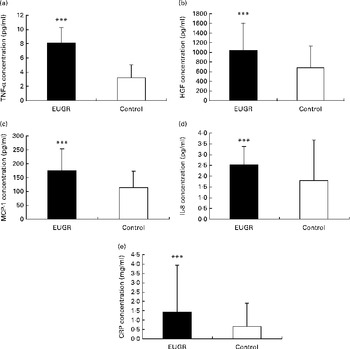
Fig. 2 Pro-inflammatory biomarker concentrations in prepubertal children with a history of extra-uterine growth restriction (EUGR, n 38) and in a reference group (n 123). (a) TNF-α, (b) hepatocyte growth factor (HGF), (c) monocyte chemotactic protein type 1 (MCP-1), (d) IL-8 and (e) C-reactive protein (CRP). Values are means, with their standard deviations represented by vertical bars. *** Mean value was significantly different from that of the reference group (P< 0·001; Mann–Whitney U test).
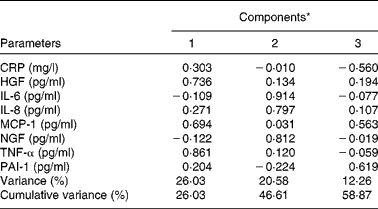
Table 2 summarises the most significant correlations observed between inflammatory parameters. TNF-α exhibited the strongest association with inflammatory biomarkers such as MCP-1 and HGF. On the other hand, a principal component analysis was carried out with the strongest correlations between inflammatory markers. Major commonalities (proportion of variance explained by common factors) obtained were as follows: IL-6, 0·86; MCP-1, 0·81; TNF-α, 0·80; IL-8, 0·74; HGF, 0·70; NGF, 0·68. Applying the method of Kaiser that determines factors such as eigenvalues >1, a factorial structure with three components was obtained. Table 3 summaries the principal component's matrix extracted from this analysis. All the inflammatory biomarkers (except CRP) were associated with a percentage of the variance of the inflammatory status in childhood. Component 1 (associated with HGF, MCP-1 and TNF-α) explained 26·03 % of the total variance. Component 2 (associated with IL-6, IL-8 and NGF) explained 20·58 % of the remaining variance not explained by the first component. Component 3 (associated with PAI-1 and MCP-1) explained 12·26 % of the remaining variance, not explained by either the first component or the second component. Finally, the cumulative percentage of the variance of this factorial structure of three components explained 57·58 % of the total variance.
Table 2 Results of correlation analysis performed on pro-inflammatory biomarkers (Spearman's correlation coefficient (ρ) values)
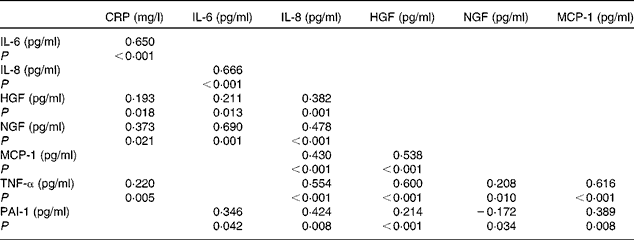
CRP, C-reactive protein; HGF, hepatic growth factor; NGF, neural growth factor; MCP-1, monocyte chemotactic protein type 1; PAI-1, plasminogen activator inhibitor type 1.
Table 3 Components of factorial analysis on inflammatory biomarkers
CRP, C-reactive protein; HGF, hepatocyte growth factor; MCP-1, monocyte chemotactic protein type 1; NGF, neural growth factor; PAI-1, plasminogen activator inhibitor type 1.
* Component 1: HGF, MCP-1 and TNF-α; component 2: IL-6, IL-8 and NGF; component 3: PAI-1.
Table 4 summarises the results of the multiple linear regression analysis. Variables statistically associated with the increase in plasma TNF-α concentrations were EUGR group, HGF and MCP-1. Age and HDL concentrations were associated with a decrease in TNF-α concentrations. The coefficient of multiple correlation in this model was very high (R 0·87) and significant (F= 91·54; P< 0·001), indicating a linear relationship between the plasma concentrations of TNF-α and the set of parameters listed in Table 4. The adjusted coefficient of determination (R 2) indicated that 75 % of the variability in plasma TNF-α concentrations can be explained by the variables that form this linear regression model.
Table 4 Results of the multiple linear regression analysis carried out to identify factors associated with the plasma concentrations of TNF-α* (pg/ml) (Non-standardised β-coefficient values and 95 % confidence intervals)
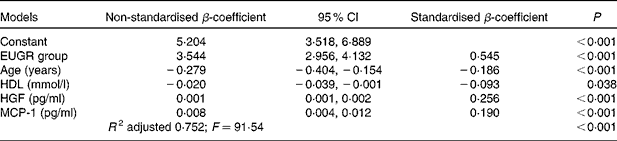
EUGR, extra-uterine growth restriction; HGF, hepatocyte growth factor; MCP-1, monocyte chemotactic protein type 1; R 2, coefficient of determination; F, Fisher–Snedecor statistic (variance analysis).
* Dependent variable.
Discussion
The most relevant results obtained in the present study suggest that children with a history of EUGR exhibit poor growth and have higher concentrations of inflammatory biomarkers and higher BP values when compared with a healthy group. Similar findings have been reported in relation to other pathological conditions, such as obesity in patients at prepubertal age( Reference Gil-Campos, Ramírez-Tortosa and Aguilera 16 ).
Some authors have described that low birth weight, low GA, male sex (which might explain why the EUGR group included a greater number of male subjects than female subjects; Table 1), pathologies related to prematurity, intake of postnatal steroids, a longer hospital stay and an inadequate nutritional supply in the first few days of life are the most significant factors associated with the growth restriction status( Reference Sakurai, Itabashi and Sato 3 ). Children with a history of IUGR generally have lower growth rate and weight when compared with healthy infants that are born full-term and have adequate birth weight for GA. Nevertheless, IUGR children are likely to suffer from obesity at later stages( Reference Nobili, Alisi and Panera 17 ). Similarly, immature neonates with low birth weight achieve the catch-up growth during the first few years of life, but they remain smaller in size during prepuberty and adolescence compared with children born full-term( Reference Fanaro 18 ). Similarly, in children with a history of EUGR, it has been observed that poor growth is also present not only during the neonatal period but also throughout childhood( Reference Martín, Brown and Ehrenkranz 1 ). Data indicated that the EUGR group had lower weight, height and BMI values than the reference group (Table 1). Furthermore, a relevant percentage of children in the EUGR group (33 %) had growth delay ( < P10) that prevailed at school age, specifically delay in achieving the medium normal height of the reference group at the same age.
Fetal development is significantly influenced by genetic susceptibility and/or intra-uterine environment. Consequently, it may induce alterations in the adipose tissue and metabolic programming, resulting in changes in the first few years of life( Reference Meas 19 ). Some authors have indicated that neonatal nutritional support may lead to later metabolic anomalies associated with certain pathologies later in life, but still there is no strong evidence to support this hypothesis( Reference Singhal, Cole and Fewtrell 20 – Reference Dalfrà, Pacini and Parretti 22 ). IUGR neonates manage to adapt to the adverse intra-uterine environment, favouring thus the appropriate development of vital organs( Reference Maiorana, Del Bianco and Cianfarani 6 ) but causing dynamic quantitative and qualitative changes in adipocytes – mainly in the visceral adipose tissue( Reference Yajnik 23 ), to achieve an optimal growth. Some authors have demonstrated that later metabolic diseases and CVD are associated with intra-uterine nutritional deficit in that fetal growth is related to an increased risk of CVD, hypertension, dyslipidaemia, insulin resistance and type 2 diabetes( Reference Meas 19 ). However, the mechanisms involved in the development of these pathologies – such as low-grade inflammation – are still unknown( Reference Lévy-Marchal and Czernichow 24 , Reference Antua-Puente, Feve and Fellahi 25 ). Among other alterations, IUGR children are at a higher risk of hypertension in adulthood, and the prevalence of the metabolic syndrome and CVD may then be secondary to this condition( Reference Gortnel 26 ). Other authors have observed that there is a positive relationship between an increase in BP values in young people and a history of low birth regardless of being obese or achieving the catch-up growth( Reference Levitt, Lambert and Woods 27 ). Both poor fetal and accelerated postnatal growth are associated with the programming of hypertension and risk of CVD( Reference Myrie, McKnight and Van Vliet 28 ). As far as premature neonates may as well exhibit an increase in BP levels resulting from the nutritional support received, whether the programming of BP levels occurs before or after birth is difficult to ascertain( Reference Singhal, Cole and Fewtrell 29 ). Nutritional deficit may be a direct consequence of EUGR. Although there are no data on children with altered growth at the extra-uterine perinatal stage, our findings indicated that prepubertal children with EUGR had higher BP values than the reference group, even after adjustment – some had values within the range of hypertension (Table 1 and Fig. 1). These children were followed up on an outpatient basis for the evaluation of their condition and treatment.
As concerns inflammatory biomarkers, small-for-gestational-age neonates have elevated CRP, IL-6 and TNF-α concentrations in cord blood when compared with the normal-weight-for-gestational-age infants( Reference Amarilyo, Oren and Mimouni 30 ). Hence, EUGR neonates might exhibit changes in the adipose tissue, the inflammatory and metabolic mechanisms induced by the specific nutritional support received during the first few days of life to rapidly achieve the catch-up growth. Inflammatory markers such as CRP and PAI-1 are involved in the perinatal stress physiology, which is likely to affect adipose and brain tissue caused by the adaptation to extra-uterine life in neonates with IUGR( Reference Boutsikou, Mastorakos and Kyriakakou 31 ). This along with the fact that infants with EUGR develop severe nutritional deficit in the first few weeks of birth might also induce changes in the adipose tissue. This would possibly account for the increase in the concentrations of inflammatory biomarkers (except IL-6 and PAI-1) observed in the EUGR group (Fig. 2).
TNF-α, HGF, IL-6, IL-8, MCP-1 and PAI-1 are also considered adipokines as they are produced by the adipose tissue and act on inflammation( Reference Kershaw and Jeffrey 32 ). Therefore, MCP-1 is a proatherosclerotic factor predominantly synthesised by macrophages and endothelial cells( Reference Kanda, Tateya and Tamori 33 ). PAI-1 is considered an acute-phase reactant with antifibrinolytic properties that regulates the coagulation cascade. The levels of PAI-1 secreted by the liver and vascular cells as well vary significantly( Reference Boutsikou, Mastorakos and Kyriakakou 31 ). In the chronic low-grade inflammatory state, the increase in IL-6 concentrations is generally mild, rising CRP concentrations and stimulating the synthesis of other pro-inflammatory cytokines such as MCP-1( Reference Hoene and Weigert 34 ). This increase along with the fact that we are dealing with prepubertal children, and using a method to analyse multiple parameters different from ELISA, may generate minor changes in IL-6 and PAI-1 concentrations in the EUGR group when compared with the reference group. On the one hand, CRP is considered to be the major acute-phase reactant in humans and has high sensitivity to inflammation( Reference Boutsikou, Mastorakos and Kyriakakou 31 ). The concentrations of CRP in the EUGR group were higher than those in healthy group (Fig. 2(e)), similarly to the previously described adipocytokines. CRP is secreted primarily by hepatocytes in response to IL-6 and TNF-α and induces the expression of PAI-1, IL-6, TNF-α and MCP-1( Reference Berg and Scherer 35 ). However, data indicated that there was a positive association between this protein and IL-6 (Table 2).
On the other hand, we measured the concentrations of HGF and NGF, as well as they are growth factors considered to be adipocytokines. Previous studies have reported that CRP( Reference Masi, Jones and Charakida 36 ), HGF( Reference Nakatsukasa, Masuyama and Akahori 37 ) and NGF( Reference Malamitsi-Puchner, Nikolaou and Puchner 38 ) concentrations are associated with GA. NGF is a protein synthesised and secreted by mature adipocytes that also modules inflammation and is essential for the development and maintenance of the sympathetic nervous system( Reference Ryan, German and Wood 39 ). The plasma concentrations of NGF were not increased, although they were positively correlated with some of the inflammatory markers analysed in the present study (Table 2). HGF is synthesised and secreted by adipose mesenchymal cells and expressed by apoptotic cells and acts as a chemoattractant for tissue-committed stem cells with regeneration potential( Reference Vogel, Trapp and Börger 40 ). TNF-α prompts the secretion of both factors into the adipose tissue, and HGF stimulates the secretion of IL-8 and PAI-1( Reference Ryan, German and Wood 39 , Reference Vogel, Trapp and Börger 40 ). Higher plasma concentrations of HGF were detected in the EUGR group (Fig. 2(b)). We observed that HGF correlated with all the biomarkers with the exception of NGF (Table 2). Thus, the outcomes indicate that HGF may have a major role in the different inflammatory pathways in which other adipocytokines are involved.
TNF-α, mainly secreted by the macrophages infiltrated in the adipose tissue, is highly pro-inflammatory( Reference Cawthorn and Sethi 41 ) and induces the production of CRP in the liver( Reference Palomo, Alarcón and Moore-Carrasco 42 ) and the secretion of other pro-inflammatory cytokines such as IL-6, IL-8( Reference Malamitsi-Puchner, Nikolaou and Puchner 38 ), PAI-1, MCP-1, NGF( Reference Berg and Scherer 35 ) and HGF( Reference Vogel, Trapp and Börger 40 ). In the present study, correlations between TNF-α and these biomarkers were found in children with EUGR (Table 2), suggesting that TNF-α may play a major role in the inflammation cascades that occur in numerous pathologies( Reference Codoñer-Franch, Tavárez-Alonso and Murria-Estal 43 ) and possibly in EUGR children. Indeed, the multiple linear regression analysis indicated that the plasma concentrations of TNF-α were positively related to HGF and MCP-1 concentrations and negatively related to HDL concentrations, as has been described previously in different conditions( Reference Lee, Gungor and Bacha 44 , Reference Rubin, McMurray and Hackney 45 ). The present study reveals that there is a strong association between an increase in TNF-α concentrations and a history of neonatal EUGR (Table 4).
After adjustment for GA, birth weight and length, TNF-α concentrations remained significantly higher in the EUGR group than in the reference group. These findings suggest that TNF-α may be a pro-inflammatory biomarker with the strongest association with EUGR, even at the prepubertal stage. Factorial analysis revealed that all parameters –except CRP – were involved to a certain extent in the low-grade inflammatory state found in the prepubertal EUGR group (Table 3). In addition, TNF-α, HGF and MCP-1 appear to be the adipocytokines with the highest influence and strongest correlation with the biomarkers analysed in the present study (Table 2). This outcome supports the hypothesis that the adipose tissue may play a major role in the metabolic and inflammatory state of children with a history of EUGR.
We observed associations among the various inflammatory biomarkers, which indicates common syntheses or actions even though these molecules may be involved in different mechanisms; that is, mature macrophages prompt inflammatory processes by segregating MCP-1, TNF-α, IL-6 and IL-1 and the excretion of CRP from the liver( Reference Márcos-Gómez, Bustos and Prieto 46 ). Moreover, an increase in PAI-1 concentrations has been described in different metabolic states( Reference Boutsikou, Mastorakos and Kyriakakou 31 , Reference Berg and Scherer 35 ), and PAI-1 concentrations have also been reported to be associated with molecules such as TNF-α and CRP, as PAI-1 is up-regulated as a response to chronic increased TNF-α and CRP concentrations( Reference Huber 47 ). However, PAI-1 concentrations were not overexpressed or associated with TNF-α and CRP concentrations in the EUGR group. On the contrary, IL-6, IL-8, MCP-1, NGF and HGF concentrations were correlated (Table 2) as described previously in other studies( Reference Lee, Gungor and Bacha 44 ). These changes and associations in inflammatory biomarkers, already present in prepubertal children, could prevail at later stages and reach pathological values contributing to disease. This means that at the perinatal stage, not just in the case of intra-uterine conditions, there might be a functional alteration in adipocytes as observed in neonates with low birth weight for GA( Reference Maiorana, Del Bianco and Cianfarani 6 ) and at later stages( Reference Meas 19 ). Metabolic, inflammatory and cardiovascular changes might be induced by premature birth( Reference Narendran, Visscher and Abril 48 ), although the majority of authors suggest that the main risk factor for CVD and diabetes in adulthood is abnormal growth in childhood – especially IUGR( Reference Meas 19 , Reference Rogers and Velten 21 , Reference Dalfrà, Pacini and Parretti 22 , Reference Bie, Oostrom and Delemarre-Van de Wall 49 ).Owing to this, EUGR might also be a risk factor for the development of these diseases.
In conclusion, our findings suggest that prepubertal children with a history of EUGR may have abnormal growth, higher BP levels and higher plasma concentrations of pro-inflammatory biomarkers when compared with healthy children. Nonetheless, further comparative studies among different groups of full-term and premature neonates should be conducted in later ages to evaluate the potential damage of metabolic, nutritional and pro-inflammatory changes induced by this condition. It should be emphasised that a clinical follow-up be performed in childhood to prevent later alterations associated with EUGR.
Acknowledgements
The present study was supported by the 12th Prize for Nutrition Research, awarded by the Spanish Pediatric Association.
The authors' contributions are as follows: M. O.-E., J. L. P.-N., J. O.-M., M. C. M.-V., C. M. A.-G. and M. G.-C. formulated the research questions; M. O.-E., J. L. P.-N. and M. G.-C. designed the study; M. O.-E., J. L. P.-N., J. O.-M., M. C. M.-V., C. M. A.-G. and M. G.-C. carried out the study; M. O.-E., J. L. P.-N., M. C. M.-V. and M. G.-C. analysed the data; M. O.-E., J. L. P.-N. and M. G.-C. wrote the article. All authors read and approved the contents of the manuscript.
None of the authors has any conflicts of interest to declare.


