


The growing global burden of non-communicable diseases
Non-communicable diseases (NCD) represent the leading causes of global mortality, accounting for more deaths than all other causes combined. They have been shown to hit hardest in the world's low- and middle-income countries (LMIC) and populations, putting already weak and overburdened health systems under considerable strain( Reference Alwan, Maclean and Riley 1 ).
Accounting for the brunt of the NCD burden, CVD is the leading cause of deaths globally. While the CVD epidemic is receding in high-income countries, CVD mortality rates tend to be higher and are generally increasing in LMIC, where 80 % of the estimated 17 million CVD-related deaths occur globally per year( 2 , 3 ). The most important risk factor for CVD is elevated blood pressure, which is estimated to cause 7·5 million deaths annually, the equivalent of about 12·8 % of all deaths worldwide( 4 ).
The causal link between salt intake and hypertension is well established, as is the role of salt as a major determinant of population blood pressure levels( Reference He and MacGregor 5 – Reference Dyer, Elliott and Shipley 7 ). Furthermore, evidence supports the positive impact of reduced salt consumption in a corresponding reduction in blood pressure( Reference Appel and Anderson 8 , Reference Aburto, Hanson and Gutierrez 9 ). Given the elevated levels at which salt is consumed in the WHO European Region, centrally implemented national salt reduction strategies represent a highly cost-effective tool to reduce CVD risk and tackle the growing burden of NCD( Reference Beaglehole, Bonita and Horton 10 – Reference Asaria, Chisholm and Mathers 13 ).
Global and regional salt reduction initiatives
The WHO has recognized excess dietary salt intake as a global problem, and is working to facilitate salt reduction in countries worldwide. In 2003, WHO, in conjunction with the FAO of the UN, set a worldwide target of less than 5 g salt/d per person( 14 ), based on an extensive review of available evidence( Reference He and MacGregor 5 ). Since 2006, WHO has been supporting the development of national salt reduction strategies by establishing networks in partnership with regional organizations worldwide, including in the WHO European Region where a European Salt Action Network (ESAN) has been established involving twenty-seven countries facilitated by the WHO Regional Office for Europe.
Following a WHO technical meeting on ‘Reducing Salt Intake in Populations’ in Paris in 2006, recommendations were drafted to encourage the construction of national salt reduction programmes around three essential pillars: (i) product reformulation; (ii) consumer awareness and education campaigns; and (iii) environmental changes( 15 ). The corresponding actions to support achievement of these three recommendations can be summarized in eight essential steps (the first four of which are preliminary)( Reference Penney 16 ):
-
1. organizing support to mobilize for change;
-
2. environmental scanning;
-
3. setting targets (national dietary guidelines on salt);
-
4. planning the campaign and engaging partners for implementation;
-
5. consumer awareness campaigns;
-
6. use of labelling to highlight the salt content of foods, and symbols/logos/text to identify low-salt products;
-
7. negotiating agreements with the food industry, catering industry, food retailers and restaurants to lower the salt content of a wide range of products; and
-
8. monitoring progress, continuous revision and evaluation.
In 2008, the European Union (EU) High Level Group on Diet, Physical Activity and Health developed a Framework for National Salt Initiatives, approved and adopted by EU Member States( 17 ). The overarching aim of the EU Framework is to support EU Member States towards achieving the WHO target salt intake of 5 g/d; as in the eight-step framework, the designated strands of activity are simultaneous and interconnected:
-
• data collection;
-
• establishing minimum benchmarks for major food categories;
-
• developing a nutrition labelling scheme that is consistent across EU countries;
-
• identification of a shortlist of twelve food categories that represent the largest potential opportunity for impact, from which countries must select at least five on which to focus;
-
• raising public awareness;
-
• industry engagement towards reformulation;
-
• a recognition of the need to reduce salt in foods at all price levels so that salt reduction benefits everyone; and
-
• monitoring and evaluation of actions and reformulation( 17 ).
The framework also established a common minimum European benchmark for a 16 % salt reduction from baseline 2008 levels over four years, to be realized across all food products in EU Member States.
Social inequalities and salt
The complexities of the shifting global dynamics in demographics, epidemiology and nutrition notwithstanding, one persistent trend spans the transitions: inequalities continue to grow through widening gaps in the distribution of key social determinants of health (e.g. secure employment and working conditions, income levels). Diet in particular has been implicated in the complex origins of the overall poorer health of those in lower socio-economic groups. In this way, income inequalities resulting in poor nutrition can create and exacerbate overall health inequalities.
The extent to which the quality of food intake quality is affected by socio-economic variables is confirmed by evidence coming not only from LMIC but from across the EU Member States as well( Reference Shaw, Dorling and Davey Smith 18 ). Specifically, studies have established that members of higher socio-economic groups typically consume more within the modern recommended food groups (e.g. vegetables and fruit) but less within the traditionally recommended categories of food (e.g. bread and potatoes)( Reference James 19 , Reference Roos and Prättälä 20 ). More recently, the 2007 Low Income Diet and Nutrition Survey, conducted by the UK's Food Standards Agency, found that individuals on low incomes were generally less likely to consume wholemeal bread and vegetables, but were more likely to consume fat spreads and oils, non-diet soft drinks, pizza, processed meats and table sugar( Reference Nelson, Erens and Bates 21 ).
Stemming from these patterns of dietary inequality, nutritional inequality has also been demonstrated in a number of studies. Regarding salt consumption, in the 2000–01 National Dietary and Nutrition Survey in Britain, salt intake was higher in low socio-economic groups after allowing for geographic gradients( Reference Ji, Kandala and Cappuccio 22 ). It has been proposed that higher salt intakes among the lower socio-economic groups amplify blood pressure levels and the risk of CVD. Poor fruit and vegetable consumption in this same population reduces potassium intake, another factor linked to high blood pressure( Reference James 19 , Reference van Bommel and Cleophas 23 – Reference Aburto, Hanson and Gutierrez 25 ). Targeted preventive approaches to behavioural changes in low-income groups are unlikely to deliver sufficient improvements in number of portions consumed( Reference Steptoe, Perkins-Porras and McKay 26 , Reference Cappuccio, Rink and Perkins-Porras 27 ). Similarly, foods rich in long-chain n-3 PUFA (e.g. nuts or fish such as herring, tuna, sardines and wild salmon), which can limit sudden death from cardiac arrhythmia, may not be readily accessible to lower socio-economic groups( Reference London, Albert and Anderson 28 ).
Inequalities in nutritional and economic status translate ultimately into inequalities in health. One study comparing data from the Health Survey for England 1996 with data from the Health Survey for England 2006 indicates a greater increase in obesity among low-income households compared with high-income households( Reference Howe, Tilling and Galobardes 29 ). Unfortunately, there is evidence to suggest that the patterns in diet-related health inequality are only worsening( Reference Wardle and Boniface 30 ).
Significantly, Clark and colleagues( Reference Clark, Duncan and Trevoy 31 ) have proposed that food consumption is not simply a matter of knowledge or rational choice for individuals of low socio-economic status, but rather is constrained by an ever-present sense of scarce resources and the need to prioritize other daily expenses perceived as being more important than a healthy diet. In this regard, food choice is not a separate or distinct element of life, but rather something embedded in lives characterized by stress arising from the need to continually reconcile scarce resources to meet a range of basic needs( Reference Clark, Duncan and Trevoy 31 ). For example, a 2009 study that explored the views of ethnically and socio-economically diverse shoppers in New Zealand about the acceptability of economic incentives to promote healthier food purchases found that cost was the single most important influence on food purchases and participants were most interested in economic incentives for the fruit and vegetables group( Reference Ni Mhurchu, Eyles and Dixon 32 ). Global work on diabetes, equity and social determinants identified improving diet in disadvantaged populations as an important entry point, with action required at societal as well as individual level in order to change the broader food and/or obesogenic environment( Reference Whiting, Unwin and Roglic 33 ).
Within the WHO European Region, the concept of food choice as a reflection of scarce resources is reflected in regional variations in the percentage of disposable income spent on food. Comparing the Eastern European region with the EU, up to 60 % of disposable income is spent on food in the Eastern European states, compared with 22 % in the EU( 34 ). The problem thus appears to lie largely in the environment in which food choices are made – in that the cheapest foods (e.g. ready-made and fast foods) tend also to be those with the poorest nutritional values and profiles. In this way, social inequalities are translated into nutritional and, ultimately, health inequalities, with levels of salt consumption factoring heavily into the equation. Hence, despite progress in improving health indicators in many countries, inequalities in health status – both between and within countries – remain large( 17 , 35 ).
Ultimately, the link between CVD and poverty is bidirectional( 36 , Reference Stuckler 37 ). In most countries, CVD hits hardest among the poor, who have greater risk factor exposure, tend to have more difficult access to health care and have less financial resilience to cope with the costs of disease management( 38 ). This has major collateral consequences at the household level( 39 ). In line with this pattern, it is now widely recognized that the rise of NCD is a major barrier to social and economic development( 40 ). This underlines the need to address social determinants and equity issues when designing programmes and health policy to reduce NCD not only in LMIC, but also in low-income groups within rich countries( 36 , 40 ).
At the country level, too, several studies have examined the general link between NCD and economic prosperity. A review undertaken in 2006, for example, found the cost of chronic diseases and their risk factors to be ‘significant and sizeable’, ranging from less than 1 % to nearly 7 % of national Gross Domestic Product( Reference Suhrcke, Nugent and Stuckler 41 ). Another study of twenty-three LMIC with high NCD burdens found that, without significant reductions in the NCD risk, an estimated $US 84 billion of Gross Domestic Product would be lost between 2005 and 2015 due to just three NCD: CVD, diabetes and stroke( Reference Abegunde, Mathers and Adam 42 ). Another study found that for every 10 % increase in NCD-related mortality, annual economic growth would be reduced by 0·5 %, an estimate that prompted the World Economic Forum to rank NCD as one of the top global threats to economic development internationally( Reference Beaglehole, Bonita and Horton 10 ).
Against this backdrop, there is evidence that population-based approaches and policies may inadvertently widen inequalities within a population (e.g. where the intervention is of greater benefit to more advantaged groups in the population – as measured by level of education, income, etc. – than to disadvantaged groups)( Reference Lorenc, Petticrew and Welch 43 , Reference Benach, Malmusi and Yasui 44 ). Many population-based health interventions are cost-effective and can have a rapid impact on the burden of disease at the population level; for example, raising taxes on tobacco, restricting access to retailed alcohol and reducing the salt intake and salt content of food. However, attention needs to be paid to the differential impact on different segments within the population including socially disadvantaged groups( Reference Shankar, Brambila-Macias and Traill 45 , Reference Sutherland, Edwards and Shankar 46 ), particularly where there are potentially high levels of inequality within the country. Data about differential impact are important to ensuring the effectiveness of population-based initiatives in terms of coverage and impact (i.e. reaching all groups in the population).
Hence, the present study was undertaken to identify and review national policies related to salt reduction among countries belonging to the WHO European Region. With a view to gauging the broader implications, the presence of such policies was assessed against the backdrop of varying levels of human development adjusted for inequalities in income, education and health (longevity). Our literature review thus sought to shed light on the potential linkage between national salt reduction initiatives and prevailing social inequalities among the European Member States. In doing so, we aimed to reflect on and contribute to ongoing debates surrounding salt reduction policy strategy development and implementation at national, regional and global levels.
Methods
Data collection
Evidence was mined from the data management website for the WHO European Database on Nutrition, Obesity and Physical Activity (NOPA), which compiles information for the WHO European Member States to monitor progress on nutrition, diet, physical activity and obesity. The available country information includes national and sub-national surveillance data, policy documents, action to implement policy and examples of good practice in programmes and interventions. Consultation on NOPA was used to identify relevant national policies related to salt reduction.
Additional information on existing salt reduction initiatives was compiled through electronic communication with the WHO Nutrition Counterparts in the European Member States. To this end, a written request for information was dispatched via email through the WHO Regional Office for Europe to the appropriate representative in each Member State. When a response was not received after 2 months, a direct telephone call was made to follow up. A total of forty-three countries replied to requests for up-to-date information regarding the existence and extent of current salt reduction activities being implemented at the national level, as well as those planned for future implementation.
Relevant electronic databases including biomedical and health science, social science, health policy, nutrition and WHO regional databases were searched until April 2012 using a pre-determined search strategy. Bibliographies of those papers containing pertinent information on national salt reduction policies in place among the European Member States at the time of review were then searched by hand to identify any further relevant references, which were subject to the same screening and selection process. Identified references were screened independently by two reviewers using a three-stage approach: selecting studies deductively first at the title (Stage 1), then at the abstract (Stage 2) and finally at the article content (Stage 3) level based on relevance to our objectives. All types of evaluative study designs were eligible for inclusion; studies were not selected based on methodological quality. Purely theoretical models and historical recapitulation, meanwhile, were excluded, as our goal with this review was to provide conclusions based on empirical data.
Governmental websites pertaining to the Ministry of Health, National Public Health Institutes, Ministry of Sanitation and Welfare or any other pertinent governmental agencies were hand searched in order to identify additional national policies or initiatives. Websites of non-governmental organizations, scientific associations and any other credible source involved with salt reduction initiatives either nationally or internationally were also consulted.
Finally, technical reports from government agencies or scientific research groups, working papers from taskforce groups or committees, as well as white papers or preprints were also included. Reports from the European Commission, WHO and the Collaborative Action for Risk Factor Prevention and Effective Management of NCDs (CARMEN) were further consulted.
Data analysis
Information related to the five key elements of the EU framework as well as the eight essential steps proposed by WHO was extracted from the multiple data sources. Key characteristics from each country were placed in a matrix encompassing five elements: (i) current national initiative; (ii) baseline assessment; (iii) consumer awareness; (iv) labelling; (v) industry involvement; and (vi) monitoring and evaluation initiatives. Current national initiatives were classified as ‘fully implemented’, ‘partially implemented/planned’ or ‘non-existent’ depending on the elements contained within the salt reduction plan, based on the previously mentioned salt reduction frameworks.
As a measure of actual levels of human development (taking prevailing inequalities into account) achieved within Member Nations, we used United Nations Development Programme data on the Inequality-adjusted Human Development Index (IHDI) scores for each country. While the UN Human Development Index (HDI) is a combined measure of the national average of health, education and income, the IHDI goes one step further. Beyond the average measure for each dimension within a country, this measure reflects how the achievements in health, education and income are distributed across the population. The higher the level of inequality, the greater will be the decrease in the value of each area (health, education and income) depending on the level of inequality.
In this way, the IHDI accounts for inequalities in human development that may exist across a population within the same country. Hence, the IHDI will be the same as the HDI in the case that there is no inequality in the population but is less than the HDI as inequality increases. Taking this into account, the IHDI is the actual level of human development as it accounts for inequality, while the HDI can be viewed as an index of ‘potential’ human development that could be reached if there was no inequality. The ‘loss’ in potential human development due to inequality is thus given by the difference between the HDI and the IHDI( 47 ).
Statistical analysis of such data was performed using the statistical software package SPSS version 18 for Macintosh. The grouped samples were examined for normality and homogeneity of variance, consistent with assumptions for univariate ANOVA. One-way ANOVA methods were then used to estimate the mean differences in IHDI scores in relation to the different levels of national salt initiative implementation (none, partially implemented/planned, or fully implemented) across countries in the WHO European Region. In addition, as exploratory analysis, the post hoc Tukey Honestly Significant Difference test was performed to make pairwise comparisons between groups. Results of statistical tests were regarded as statistically significant if the associated P values were less than 0·05. In this way, we sought to broadly identify any potential patterns between the IHDI and the status of the country's salt reduction initiative.
Results
In the WHO European Region, twenty-six of the fifty-three Member States have operational salt education policies in place. In some Member States, however, activities are carried out by advocacy groups or research institutions even though formal salt reduction policies are absent at the national level.
When it comes to the existence of baseline assessment data, thirty Member States have carried out activities in this area – whether it is by urine analysis (namely 24 h urine collection), dietary intake survey or salt levels in food categories. In total, thirty-two Member States have initiated some form of consumer awareness activity, either through a governmental programme or through the involvement of a non-governmental advocacy organization, rarely by industry( Reference Cappuccio, Capewell and Lincoln 11 , Reference Webster, Dunford and Hawkes 48 ) (Table 1).
Table 1 Current status of salt reduction initiatives within the WHO European Region Member States
✓, fully implemented; ○, partially implemented/planned; ✗, no action; –, data unavailable.
Labelling activities have been carried out or are planned in sixteen Member States and vary in terms of being voluntary or regulated by legislation. Industry involvement was found to be voluntary in the majority of cases and spanned a variety of activities including food reformulation and producing toolkits for the general public as part of corporate responsibility initiatives.
Monitoring and evaluation activities were planned or carried out in twenty-four Member States in the form of urine analysis, sampled commercial food products and campaign awareness effect measurements. Voluntary self-reporting by industry was also described. However, no action or monitoring of food trade flows with regard to salt was reported by any of the Member States, nor was any such coordination identified in the literature review.
In comparing the country IHDI against the current status of the national salt reduction initiative, we found that countries classified as having no existing initiative (Category 1) tend to be lower on the IHDI scale (i.e. they have lower mean levels of actual human development due to inequality and other factors) than those with partially implemented/planned or fully implemented initiatives (Fig. 1). However, as depicted in Fig. 1, two countries bucked this trend notably: Germany (with a high IHDI score and no national salt reduction initiative) and Turkey (with a low IHDI score and a fully implemented national salt reduction initiative).
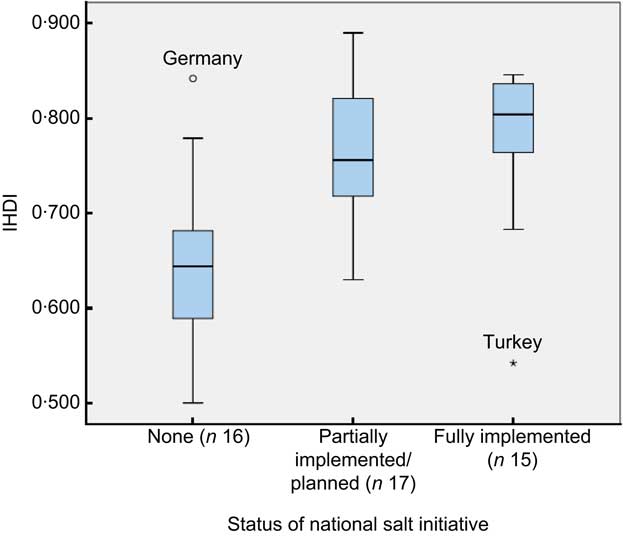
Fig. 1 (colour online) Box-and-whisker plot showing Inequality-adjusted Human Development Index (IHDI) by current status of the national salt initiative within Member States of the WHO European Region (n 48; five countries (Andorra, Malta, Monaco, San Marino and Turkmenistan) excluded due to missing IHDI data). Middle line in the box represents the median; the bottom and lower edges of the box represent the interquartile range (IQR; 25th to 75th percentile); the whiskers represent the range; ○ is an outlier; and ▯ is an extreme value
One-way ANOVA showed a significant difference in IHDI based on the different levels of salt initiative implementation. Specifically, the post hoc Tukey Honestly Significant Difference test indicated that IHDI values among countries with no existing salt reduction initiatives (mean 0·643 (se 0·022)) were significantly lower than for those with either partially implemented/planned salt initiatives (mean 0·766 (se 0·017), P < 0·001) or fully implemented salt initiatives (mean 0·780 (se 0·021), P < 0·001). However, no significant difference in IHDI values was detected between countries with partially implemented/planned salt initiatives as compared with fully implemented salt initiatives (P = 0·867).
Overall, countries with greater financial resources seemed to correspond with those presenting more mature salt reduction initiatives. At the same time, several champion examples (Bulgaria, Estonia, Hungary and Turkey, for example) have demonstrated that national initiatives are not the exclusive province of the generally more affluent Western European region, and salt reduction initiatives have also gained importance on the political agenda in countries labelled as low- or middle-income by World Bank classifications.
Discussion
Breaking the cycle
The findings of the present study underline a clear link between national salt initiatives and levels of inequality-adjusted human development across the WHO European Region. Given the socio-economic disparities surrounding salt intake( Reference Ji, Kandala and Cappuccio 22 ) and the established health benefits of dietary salt reduction( Reference Appel and Anderson 8 , Reference Aburto, Hanson and Gutierrez 9 ), this observed tendency towards limited policy responses on salt among less developed, resource-limited countries is troubling – and highlights a major missed opportunity. Without adequate attention, such gaps are liable to feed into widening health and social inequalities (Fig. 2). On the other hand, wider application of population-level salt reduction programmes presents a potentially cost-effective, if not cost-saving, path to reducing CVD burdens across population strata( Reference Bibbins-Domingo, Chertow and Coxson 12 , Reference Asaria, Chisholm and Mathers 13 ), both nationally and at the global level.
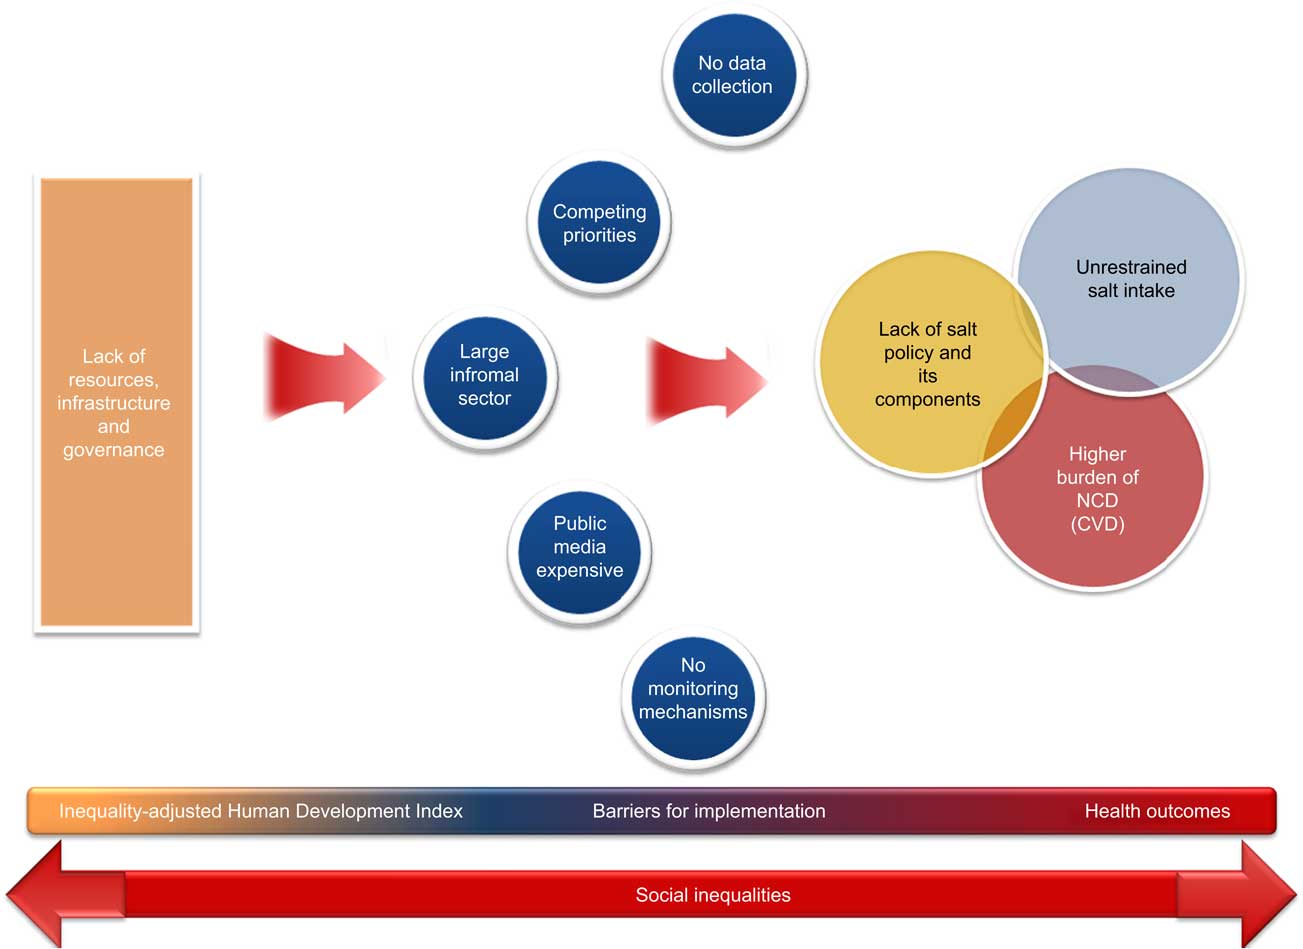
Fig. 2 (colour online) Flow diagram depicting a model for the interaction of factors driving the link between national salt initiatives and inequality-adjusted human development. An interruption of the cycle can only be achieved by means of effective interventions targeting the general population towards narrowing the gaps (NCD, non-communicable diseases)
Of course, the concept of expanding salt reduction recommendations from high-risk groups to the general population has not been without controversy. A vibrant debate is ongoing in health research and action communities concerning the potential effectiveness of public policy in regulating salt intake. In particular, uncertainties stemming from the difficulties in evaluating population-targeted interventions in randomized controlled trials remain( Reference Kroke, Boeing and Rossnagel 49 ). Some authors have suggested, for example, that efforts to effect sodium reduction in the general food supply could be offset by consumers’ discretionary salt use( Reference Alderman 50 , Reference McCarron, Geerling and Kazaks 51 ), although no direct evidence to support such compensation for reduced-sodium foods exists( Reference Benach, Malmusi and Yasui 44 , Reference Beauchamp, Bertino and Engelman 52 ). On the other side, numerous expert advisory panels – including those convened both independently and by government agencies – have consistently and repeatedly concluded, after careful evaluation of the available data and stakeholder concerns, that the evidence and public health concerns warrant worldwide implementation of a strategy of gradual salt intake reduction at the population level( Reference Appel and Anderson 8 , Reference Beaglehole, Bonita and Horton 10 , Reference Cappuccio, Capewell and Lincoln 11 , Reference Alderman 50 , 53 ).
Challenges and barriers to change
When developing salt reduction policies, it is important to acknowledge that each country faces a host of challenges and barriers that come with implementing, executing and assessing any national intervention, as our review and analyses have highlighted. Countries may have limited capacity and resources to implement new programmes. Baseline data needed to guide policy, for instance, is not always readily available. The 24 h urine test method regarded as the gold standard for assessing salt intake is simply beyond the resource capacity of many countries. On the other hand, experience has demonstrated that, while there are some fixed costs that come with urinary studies, the majority of the associated financial output is accounted for by administrative aspects (e.g. human resources)( 34 , Reference Ji, Sykes and Paul 54 ). Regarding the minimum sample size, the Pan American Health Organization/WHO recommends, based on available evidence, that countries plan for samples of at least 150–200 participants for each population stratum of interest (i.e. disaggregated by sex, region, socio-economic status, etc.) to achieve valid results for tracking impacts( 6 , 55 ).
Other barriers countries may face in implementing national salt reduction strategies include a lack of available data on salt content of manufactured foods. Moreover, many countries may not have the capacity to perform a comprehensive food analysis to assess the salt levels of the main food categories. In many developing countries, the informal sector plays an important role within the food industry. The salt content of food sold in this sector, such as by individual street vendors, is variable, as the relevant actors may not be prepared to set recipes and standards( 34 ).
By the same token, salt reduction strategies may not always make it on to the list of key priorities within a government agenda. Countries may be faced with a plethora of competing priorities, and thus may not be able to allocate sufficient resources to salt reduction activities within their national strategies. Germany, for example, has to date not pursued a national salt initiative, citing a ‘lack of convincing evidence’ for putting salt on the agenda; based on national nutrition surveys, salt intake in Germany is regarded as relatively low and thus not a priority for intervention( 15 ).
Similarly, advocacy groups in the form of consumer organizations are not always present in low-resource settings and, even where present, may not have sufficient influence to drive the political agenda. Public awareness campaigns, meanwhile, can be expensive, especially when it comes to traditional forms of media such as television airtime and printed media – and, moreover, may not even be effective, especially for low-income groups, in the absence of supportive structural mechanisms for action (e.g. availability of affordable low-salt bread in Turkey). Even when resources are available, countries may not have sufficient experience in running public awareness initiatives.
Beyond these key internal dynamics, the importance of a solid structure for governance capable of responding in a proactive, timely and effective manner to activities such as trade flows – which have the potential to undermine a national salt reduction initiative and widen inequalities – must also be considered. The current analysis has identified that food trade flows and their potential health equity impacts have not been addressed as part of any salt reduction policy at the European level. A key example is bread importation–exportation. Countries with a fully implemented salt reduction policy have on certain occasions imported large quantities of foods high in salt from other Member States with no or limited salt reduction policies set in place.
Finally, although cost-effectiveness modelling has highlighted potential societal and medical savings through reduced hypertension and related CVD( 47 ), estimating reformulation costs remains problematic( Reference Webster 56 ). While reformulation is a common event, it is usually done to reduce the cost of producing foods, and the savings derived from production cost reductions typically cover the costs of research and development( Reference Kramer 57 ). As salt is a relatively inexpensive ingredient, there may be few profits derived from reformulation in this arena. Moreover, to aid manufacturers in maintaining safety, government agencies, trade associations and research institutions may need to work with food processors to avoid reformulations that might heighten the risk for food-borne disease( 53 ).
It is important to acknowledge that the proposed salt reduction strategies will entail substantial investment by both industry and government. In this context, there is a clear need, especially in developing countries, for accurate information on the full costs and cost-effectiveness of initiatives to reduce sodium intake, along with a clear understanding of what is involved in implementing and scaling up these population-level strategies. Despite lingering uncertainties over the costs, given the stated magnitude of the benefits, the social benefit–cost ratio is ultimately likely to remain favourable to reformulation in the context of salt reduction initiatives( Reference Webster 56 ).
The politics of salt: controversies and resistance
Although few would dispute the benefits to population health of reducing salt intake, other considerations have complicated the issue and created space for politically charged debate( Reference Cappuccio, Capewell and Lincoln 11 , Reference Cappuccio 58 ). Recognizing and tackling such issues through thoughtful coordination and regulatory measures is critical to effective programme implementation at the national level.
In the public health community, concerns have been raised that initiatives to reduce dietary salt could adversely impact programmes to prevent iodine deficiency disorders, as prevention strategies for iodine deficiency disorders rely primarily on the fortification of salt( Reference Verkaik-Kloosterman, van ‘t Veer and Ocké 59 ). Ultimately, salt intake can certainly be reduced without compromising micronutrient fortification( Reference Asaria, Chisholm and Mathers 13 ), but monitoring of urinary iodine is essential to adjust the levels of fortification within the goal of reducing salt consumption. At the country level, creating linkages between salt iodization and salt reduction programmes presents an opportunity that is compatible, cost-effective and of great public benefit( Reference Cappuccio, Capewell and Lincoln 11 , 60 – Reference Campbell, Dary and Cappuccio 62 ) – as evidenced by successful national salt strategies utilizing iodized salt in processed foods in the Netherlands, Belgium and Italy, for example( Reference Vandevijvere 63 , Reference Ohlhorst, Slavin and Bhide 64 ).
For various reasons, the food industry is frequently resistant to movement towards population-wide reductions in salt intake – on top of the costs of reformulation and labelling, high salt content generally makes food more palatable and hence more marketable. Governments, meanwhile, may lack the political will to take action, faced with competing chronic disease priorities, limited resources and capacity, and pressure from the food industry lobbies. Yet success stories can be found. In the UK, for example, media campaigns and voluntary agreements with the food industry have already achieved a 1 g reduction in salt consumption, and even greater reductions might be entirely feasible through more muscular regulatory approaches. To wit, the 6 g reductions in Finland and Japan were achieved in spite of discordant cultural traditions and resistance from the industry( Reference He and MacGregor 65 , Reference Laatikainen, Critchley and Vartiainen 66 ).
Moving forward: minding the gaps
Population-based salt reduction initiatives are a critical part of the public health effort to tackle NCD both in terms of mortality and morbidity. To enable improved population coverage and impact, it is important that national salt reduction initiatives are designed, implemented and monitored with regard to their differential impact on different socio-economic groups in the population. While there is debate about the most effective entry point for population gain, global evidence indicates that it is about ensuring that the environmental and structural mechanisms are in place to enable people to make and sustain positive health behaviours( Reference Blas and Sivasankara Kurup 67 ) such as salt reduction at the individual level: making healthy choices the easier choices( 68 ).
An equity focus in the design, implementation and monitoring of national salt reduction initiatives is therefore about identifying whether some groups in the population are more likely to be differentially exposed to higher salt intake due to their socio-economic circumstances. Where this is the case, the emphasis should be on tailoring actions within the national initiative to ensure that such groups can benefit equally from the national initiative – for example, through regulation to ensure that low-salt bread and other products do not cost more than the standard food products, as well as through raising public awareness( Reference Cappuccio, Capewell and Lincoln 11 , Reference Cappuccio 58 ). As identified, an equity focus should also involve assessing the potential health impacts of trade flows (such as importation of bread) and the potential distribution of these health impacts (e.g. the imported bread with higher salt levels may cost less and therefore be purchased by those with less disposable income for food). This is important to ensuring overall policy coherence within national salt reduction initiatives.
What remains clear is that overarching strategies based on solid evidence, such as reformulations to halve the salt content of bread, should be introduced in combination with other interventions known to be effective. There are important and reasonably quick health impacts to be had. Moreover, these initiatives should target not only those groups identified as high-risk but rather the population as a whole to achieve a narrowing of social inequalities through a broad and equitable distribution of the benefits of low-salt foods( Reference Scholes, Bajekal and Love 69 ). To ensure effective impact from population initiatives, however, it is important that monitoring strategies for salt reduction initiatives explicitly consider differential impacts. This can be done through the collection and analysis of data disaggregated by age, sex and several socio-economic measures (e.g. education, income and/or place of residence). By paying due attention to social and regional disparities, effective salt reduction policies have the potential to bridge the gaps rather widen them.
Acknowledgements
Sources of funding: This research received no specific grant from any funding agency in the public, commercial or not-for-profit sectors. Conflicts of interest: The authors declare that they do not have any conflicts of interest in relation to this article. Authors’ contributions: J.B. and F.P.C contributed equally. R.R.-F., M.S. and J.B. conceived and designed the review; R.R.-F., M.S. and R.M.A. analysed the compiled data and wrote the paper; S.J.S., J.B. and F.P.C. reviewed the article and provided critical input. All authors read and approved the final manuscript.


