


Consumers are increasingly seeking out alternative sources of unprocessed foods grown and harvested in close proximity to where they live. Subsequently, the demand for locally grown agricultural goods is rising. Farmers’ markets (both seasonal and year-round), in particular, have seen a resurgence. In the early 1990s, for example, less than 2000 markets existed in the USA. By 2012, 7864 farmers’ markets had been established( 1 ).
As the farmers’ market trend continues to grow, consensus has developed around the use of farmers’ markets as a strategy to improve access to healthy, whole foods; combat food insecurity in urban areas; and potentially improve healthy eating behaviours( Reference Pitts, Wu and McGuirt 2 , Reference Holben 3 ). Federal health-related reports and published guidance, such as the 2010 Dietary Guidelines for Americans( 4 ), include language identifying farmers’ markets as an important strategy for healthful nutrition across communities, including low-income, food-insecure populations. The US Dietary Guidelines, for example, include a chapter focused on facilitating healthy choices for Americans. Two of the three principles to which the Guidelines adhere include: (i) ensuring that all Americans have equal access to nutritious foods; and (ii) facilitating individual behaviour change through environmental strategies( 4 ). The Guidelines note that communities can successfully implement these principles by improving access to healthy food outlets such as farmers’ markets( 4 – 7 ).
Despite the growing number of farmers’ markets and associated sales, recent US Department of Agriculture data suggest that only 0·15 % of money spent on food for home consumption is spent at farmers’ markets( 8 ). Similarly, Supplemental Nutrition Assistance Program (SNAP) benefits are underutilized at such venues, with only 0·016 % of all benefits occurring at farmers’ markets( 8 ). The reasons for underutilization are not fully known. However, because markets can be introduced directly within low-income areas and their potential to increase healthy food access and improve healthy food choices, researchers have recently called for the development of more local foods programmes like farmers’ markets in low-income communities and elsewhere( Reference Holben 3 , Reference Byker, Shanks and Misyak 9 , Reference Evans, Jennings and Smiley 10 ). However, little is known about what within-market factors might enhance or detract from shoppers’ experiences. The purpose of the present study was to understand, using innovative technology that captures real-time perceptions, factors that enhanced or detracted from shoppers’ experiences in an urban farmers’ market in a large metropolitan city in the USA.
Methods
Participants and procedures
We conducted a consumer-intercept study of shoppers entering an urban year-round farmers’ market in a large metropolitan city in the Southwestern USA. The market is 1·4 acres in size, contained within a single city block, and supports approximately sixty vendors selling agricultural, prepared food, artisanal and other products each Saturday. Participants were prospective shoppers 18 years of age and over entering the farmers’ market on one of four consecutive Saturday mornings during 08.00 to 12.00 hours in January and February 2012. Researchers located near the primary entrance to the market explained the nature of the study and invited shoppers to participate. Interested shoppers who provided written consent to participate were given instruction on using the Stanford Healthy Neighborhood Discovery Tool (described below), used the Discovery Tool during their shopping experience, and completed a brief demographic and psychosocial survey afterwards. Participants were given the following verbatim instructions for using the Discovery Tool during their shopping:
‘As you go about your normal shopping today, please use the device to take pictures and record your thoughts about things that you enjoy about the XXX Farmers’ Market and things that make it less enjoyable. This may include aspects of the produce, other foods, or other goods, aesthetics of the market, people at the market, entertainment, cleanliness, or other things that strike you as important for your experience at the Farmers’ Market. You are free to take as many pictures or record as many of your thoughts as you would like.’
Time to participate depended upon the length of their shopping experience but ranged from 15 to 45 min. All participants were given an incentive (e.g. tote bag) for their participation. The institutional review board approved all aspects of the study protocol.
Stanford Healthy Neighborhood Discovery Tool
The Discovery Tool is a computerized, handheld tablet-based tool operating on the Android platform. The Discovery Tool was originally developed using a community-based participatory research approach( Reference Minkler, Wallerstein and Wilson 11 ) and prompts users to capture contextual data about their environments via real-time audio narratives and photographs( Reference Buman, Winter and Sheats 12 ). The Discovery Tool supports user-generated data collection to assess active living environments( Reference Buman, Winter and Sheats 12 ). Initial implementation of the Discovery Tool revealed that users were able to reliably capture environmental features using less complex and time-intensive data collection methods than those traditionally used by trained researchers. We chose to use the Discovery Tool because: (i) the tool allows for the capture of real-time user perceptions of their shopping experience v. retrospective reporting; (ii) given the exploratory nature of the investigation, we expected a broad range of elements to emerge, and the Discovery Tool has been shown to rapidly produce consensus of key elements among users( Reference Buman, Winter and Sheats 12 ); and (iii) as an advance from traditional PhotoVoice methodology( Reference Wang and Burris 13 ), the Discovery Tool provides simultaneous photo and audio narrative capture, allowing for enhanced contextual meaning.
Data analysis
Following data collection, photographs and audio narratives were downloaded from the device and stored for later coding and data analysis. Two coders with expertise in farmers’ market research reviewed the photographs and audio narratives. Using a grounded theory approach including stages of open, axial and selective coding( Reference Charmaz 14 ), a list of potential elements was generated from the data. In a second round of coding by the same individuals, these elements were synthesized and re-organized using a deductive content analysis based upon previous literature( Reference Fehrenbach and Wharton 15 – Reference Eastwood 20 ), and positive, negative and neutral valences were assigned to each of the elements. The list was deemed conclusive using a theoretical saturation sampling technique( Reference Charmaz 21 ). Two additional coders familiar with the data collection reviewed the list of elements to ensure that they were both accurate and comprehensive. The resultant draft of the coding form was tested on a randomly selected sub-sample of the data. The four coders collectively discussed the list of elements in an effort to determine the minimum number of categories needed to adequately categorize all of the data. After a final list was determined, a web-based coding form was developed for data entry and an additional eight coders were briefly trained to complete the coding process. Data were divided evenly across eight coders such that each photograph and audio narrative was independently reviewed twice. Inter-rater reliability was good, with observed agreement for audio narratives ≥77 % and photographs ≥75 % for each coded element, and prevalence- and bias-adjusted κ for audio narratives ≥0·77 (except for social element, prevalence- and bias-adjusted κ=0·58) and photographs ≥0·83 for each coded element.
The quantitative analyses of the photographs and audio narratives were primarily descriptive. Total frequency refers to overall prevalence of each coded element, where each unique coded element was included. Total frequency allowed each shopper to contribute multiple instances of the same coded element, providing an overall frequency of the noted element. The purpose of this statistic was to provide an indicator of the overall prevalence of each coded element, and it provides insights into how often shoppers experienced a given element. Shopper-level frequency refers to the number of shoppers recording the coded element, with each shopper contributing only once to an element. The purpose of this statistic was to provide a shopper-level indicator of each coded element to represent the level of consensus among shoppers about the presence or absence of each coded element.
Results
Participants
A total of thirty-eight shoppers completed the study. The majority of the shoppers were women (65 %), 18–35 years of age (54 %), non-Hispanic White (71 %), college graduates (70 %) and had gross household annual income <$US 80 000 (72 %). Shoppers reported visiting the market at least 1–2 times/month or more frequently (71 %) and using cash or credit for market purchases (81 %).
Description of emergent elements
Shoppers captured 291 photographs (7·9 (sd 6·3) per shopper), 171 audio narratives (5·3 (sd 4·7) per shopper) and ninety-one linked photograph + audio narrative pairs (3·8 (sd 2·8) per shopper). It was possible that multiple coded elements were present in each photograph, audio narrative or photograph + audio narrative pair. Therefore, among the 553 combined photographs, audio narratives and photograph + audio narrative pairs, 748 individually coded elements were identified. Nine common elements emerged from these elements and are described in Table 1.
Table 1 Description of common elementsFootnote * from a consumer-intercept study (n 38) using the Stanford Healthy Neighborhood Discovery Tool at an urban year-round farmers’ market in a large metropolitan city in the Southwestern USA, January and February 2012
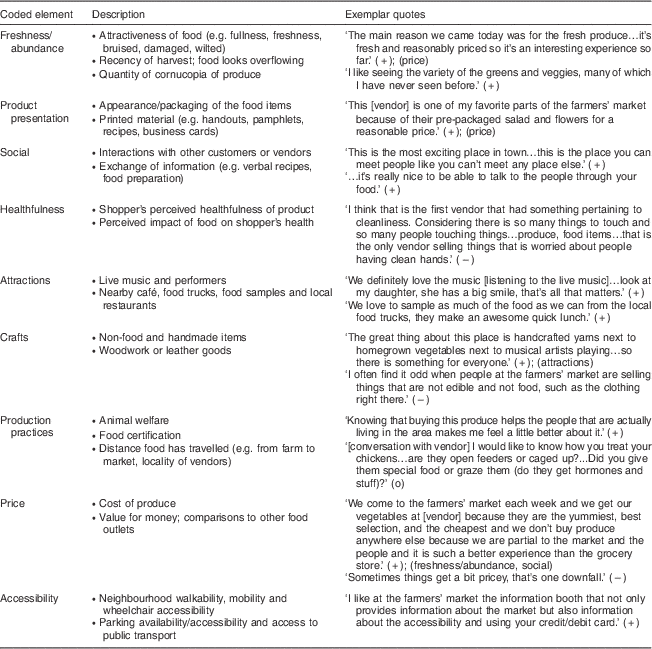
Positive (+), negative (−) and neutral (o) valences are noted following each exemplar quotation; secondary elements are noted in (parentheses) following exemplar quotations.
* Elements derived from deductive and inductive content analytic procedures.
Table 2 displays frequencies for each of the common elements. In total, elements were coded by the researchers primarily with positive (61·8 %) or neutral (32·4 %) valences, with fewer elements with a negative valence (5·7 %). The most frequently coded common elements were freshness/abundance, product presentation, social elements and attractions, respectively. Some meaningful elements (15·8 %) could not be categorized using the nine common elements and were therefore classified as ‘other’ (e.g. weather, a non-market related experience). Among the audio narratives, social elements were coded most frequently in positive and neutral valences. Freshness/abundance and attractions were also coded frequently in the positive valence. Among the photographs, freshness/abundance elements were coded most frequently in positive and neutral valences. Product presentation was also coded frequently in the positive valence. Among the audio narrative + photograph pairs, positively valenced elements were generally in line with the individually coded audio and photographic elements. Crafts were coded frequently in the negative valence (Table 2).
Table 2 Total frequency* of common elements for audio narratives, photographs and audio narrative + photograph combinations by positive, neutral and negative valences from a consumer-intercept study (n 38) using the Stanford Healthy Neighborhood Discovery Tool at an urban year-round farmers’ market in a large metropolitan city in the Southwestern USA, January and February 2012
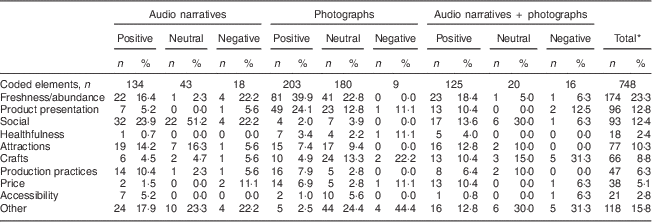
Coded elements are listed in order of total frequency.
* Total frequency refers to overall prevalence of each coded element, where each unique coded element was included.
Agreement across shoppers
Table 3 displays the level of shopper agreement for each of the nine common elements (after collapsing across audio narratives, photographs and audio narrative + photograph pairs). There was strong agreement, among positively valenced elements, for freshness/abundance as important (78·9 % of shoppers). There was also considerable agreement for the other positively valenced elements except for healthfulness and accessibility. There was no consistent pattern of agreement for neutral or negatively valenced elements.
Table 3 Shopper-level agreement for coded elementsFootnote *,Footnote † by positive, neutral and negative valences from a consumer-intercept study (n 38) using the Stanford Healthy Neighborhood Discovery Tool at an urban year-round farmers’ market in a large metropolitan city in the Southwestern USA, January and February 2012

* ‘Other’ category is not included due to high variability in elements coded to this category.
† Audio narratives, photographs and audio narrative + photograph combinations have been collapsed together.
‡ Number and percentage of participants recording the coded positive, neutral or negative element (participants noting the same element and valence multiple times were only counted once).
Discussion
Not surprisingly, results show that shoppers found freshness and abundance to be important features of the farmers’ market environment. Perhaps more interesting was that other contextual factors such as product presentation and social interactions were also deemed important both in terms of frequency of coded elements (Table 2) and consensus among shoppers (Table 3). These latter findings may provide key insights that could be harnessed to develop intervention or social marketing strategies promoting broader or more frequent market participation.
Insights regarding product presentation may be useful in encouraging consumers to purchase healthy food at markets. Product presentation that included packaging, as well as printed information regarding food products, had broad shopper agreement as a positive feature of the market environment. These items often included information consumers might expect to find on food products (e.g. ingredients lists, nutritional content information) and use in making food-purchasing decisions( Reference Ollberding, Wolf and Contento 22 ). While consumers are accustomed to finding this information at other common food outlets, such as grocery stores, this information is not consistently displayed at farmers’ markets. Another study has shown that consumers are interested in having more information about food available at farmers’ markets( Reference Howard 23 ), especially information about freshness, flavour, food safety and nutrition( Reference Fehrenbach and Wharton 15 ). Studies also suggest consumers would prefer to receive this information in the form of a product label( Reference Fehrenbach and Wharton 15 ), similar to what is provided at other retail food outlets. This information may support shoppers’ decisions around healthy food purchasing at markets and more readily conform to their expectations.
Insights about the social environment are also important lessons that could support strategies to increase market participation. Shoppers were attracted by the social interactions with other customers or vendors as well as the exchange of food preparation and recipe tips. Shoppers also viewed ‘attractions’, such as musical groups, as positive, perhaps because they enhanced the social experience of the market. As such, in addition to the provision of healthful foods, farmers’ markets may be viewed by some as a place for community gathering and an opportunity to meet and interact with neighbours( Reference Zepeda and Li 24 ). These findings are consistent with previous research indicating non-nutritional benefits including community-building, civic engagement and social well-being of farmers’ markets( Reference Arneson McCormack, Nelson Laska and Larson 5 ). Future health promotion efforts may consider harnessing the social connectivity of the market by embedding interventions (e.g. cooking classes, walking groups, etc.) directly within this context. Additionally, the social aspect of the market may be leveraged among populations where healthful nutrition is not necessarily a priority, such that aspects of community connectedness may be used to draw individuals who would not otherwise seek out healthful produce.
An innovative aspect of the current study was the use of the electronic Discovery Tool to capture photographs and audio narratives of the primary coded elements. This is the first use of this emerging technology within the food environment context and shows that the Discovery Tool can readily be adapted for use in different settings. We found users could be fully trained to use the technology with instruction lasting one minute or less. Additionally, the Discovery Tool offers the ability to capture the perceptions and observations of users in real time and therefore does not rely on retrospective reporting that is common in other perceived food environmental tools. This may overcome existing reliance upon retrospective, self-reported methods for obtaining information on decision-making processes in food environments. This advance would provide greater insights into the complexities of food purchasing decisions, particularly the role of habitual routines in these decisions over more thoughtful processes( Reference Gram 25 ). Finally, the user-generated nature of the Discovery Tool represents an opportunity to significantly increase the amount of food environment data collected above that typically collected by researchers. The platform has the potential of being scaled up for rapid capture of very rich photographic, audio and quantitative data among large numbers of individuals, regardless of location. Currently the Discovery Tool is being evaluated with collaborators in the UK, Mexico, Israel and rural segments of the USA to assess a range of environmental contexts related to active living and healthful eating. Limitations of the current study include the small sample size and whether these findings generalize to other farmers’ market locales. Furthermore, it is not known whether the Discovery Tool may be useful in a diverse range of food outlets including grocery stores, convenience stores or restaurants.
Conclusions
The study of shoppers’ experiences at an urban farmers’ market using an innovative, technology-based environmental assessment tool revealed that produce quality, product presentation, social interactions and attractions were important to shoppers. These results may inform how social marketing strategies are used to increase farmers’ market utilization and how to leverage the market context for broader community-level health promotion activities. The study also demonstrated that consumer-based rich, contextual data about a food environment can be rapidly captured and provide initial information regarding food purchasing decisions. Future use of the Discovery Tool in different food environments (e.g. supermarkets, restaurants) may provide more real-time, contextual information regarding decision-making processes than traditional retrospective methods have provided in the past.
Acknowledgements
Acknowledgements: The authors thank Kristin Fankhauser, Cindy Gentry, Amanda Gordon, Jonathan Kurka, Gina Lacagnina, Amy Woof and Kate Youngman for their assistance with this project. Financial support: The development of the Discovery Tool was supported by the National Center for Research Resources and the National Center for Advancing Translational Sciences, National Institutes of Health (A.C.K. Principal Investigator, grant number UL1 RR025744). S.J.W. and J.L.S. were supported by a US Public Health Service Grant (grant number 5T32HL007034) from the National Heart, Lung, and Blood Institute. The funders had no role in the design, analysis or writing of this article. Conflict of interest: None. Authorship: Each author contributed to the development of this work and editorial review and final approval of the manuscript. M.P.B. was responsible for study design, statistical analysis and writing. F.B. oversaw data collection. E.B.H., S.J.W. and J.L.S. consulted on study design, data coding and analysis. A.C.K. was responsible for the initial development of the Discovery Tool. C.M.W. was responsible for study design and developing a relationship with the farmers’ market. Ethics of human subject participation: This research was evaluated and approved by the Arizona State University Office of Research Integrity and Assurance (#1112007200).


