


The onset of obesity and its associated co-morbidities has long been reported to be associated with high dietary intake of SFA( Reference Siri-Tarino, Sun and Hu 1 , Reference van Dijk, Feskens and Bos 2 ). In this context, animal products rich in SFA, and especially dairy foods, are the targets of some advisory bodies that recommend limiting their intake to prevent the onset of CVD( Reference Lichtenstein, Appel and Brands 3 – 5 ). However, despite containing high amounts of SFA, dairy products exhibit a valuable fatty acid (FA) profile, with a variety according to their origin. Indeed, they contain variable amounts of α-linolenic acid (ALA), an essential n-3 PUFA, and of specific FA derived from biohydrogenation in the rumen, i.e. conjugated linoleic acids (CLA), with the major isomer being rumenic acid (cis-9, trans-11 CLA)( Reference Jensen, Ferris and Lammi-Keefe 6 ). Notably, dairy creams derived from the milk of cows fed in pastures can contain 2-fold more ALA and 3-fold more CLA than standard creams derived from the milk of cows kept in cowsheds( Reference Rouillé and Montourcy 7 ).
Both ALA and CLA, particularly cis-9, trans-11 and trans-10, cis-12 isomers, are known to protect against obesity onset( Reference Chen, Lin and Huang 8 – Reference Baranowski, Enns and Blewett 10 ) and to restore metabolic parameters altered by high-fat diet (HFD) feeding such as insulin sensitivity and plasma lipid profiles( Reference Norris, Collene and Asp 11 , Reference de Luis, de la Fuente and Izaola 12 ). Therefore, dairy products naturally enriched with n-3 PUFA and CLA exert nutritionally beneficial effects. Indeed, milk fat naturally rich in CLA (cis-9, trans-11 CLA) has been reported to be associated with weak lipid infiltration in the aorta of rabbits compared with milk fat poor in CLA( Reference Roy, Chardigny and Bauchart 13 ) and with lower cholesteryl ester deposition and lower local inflammatory status in the aorta of Syrian hamsters( Reference Valeille, Ferezou and Parquet 14 ). Furthermore, two nutritional human studies have shown that milk from cows fed a diet enriched with ALA using rapeseed oil( Reference Seidel, Deufel and Jahreis 15 ) or using DM basis of extruded linseed( Reference Malpuech-Brugere, Mouriot and Boue-Vaysse 16 ) decreases plasma LDL-cholesterol concentrations compared with a standard milk. However, despite these conclusive data on cardiovascular risk markers, no study has been carried out, to date, on animal models or in human subjects regarding the metabolic impact of the origin of dairy cream in a HFD feeding context.
The following metabolic parameters are typically studied in HFD protocols: (1) body weight gain and fat mass accumulation; (2) plasma concentrations of lipids and adipokines; (3) markers of low-grade inflammation in the adipose tissue such as the expression of pro-inflammatory cytokines. The latter are associated with the markers of macrophage infiltration (cluster of differentiation 68 (CD68) and CD11c and monocyte chemoattractant protein 1 (MCP-1)) and with the expression of the endotoxin Toll-like receptor 4( Reference Wellen and Hotamisligil 17 , Reference Laugerette, Furet and Debard 18 ). In parallel, HFD studies also focus on the liver. Indeed, the liver plays a key role in lipid metabolism( Reference Nguyen, Leray and Diez 19 ), especially through the activity of the transcription factor PPARα promoting mitochondrial FA β-oxidation( Reference Pyper, Viswakarma and Yu 20 ) and through its ability to store lipids in conditions of excess dietary lipids. However, a new player has been identified in obesity disorders, namely the intestine( Reference de Wit, Bosch-Vermeulen and de Groot 21 , Reference Kondo, Minegishi and Komine 22 ). It is in close contact with nutrients present in the lumen and thus represents the front door for nutrient absorption and host defence. Recent studies have shown that HFD cause intestinal disturbances( Reference Ley, Backhed and Turnbaugh 23 , Reference Turnbaugh and Gordon 24 ) that further contribute to the onset of obesity. In this context, some intestinal parameters are well known to be modulated by HFD such as intestinal lipid carriers regulating lipid absorption( Reference Petit, Arnould and Martin 25 ) and tight-junction proteins involved in intestinal paracellular permeability( Reference Cani, Bibiloni and Knauf 26 ). However, the impacts of HFD on the other key actors of the intestinal barrier function such as goblet cells or Paneth cells have never been studied to date. Notably, goblet cells are responsible for the production of a protective mucus gel by secreting mucin 2 (MUC2), a heavily glycosylated glycoprotein( Reference Allen, Hutton and Pearson 27 , Reference Dekker, Rossen and Buller 28 ), whereas Paneth cells contribute to the innate immunity by sensing bacteria and secreting antimicrobial peptides( Reference Bevins and Salzman 29 , Reference Ouellette 30 ).
Given the effects of milk origin and milk FA profiles on cardiovascular risk markers, we hypothesised that the natural enrichment of dairy cream with CLA and ALA can lead to significant differences in the metabolic outcomes of a HFD. Thus, in the present study, we investigated the effects of a HFD according to the origin of the incorporated dairy cream, standard or derived from the milk of cows fed in pastures, on (1) the development of metabolic disorders associated with adiposity, hepatic lipid metabolism and adipose tissue inflammation and (2) different actors involved in the intestinal barrier protective function, and particularly goblet cell and Paneth cell populations, which have never been studied to date, in mice in a HFD feeding context. In parallel, we also set up an original in vitro study on a human goblet cell line to investigate the potential roles of dairy cream lipids in MUC2 production.
Materials and methods
Chemicals
FA and β-sitosterol were obtained from Sigma Chemicals. All the other chemicals used were of the highest chemical grade.
Animals and diets
Male C57BL/6 mice (19–20 g and 6 weeks old; Janvier SA) were housed five per cage in a controlled environment (24 ± 1°C and 12 h day–12 h light cycle) with free access to food and water. After a week, they were randomly divided into three groups (n 10): control (CT) group fed a chow diet (A04); standard dairy cream (SDC) group fed a moderate HFD (lipids derived from a dairy cream from cows fed maize powder); pasture dairy cream (PDC) group fed a moderate HFD (lipids derived from a dairy cream from cows fed grass; Sodiaal-Candia). The creams were pasteurised and non-homogenised, freeze-dried and their lipid profiles were determined by GC( Reference Park and Goins 31 ) and GC–MS( Reference Benoit, Fauquant and Daira 32 ). All the diets were prepared by SAFE; their compositions are given in Table 1. Body weight and food intake were measured twice per week during the 12-week experimental period. The body weight of each animal was recorded. Body weight gain was calculated as follows:
 $$\begin{eqnarray} Body\,weight\,gain\,(g) = final\,weight - initial\,weight. \end{eqnarray}$$
For the measurement of food intake (twice a week), food was weighed before being introduced into the cages and the leftover food was weighed. The amounts of food consumed were then divided by the number of days between the weighings and the number of mice in the same cage( 5 ). This was repeated twice a week during the 12-week experimental period, and the mean food intake was then calculated using all the values obtained for each group.
Table 1 Compositions of the experimental diets*
CT, control; SDC, standard dairy cream; PDC, pasture dairy cream.
* Both creams were freeze-dried before incorporation in the diets.
At the end of the experimental period, the mice were anaesthetised by injecting pentobarbital. Blood samples were collected by cardiac puncture in tubes containing heparin (blood was drawn randomly). Plasma was obtained by centrifugation of the blood samples (8000 g for 10 min) and stored ( − 80°C). Livers, gastrocnemius muscles and white adipose fat pads were weighed, frozen in liquid N2 and stored ( − 80°C). For intestinal segments (duodenum, jejunum and colon), one sample was frozen in liquid N2 and stored ( − 80°C) and the other one was placed in cold ethanol (90 %) and stored ( − 20°C).
All the animal experiments were carried out in accordance with the Guiding Principles for the Care and Use of Vertebrate Animals in Research and Training and the French Ministère de l'Agriculture (no. 87-848 completed by no. 2001-464) and EU Council Directive for the Care and Use of Laboratory Animals (no. 86/609). A. G. (no. 69266332) holds a licence to experiment on living vertebrates issued by the French Ministry of Agriculture and Veterinary Service Department.
Determination of hepatic TAG and phospholipid contents
Total lipids were extracted from the livers and purified according to the Folch method( Reference Folch, Lees and Sloane Stanley 33 ). The livers were homogenised with chloroform–methanol (2:1, v/v). Total lipids were extracted overnight at 4°C. The homogenate was filtered, and the lipids were washed twice using 0·25 % aqueous KCl (w/v) solution. The organic lower phase containing the lipids was evaporated until dry. The samples were further dried overnight in a dessicator, and the total lipid content was determined. Phospholipid content was determined by measuring the phosphate content after mineralisation of the molecules( Reference Bartlett 34 ). Mineralisation was carried out in sulphuric acid–perchloric acid (2:1, v/v) containing 0·1 % V2O4 (m/v)( Reference Buccoliero, Bodennec and Van Echten-Deckert 35 ). TAG content was determined by subtracting the phospholipid content from the total lipid content.
Determination of hepatic and adipose tissue fatty acid profiles by gas chromatography
For determining total FA profiles of the liver and adipose tissue, total lipids were extracted from the epididymal adipose tissue or liver using ethanol–chloroform (1:2, v/v)( Reference Lefils, Geloen and Vidal 36 ). The organic phase was dried under N2, and total FA were transmethylated using boron trifluoride in methanol( Reference Lefils, Geloen and Vidal 36 ). The FA methyl esters were then analysed by gas chromatography using a DELSI instrument model DI 200 equipped with a fused silica capillary SP-2380 column (60 × 0·22 mm).
Glucose tolerance test: determination of fasting and non-fasting glucose concentrations
A glucose tolerance test was carried out (9th week). The fasting glucose concentrations of mice were measured using tail blood samples with a glucometer (Accu-Chek®; Roche). The mice were then intraperitoneally injected with d-glucose (2 g/kg body weight) and glucose concentrations were measured until 140 min after injection. Non-fasting glucose concentrations were measured the night before the fast.
Measurement of plasma hormone and TAG concentrations
The plasma concentrations of TAG were measured using the Triglyceride PAP kit (bioMérieux). The plasma concentrations of leptin (Enzo Life Sciences, Covalab) and adiponectin (AdipoGen™) were measured using ELISA kits.
Real-time PCR assays
Total RNA was extracted from retroperitoneal white adipose tissue, jejunum, colon and liver samples using the NucleoSpin® RNA/Protein kit (Macherey Nagel). First-strand complementary DNA was synthesised from 1 μg of total RNA in the presence of 100 units of Superscript II (Invitrogen) using a mixture of random hexamers and oligo(dT) primers (Promega). Real-time PCR assays were carried out using a Rotor-Gene Q (Qiagen). The mRNA levels of hypoxanthine-guanine phosphoribosyltransferase (HPRT) were used to normalise the data. All the studied genes are listed in Table 2. Primer sequence and quantitative RT-PCR conditions are available upon request from the authors (emanuelle.meugnier@univ-lyon1.fr).
Table 2 List of the studied genes

Western blot analysis
Proteins (30 μg) were separated using 3–8 % Tris–acetate gel and transferred onto polyvinylidene difluoride membranes using the XCELL II Blot Module (Invitrogen, Life Technologies SAS). The membranes were incubated with antibodies against a mouse monoclonal anti-occludin antibody (sc-133256, dilution 1:1000; Santa Cruz), a rabbit polyclonal anti-zonula occludens 1 antibody (617300, dilution 1:250; Invitrogen) or a rabbit polyclonal anti-β-actin antibody (A5060, dilution 1:3000; Sigma-Aldrich). The antibodies bound to the polyvinylidene difluoride membrane were detected using the WesternBreeze Immunodetection Chemiluminescent System (Invitrogen). The optical density of the protein bands was visualised and pixelated using the ‘Image System’ (ImageMaster VDS-CL; Amersham Biosciences) and densitometrically analysed using the Quantity One image analysis software (Bio-Rad Laboratory).
Immunohistochemistry
As has been described previously( Reference Estienne, Claustre and Clain-Gardechaux 37 ), the collected fragments were fixed in 90 % ethanol (24 h at − 20°C), embedded in paraffin blocks and cut into 4 μm sections. The paraffin sections were rehydrated, and endogenous peroxidase activity was quenched by incubating the sections in 5 % H2O2/PBS for 20 min. After washing the slides, antigens were retrieved by heating the sections in 0·01 m-citrate buffer (pH 6·0) by microwaving. For lysozyme immunohistochemical staining (Paneth cells), microwave treatment was omitted. After incubation in 2·5 % normal horse blocking serum (ImmPRESS™; Vector Laboratories), the sections were incubated with rabbit anti-MUC2 (1/250, mouse; Santa Cruz (H300)) or with rabbit anti-lysozyme (1/100, rabbit; Zymed Laboratories) antibodies diluted in a blocking solution for 30 min at room temperature. The immune reaction was detected by incubating the sections with a ready-to-use peroxidase-labelled secondary reagent, ImmPRESS™ (MP-7401 for rabbit antibodies; Vector Laboratories) for 30 min at room temperature. AEC (3-amino-9-ethylcarbazole) substrate for peroxidase (Vector Laboratories) was used as a chromogen. The sections were then counterstained and mounted. Negative control tests were carried out by omitting the primary antibody incubation step.
Quantitative analysis of the intestinal secretory cells
The number of goblet (MUC2) cells per crypt–villus axis in the small intestine and per crypt in the colon and the percentage of crypt cross sections with Paneth cells (lysozyme positive) were determined. A crypt was considered for analysis when it was cut along or nearly along the length of the crypt lumen. Progressing from the crypt base to crypt opening, all the stained cells belonging to the epithelium were counted on both sides of the lumen. All the slides were analysed by a single investigator blinded to the treatment groups.
In vitro study: HT29-MTX cells, lipids and mucin 2
The human colon cancer mucin-secreting goblet cell line HT29-MTX was cultured in twelve-well plates on 12 mm polycarbonate Transwell filter inserts (Costar) in Dulbecco's modified Eagle's medium (Invitrogen SARL), supplemented with 10 % fetal bovine serum (Invitrogen) and 100 mg/ml of penicillin–streptomycin (Invitrogen), at 37°C and 5 % CO2 atmosphere. The experiments were initiated on the 1st day of confluence and were carried out until 21 d. The cells were stimulated every day at their apical pole with (1) ALA or cis-9, trans-11 CLA (CLA), (2) different mixtures of FA – a mixture of linoleic acid (LA) and ALA at a ratio of 1:1 or at a ratio of 1:10 or by a mixture of 50 % palmitic acid, 30 % oleic acid (OA), 20 % LA and ALA with a LA:ALA ratio equal to 1·5 or 3 to mimic cream FA profiles by mixing the two major FA, palmitic acid and OA, and by maintaining the LA:ALA ratio of the creams, and (3) different concentrations of β-sitosterol. FA and β-sitosterol were diluted in ethanol and mixed with FA-free bovine serum albumin. The stimulation dose was equal to 150 μm of FA for ALA, CLA and the mixtures and equal to 107, 10− 8 or 10− 9 m for β-sitosterol. For all these experiments, ethanol and bovine serum albumin-diluted culture medium was used as a control. On the 21st day of the treatment, the cells and apical and basolateral media were collected for Western blot analysis.
Statistical analysis
All the data are presented as means with their standard errors. Differences between the three experimental groups were analysed using one-way ANOVA with Fisher's protected least significant difference (PLSD) post hoc test. Group size was justified by statistical calculations such that ten animals could allow observing a 30 % difference in total fat mass among the groups with P< 0·05 and a power of 0·8. Moreover, such a group size is consistent with that used in previous published studies on the same kind of metabolic outcomes( Reference Laugerette, Furet and Debard 18 , Reference Lefils, Geloen and Vidal 36 ). Simple comparisons between SDC and PDC were made using Student's t test. P values < 0·05 were considered to be statistically significant, and the statistical analysis was carried out using StatView 5.0 software (Abacus Concept, Inc.).
Results
Dairy cream fatty acid profiles
Detailed FA profiles and sterol contents of the creams are summarised in Table 3. The creams were similar with respect to their SFA (from C4 to C18), OA and LA contents, but they differed in their CLA content. Although the PDC and SDC contained the same amounts of vaccenic acid, the PDC contained 1·5-fold more rumenic acid (cis-9, trans-11 CLA). Furthermore, the PDC contained 2-fold more ALA than the SDC, and its LA:ALA ratio was thus two times lower. Only in the PDC could β-sitosterol be detected. Furthermore, the PDC contained 1·4-fold more desmosterol than the SDC.
Table 3 Fatty acid profiles and sterol contents of the dairy creams (Mean values with their standard errors, n 3)

SDC, standard dairy cream; PDC, pasture dairy cream; LA, linoleic acid; CLA, conjugated linoleic acid; ALA, α-linolenic acid; ND, not detected.
Morphological and metabolic consequences of dairy cream high-fat diet feeding
At the end of the experimental period, the body weight of the SDC and PDC groups was greater than that of the CT group (Table 4). Despite the lack of a difference in body weight between the HFD groups, the PDC group ingested significantly more energy, and thus more fat, than the SDC group (P< 0·05). The three groups had the same lean mass, but there were significant differences in their fat pad mass. The increase in the fat pad mass of the HFD groups was greater than that in the CT group. Moreover, despite the lack of a difference in body weight, the fat pad mass of the PDC group was 30 % lower than that of the SDC group (P< 0·05). The most marked difference was observed in the retroperitoneal fat pad mass. The PDC group exhibited a decrease of 50 % compared with the SDC group (P< 0·05). Liver mass was similar between the groups, but the hepatic lipid profiles were different. The highest hepatic TAG content was found in the SDC group, whereas a hepatic TAG content as low as that in the CT group was found in the PDC group. The lowest hepatic phospholipid content was found in the SDC group (Table 4).
Table 4 Values of the morphological and metabolic parameters (Mean values with their standard errors)

CT, control; SDC, standard dairy cream; PDC, pasture dairy cream.
a,b,cMean values within a row with unlike superscript letters were significantly different (P< 0·05; ANOVA followed by Fisher's test).
With respect to the plasma metabolic parameters (Table 5), the PDC group exhibited lower plasma TAG concentrations than the CT and SDC groups (decrease of 30 % compared with the other two groups; P< 0·05). The concentrations of fasting and non-fasting glucose were neither modified by HFD feeding nor modified by dairy cream quality, and no difference was observed in the results of the glucose tolerance test as revealed by the AUC values (Table 5). The plasma concentrations of adiponectin were similar between the groups, whereas those of leptin were higher in both the HFD groups than in the CT group. Notably, the plasma concentrations of leptin were highly correlated with fat pad mass (r 2 0·86 in the PDC group, P= 0·02, and r 2 0·99 in the SDC group, P= 0·001).
Table 5 Values of the plasma metabolic parameters (Mean values with their standard errors, n 10)
CT, control; SDC, standard dairy cream; PDC, pasture dairy cream.
a,bMean values within a row with unlike superscript letters were significantly different (P< 0·05; ANOVA followed by Fisher's test).
Hepatic and white adipose tissue FA profiles were analysed. The proportions of SFA and OA in the tissue lipids of the SDC and PDC groups were similar (Table 6). The proportions of ALA and EPA in hepatic lipids were higher in the PDC group than in the SDC group (P< 0·05), but the hepatic LA:ALA ratio was not significantly different between the groups. The proportions of LA, ALA and EPA in adipose tissue lipids were higher in the PDC group than in the SDC group. The adipose tissue LA:ALA ratio was lower in the PDC group than in the SDC group (P< 0·05).
Table 6 Hepatic and adipose tissue lipid profiles (mg/100 mg total fatty acids) (Mean values with their standard errors, n 4)

SDC, standard dairy cream; PDC, pasture dairy cream; LA, linoleic acid; ALA, α-linolenic acid.
* Mean value was significantly different from that of the SDC group (P< 0·05; Student's t test).
Impact of dairy cream high-fat diet feeding on inflammation markers in the adipose tissue
As shown in Fig. 1, the levels of IL-6 and Toll-like receptor 4 mRNA were higher in the HFD groups than in the CT group (Fig. 1(a) and (b)), but the PDC group differed from the SDC group in that it had significantly lower levels of IL-6, CD68, CD11c, MCP-1 and TNFα mRNA than the SDC group (Fig. 1(a), (c), (d), (e) and (f)). Furthermore, the levels of TNFα mRNA in the PDC group were lower than those in the CT group (Fig. 1(f)).

Fig. 1 Effect of feeding a control (CT), a standard dairy cream (SDC) or a pasture dairy cream (PDC) diet for 12 weeks on the gene expression of different markers of inflammation in the epididymal adipose tissue: (a) IL-6, (b) Toll-like receptor 4 (TLR4), (c) cluster of differentiation 68 (CD68), (d) CD11c, (e) monocyte chemoattractant protein 1 (MCP-1) and (f) TNFα normalised to hypoxanthine-guanine phosphoribosyltransferase (HPRT). Values are means (n 5), with their standard errors represented by vertical bars. * Mean value was significantly different from that of the CT group (P< 0·05; ANOVA followed by Fisher's test). † Mean value was significantly different from that of the SDC group (P< 0·05; ANOVA followed by Fisher's test).
Impact of dairy cream high-fat diet feeding on the gene expression of lipid metabolism-related proteins in the liver and adipose tissue
The levels of diacylglycerol acyltransferase 1 (DGAT1) and liver lipase mRNA were similar between the groups (Fig. 2(a) and (b)). The levels of carnitine palmitoyltransferase 1 (CPT1) mRNA were higher in both the HFD groups than in the CT group, whereas those of DGAT2 mRNA were higher only in the SDC group (Fig. 2(c) and (d)). Importantly, the levels of PPARα mRNA were higher in the PDC group than in the SDC and CT groups (1·5- and 1·7-fold higher, respectively, P< 0·05; Fig. 2(e)).

Fig. 2 Effect of feeding a control (CT), a standard dairy cream (SDC) or a pasture dairy cream (PDC) diet for 12 weeks on the gene expression of proteins involved in lipid metabolism in the liver: (a) diacylglycerol acyltransferase 1 (DGAT1), (b) liver lipase, (c) carnitine palmitoyltransferase 1 (CPT1), (d) diacylglycerol acyltransferase 2 (DGAT2) and (e) PPARα normalised to hypoxanthine-guanine phosphoribosyltransferase (HPRT). Values are means (n 5), with their standard errors represented by vertical bars. * Mean value was significantly different from that of the CT group (P< 0·05; ANOVA followed by Fisher's test). † Mean value was significantly different from that of the SDC group (P< 0·05; ANOVA followed by Fisher's test).
The expression of genes coding proteins involved in the capture of lipids from the plasma and those involved in lipid metabolism in adipocytes was studied. The expression of perilipin was significantly strongly decreased by both the cream-based HFD (Fig. 3(a)). In contrast, the expression of lipoprotein lipase (LPL), hormone-sensitive lipase (HSL), adipose TAG lipase (ATGL) and CD36 was affected neither by cream quality nor by HFD feeding (Fig. 3(b), (c), (e) and (f)). Cream quality affected the expression of cell death-inducing DNA fragmentation factor subunit alpha (DFFA)-like effector a (CIDEA) and PPARα, which was decreased in the SDC group compared with that in the CT group (Fig. 3(d) and (h)). An increase in the expression of uncoupling protein 2 was observed in the PDC group compared with that in the CT group (Fig. 3(g)).
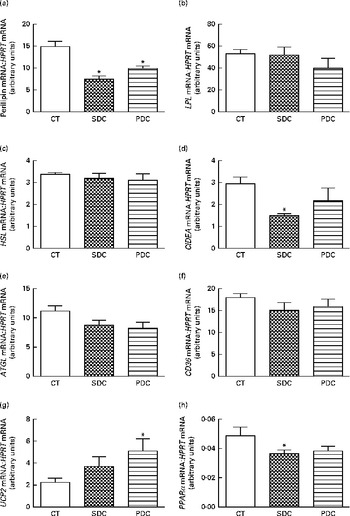
Fig. 3 Effect of feeding a control (CT), a standard dairy cream (SDC) or a pasture dairy cream (PDC) diet for 12 weeks on the gene expression of proteins involved in lipid absorption and metabolism in adipose tissue: (a) perilipin, (b) lipoprotein lipase (LPL), (c) hormone-sensitive lipase (HSL), (d) cell death-inducing DNA fragmentation factor subunit alpha (DFFA)-like effector a (CIDEA), (e) adipose TAG lipase (ATGL), (f) cluster of differentiation 36 (CD36), (g) uncoupling protein 2 (UCP2) and (h) PPARα normalised to hypoxanthine-guanine phosphoribosyltransferase (HPRT). Values are means (n 5), with their standard errors represented by vertical bars. * Mean value was significantly different from that of the CT group (P< 0·05; ANOVA followed by Fisher's test).
Impact of dairy cream high-fat diet feeding on intestinal lipid metabolism
Markers of the capacities of the jejunal enterocytes to bind to FA, to synthesise TAG and to produce chylomicrons were studied using quantitative RT-PCR assays. The HFD groups had higher levels of fatty acid transport protein 4 (FATP4) and FA-binding protein 2 mRNA than the CT group (2–3-fold according to the carrier, P< 0·05), and the PDC group differed from the SDC group in that it had higher levels of FATP4 mRNA than the SDC group (Fig. 4(a) and (b)). With respect to the gene expression of proteins involved in TAG production and storage, the HFD groups exhibited the highest expression of DGAT1 than the CT group, with the expression being significantly higher in the PDC group (v. SDC group, P< 0·05; Fig. 4(c)). In contrast, there was no difference in the gene expression of adipose differentiation-related protein (ADFP) between the groups (Fig. 4(d)). With respect to the gene expression of proteins involved in chylomicron production and secretion, the HFD groups exhibited the highest expression of microsomal TAG transfer protein (MTTP) and SAR1 homologue B mRNA than the CT group (Fig. 4(e) and (f)).

Fig. 4 Effect of feeding a control (CT), a standard dairy cream (SDC) or a pasture dairy cream (PDC) diet for 12 weeks on the gene expression of proteins involved in lipid absorption and metabolism in jejunal enterocytes: (a) fatty acid transport protein 4 (FATP4), (b) fatty acid-binding protein 2 (FABP2), (c) diacylglycerol acyltransferase 1 (DGAT1), (d) adipose differentiation-related protein (ADFP), (e) microsomal TAG transfer protein (MTTP) and (f) SAR1 homologue B (SAR1B) normalised to hypoxanthine-guanine phosphoribosyltransferase (HPRT). Values are means (n 5), with their standard errors represented by vertical bars. * Mean value was significantly different from that of the CT group (P< 0·05; ANOVA followed by Fisher's test). † Mean value was significantly different from that of the SDC group (P< 0·05; ANOVA followed by Fisher's test).
Impact of dairy cream high-fat diet feeding on the gut barrier function
The expression of two intestinal tight-junction proteins, occludin and zonula occludens 1, was analysed using Western blot analysis. The results revealed no difference in expression between the groups (Fig. 5). The PDC group had a significantly higher percentage of crypts with Paneth cells in the small intestine than the SDC and CT groups (P< 0·05; Fig. 6(a)). Furthermore, the PDC group had more number of goblet cells in the small intestine than the other two groups (at least 1·4-fold more, P< 0·05; Fig. 6(b), (c) and (d)). The same result was observed in the colon as the PDC group had more number of goblet cells (Fig. 6(e), (f), (g) and (h)). Consistently during immunohistochemistry, the PDC group was found to have 4·5-fold more MUC2 mRNA in the colon than the CT and SDC groups (P< 0·05; Fig. 6(i)).
Fig. 5 Effect of feeding a control (CT), a standard dairy cream (SDC) or a pasture dairy cream (PDC) diet for 12 weeks on tight-junction protein expression in the colon. (a) Occludin protein expression corrected by β-actin expression and expressed as a percentage of the control ratio. (b) Zonula occludens 1 (ZO-1) protein expression corrected by β-actin expression and expressed as a percentage of the control ratio. Values are means (n 5), with their standard errors represented by vertical bars (ANOVA followed by Fisher's test).

Fig. 6 Effect of feeding a control (CT), a standard dairy cream (SDC) or a pasture dairy cream (PDC) diet for 12 weeks on (a) Paneth cells, (b–h) goblet cells and (i) mucin 2 (MUC2) production. (a) Percentage of crypts with Paneth cells in the duodenum. (b) Number of goblet cells per crypt–villus axis in the duodenum. Thin-section histology of the duodenum of the (c) CT and (d) PDC mice ( × 40 magnification), MUC2 immunolabelling. (e) Number of goblet cells per crypt in the colon. Thin-section histology of the colon of the (f) CT, (g) SDC and (h) PDC mice ( × 10 and × 40 magnification), MUC2 immunolabelling. (i) Gene expression of MUC2 mRNA normalised to that of hypoxanthine-guanine phosphoribosyltransferase (HPRT) mRNA in the colon. Values are means (n 5 for gene expression and n 8 for immunohistochemistry), with their standard errors represented by vertical bars. * Mean value was significantly different from that of the CT group (P< 0·05; ANOVA followed by Fisher's test). † Mean value was significantly different from that of the SDC group (P< 0·05; ANOVA followed by Fisher's test).
Lipid content and mucin 2 expression in HT29-MTX cells in vitro
Apical stimulation of HT29-MTX cells with ALA and CLA led to a drastic decrease (between 44 and 57 %) in MUC2 production compared with that in the CT group (Fig. 7(a)). The LA:ALA ratio also decreased MUC2 expression under all the experimental conditions, i.e. with or without the other FA, palmitic acid and OA (Fig. 7(b) and (c)). Finally, stimulation with different concentrations of β-sitosterol did not significantly alter MUC2 production, but the results were disparate, and in some of the experiments at least a 1·5-fold increase was observed in MUC2 production (Fig. 7(d)).

Fig. 7 Effects of 150 μm of (a) α-linolenic acid (ALA) and conjugated linoleic acids (CLA), (b) two different mixtures of linoleic acid (LA) and ALA, (c) two different mixtures of palmitic acid, oleic acid, and LA and ALA either with a 1·5 ratio or with a 3 ratio, and (d) different concentrations of β-sitosterol on mucin 2 (MUC2) intracellular levels in HT29-MTX cells stimulated at their apical pole 21 d after confluence. Values are means (n 3 individual experiments for each condition), with their standard errors represented by vertical bars. * Mean value was significantly different from that of the control (CT) group (P< 0·05; ANOVA followed by Fisher's test). Results are shown as box plots for β-sitosterol.
Discussion
Based on the diet that cows consume, dairy products can be rich in CLA, ALA and phytosterols. In this context, studies carried out in animals and human subjects have focused on the effects of different qualities of dairy products on cardiovascular risks. However, until now, no data regarding the metabolic effects of different qualities of dairy products in terms of HFD feeding have been reported. Thus, the aim of the present study was to compare the effects of a dairy cream naturally rich in cis-9, trans-11 CLA and ALA with those of a SDC, both incorporated in a HFD, on the onset of metabolic and intestinal disorders in mice.
Replacement of a standard dairy cream with a pasture dairy cream in a high-fat diet prevents fat mass accumulation: possible mechanisms
PDC significantly modifies, in a favourable way, the metabolic outcomes of a cream-based HFD. Despite food intake being higher than that in the SDC mice, the PDC mice had lower fat mass and plasma and hepatic TAG concentrations. Furthermore, the expression of IL-6 and TNFα, two pro-inflammatory cytokines, and CD68 and CD11c, two markers of macrophage infiltration, in the adipose tissue of the PDC mice was lower than that in the adipose tissue of the SDC mice. Thus, in addition to exhibiting lower expansion, the adipose tissue of the PDC mice was metabolically less affected by HFD feeding compared with that of the SDC mice. In the small intestine, the expression of FATP4, an apical FA transporter involved in intestinal lipid absorption( Reference Abumrad and Davidson 39 ), and of DGAT1, a key enzyme of the TAG biosynthesis pathway involved in the absorption of dietary fat and in its secretion out of enterocytes( Reference Lee, Fast and Zhu 40 ), was higher in the PDC mice than in the SDC mice. Because lipids have been reported to induce the expression of their own carriers( Reference Petit, Arnould and Martin 25 ), it is consistent that their expression was stimulated in the PDC mice, which had the highest fat intake. The PDC mice tended to exhibit a greater body weight gain than the SDC mice, despite their lower fat mass and similar lean mass. This can be explained by the fact that the mice were killed after their feeding period and so their gastrointestinal tract was full of food. As the PDC mice exhibited higher food intake than the SDC mice (approximately 0·8 g more per d), the difference in body weight (equal to 0·8 g) can correspond to the extra food ingested and present in the gastrointestinal tract.
To explain why the PDC mice ingested more fat than the SDC mice without exhibiting an increase in their fat mass proportionally, we hypothesised that lipid β-oxidation was increased in the PDC mice in response to the composition of their diet. One of the main sites of lipid β-oxidation is the liver. Long-chain acyl-CoA from circulating lipids is transferred from the hepatocyte cytoplasm to the mitochondria to be β-oxidised. The transcriptional factor PPARα is a key regulator of hepatic FA β-oxidation( Reference Pyper, Viswakarma and Yu 20 ). Indeed, its activation triggers a cascade of events leading to a decrease in plasma and hepatic TAG concentrations( Reference Lefebvre, Chinetti and Fruchart 41 ) due to its ability to stimulate the expression of lipid oxidation enzymes( Reference Sampath and Ntambi 42 ). More precisely, after its activation by its ligands, PPARα forms a heterodimer with retinoid X receptor, which migrates to the nucleus. In the nucleus, it binds to DNA sequences named PPARα response element present in the 5′ region of the target genes such as those coding for enzymes involved in FA β-oxidation( Reference Lefebvre, Chinetti and Fruchart 41 ). In the liver of the PDC mice, the expression of PPARα was strongly increased compared with that in the SDC mice, which supports our hypothesis of an increased β-oxidation. The stimulation of PPARα in response to the PDC diet can be explained by the high amounts of ALA and cis-9, trans-11 CLA in this diet. Indeed, ALA, through its bioconversion to EPA and DHA by the enzymes Δ6-desaturase, Δ5-desaturase and elongase-2 and -5, is a strong activator of the expression of PPARα in the liver( Reference Gonzalez-Manan, Tapia and Gormaz 43 ). Similar to CLA (cis-9, trans-11 CLA and trans-10, cis-12 isomers), EPA and DHA are high-affinity ligands and activators of PPARα( Reference Moya-Camarena, Vanden Heuvel and Blanchard 44 , Reference Konig, Spielmann and Haase 45 ). Moreover, studies have shown that cis-9, trans-11 and trans-10, cis-12 CLA isomers increase the expression of several enzymes linked to lipid oxidation and that the expression of these enzymes is regulated by PPARα( Reference House, Cassady and Eisen 46 ). In support of the results and hypothesis of the present study, a study in mice has shown that the consumption of a HFD supplemented with a mixture of CLA (cis-9, trans-11 CLA, trans-10, cis-12 CLA and others CLA) tends to lower body weight and adipose tissue weight in comparison with the consumption of a HFD without CLA( Reference Hur, Kim and Chun 47 ). Furthermore, another study has shown that rats fed a HFD supplemented with CLA (cis-9, trans-11 CLA and trans-10, cis-12 CLA) exhibit a higher hepatic PPARα expression associated with a higher expression of proteins involved in lipid oxidation compared with the HFD CT group( Reference Choi, Koh and Jung 48 ). Otherwise, the effects of ALA and CLA on hepatic lipid storage could have been reinforced by the ability of ALA to drastically decrease the expression of FA synthase, one of the main enzymes involved in lipogenesis( Reference Jump, Clarke and Thelen 49 ). All these hypotheses are supported by the fact that the PDC mice had higher proportions of ALA and EPA in their hepatic lipids than the SDC mice.
Notably, and curiously, the gene expression of CPT1 was not increased in the PDC mice, although it is known to be regulated by PPARα. Moreover, the activity of FA oxidation enzymes and hepatic mitochondrial β-oxidation were not monitored in the present study. These points will be the focus of future experiments to complete and strengthen the results of the present study. The increase in lipid oxidation in the liver of the PDC mice was probably associated with an increase in lipid oxidation in the adipose tissue. Indeed, the PDC mice exhibited the highest expression of uncoupling protein 2, a mitochondrial membrane transporter involved in the regulation of energy balance and body weight( Reference Fleury, Neverova and Collins 50 ). The stimulation of uncoupling protein 2 expression may be explained by the higher amounts of rumenic acid in the PDC diet. Indeed, studies have shown that CLA, not only the trans-10, cis-12 CLA isomer but also the cis-9, trans-11 CLA isomer, are able to increase the expression of uncoupling protein 2( Reference House, Cassady and Eisen 51 ). Notably, contrary to what was observed in the liver, the gene expression of PPARα was not increased in the adipose tissue of the PDC mice compared with that in the CT and SDC mice. Thus, the natural enrichment of the PDC with cis-9, trans-11 CLA and ALA may have led to enhanced hepatic lipid oxidation through the potential activation of PPARα and to enhanced energy dissipation in the adipose tissue, thereby preventing both fat mass accumulation and hypertriacylglycerolaemia.
Replacement of a standard dairy cream with a pasture dairy cream in a high-fat diet lowers metabolic inflammation
Low-grade inflammation is a metabolic hallmark of HFD feeding. It is known to increase the risk of CVD and insulin resistance( Reference Libby 52 ). Adipose tissue inflammation is the result of macrophage infiltration due to the production of MCP-1 by adipocytes( Reference Weisberg, McCann and Desai 53 ). CLA, cis-9, trans-11 CLA and trans-10, cis-12 CLA, are known to both inhibit MCP-1-induced monocyte migration and suppress inflammatory macrophage phenotype( Reference McClelland, Cox and O'Connor 54 ). Besides, ALA is known for its anti-inflammatory properties. Indeed, a study in obese rats has shown that dietary supplementation with ALA-enriched flaxseed oil is associated with a decrease in MCP-1, IL-10, TNFα and T-cell infiltration into the adipose tissue( Reference Baranowski, Enns and Blewett 10 ). A study in human subjects has also shown that the consumption of ALA-enriched cookies improves C-reactive protein concentrations in obese patients( Reference de Luis, de la Fuente and Izaola 12 ). Thus, the lower inflammation in the adipose tissue of the PDC mice may be explained by the higher amounts of cis-9, trans-11 CLA and ALA in the diet. In support of our hypothesis, lipid profiling of mouse adipose tissue revealed that the adipose tissue lipids of the PDC mice contained more ALA than those of the SDC mice. Surprisingly, the levels of CD68, CD11c and TNFα mRNA in the adipose tissue of the PDC mice were even lower than those in the adipose tissue of the CT mice (P< 0·05 for only TNFα). This might be explained by the fact that the PDC diet, apart from CLA and ALA present in the cream, also contained a soya concentrate having isoflavones and bioactive peptides with powerful anti-inflammatory properties( Reference Orgaard and Jensen 55 , Reference Chen, Zhang and Zhang 56 ). A study has shown that pre-treatment of 3T3-L1 adipocytes with soya isoflavones inhibits the pro-inflammatory effects of TNFα( Reference Yanagisawa, Sugiya and Iijima 57 ). Therefore, the combination of rumenic acid, ALA and soya products in the PDC diet might have led to a strong inhibitory effect on the onset of inflammation.
Altogether, these results reveal that PDC might (1) promote hepatic FA β-oxidation and adipose tissue energy dissipation, thus limiting fat mass accumulation and dyslipidaemia, and (2) prevent adipose tissue inflammation probably due to the presence of high amounts cis-9, trans-11 CLA and ALA in it compared with SDC.
Replacement of a standard dairy cream with a pasture dairy cream in a high-fat diet improves the protective function of the intestine
Paneth cells and goblet cells are important intestinal cells because of their involvement in the protective function of the gut epithelium. Paneth cells, which are found in the small intestine, are specialised in the secretion of defence molecules such as lysozyme and α-defensins and participate in gut microbiota homeostasis( Reference Bevins and Salzman 29 , Reference Ouellette 30 , Reference Clevers and Bevins 58 ). Goblet cells, which are also present in the colon, produce and secrete MUC2, which, after hydration, forms a gel upholstering the epithelium and guaranteeing its protection against physical, chemical and bacterial aggressions( Reference Allen, Hutton and Pearson 27 , Reference Dekker, Rossen and Buller 28 , Reference McGuckin, Linden and Sutton 59 – Reference Desai, Mutlu and Vadgama 61 ). To our knowledge, the present study is the first to show that the lipid quality of a HFD can alter the number of Paneth and goblet cells. Indeed, we found that the PDC mice had more number of Paneth cells and goblet cells than the SDC mice. The increase in the number of these cells in the intestinal epithelium of the PDC mice is a favourable consequence of the PDC diet because it strengthens the intestinal barrier protective function of the mice. Furthermore, it has been reported that the function of Paneth cells is altered in obesity and that it may have important implications for the obesity-associated shift in microbiota composition( Reference Hodin, Verdam and Grootjans 62 ). Consequently, the increase in the number of Paneth cells in response to the PDC diet is an additional element strengthening its protective effect on the onset of obesity compared with the SDC.
Goblet cells and their number and MUC2 production are increased by fibres, SCFA and casein hydrolysates( Reference Barcelo, Claustre and Toumi 63 – Reference Plaisancie, Claustre and Estienne 66 ). Therefore, we hypothesised that the modification of goblet cells in the PDC mice could be due to the lipid quality of the PDC. Among all the lipids tested, only β-sitosterol might be responsible for the increase in MUC2 production, but the results have to be confirmed by further investigations. Other hypotheses regarding lipids can be formulated. Indeed, in the colon, lipids undergo modifications such as hydrolysis, oxidations, reductions and hydroxylations because of the microbiota. Some of their products can enter into the intestinal cells and modify their physiology( Reference Nicholson, Holmes and Kinross 67 ). The composition of microbiota depends on the FA composition of the oil in a HFD( Reference Laugerette, Furet and Debard 18 ). Moreover, the number of Paneth cells was increased in the PDC mice. Therefore, we hypothesised that differences in the microbial compositions of the PDC and SDC mice could have caused the metabolism of specific lipids in the colon of the PDC mice, which, in turn, increased goblet cell number and MUC2 production. This should be the subject of further investigations.
The increase in goblet cell number and MUC2 production in the colon of the PDC mice could have led to beneficial metabolic consequences. Indeed, the increase in MUC2 production might have led to an increase in mucus gel thickness, thus creating a stronger barrier for nutrient absorption. This hypothesis is based on studies reporting that the mucus gel plays an important role in the control of intestinal permeability( Reference Chang, Alsaigh and Kistler 68 , Reference Iiboshi, Nezu and Kennedy 69 ) and lipid absorption( Reference Fuse, Bamba and Hosoda 70 , Reference Mayer, Treadwell and Gallo 71 ). Thus, the favourable metabolic consequences of PDC diet consumption might also be explained, in part, by the increase in goblet cell number in the colon of mice. This increase might have prevented the absorption of a fraction of the nutrients present in the intestine derived either from the diet or from local bacterial production. Furthermore, the increase in mucus coat thickness in the colon of the PDC mice might have decreased the proportion of lipopolysaccharide crossing from the gut lumen to the systemic circulation. Such a protective effect could explain, in part, the lower inflammation detected in the PDC mice. These two hypotheses could not be tested in the present study and will be the focus of future experiments.
The present study has some limitations. First, no detailed identification of the CLA isomers could be made. We detected in majority the cis-9, trans-11 CLA isomer, and the other CLA isomers represented less than 0·5 % of the total lipids in the creams. However, we cannot rule out that the respective amounts of these other isomers could have differed between the PDC and SDC and thus could have been partly responsible for some effects. Second, in the PDC and SDC diets, creams replaced a portion of barley present in the CT diet. Recent studies have pointed out that barley β-glucans exert beneficial metabolic effects in animals fed a HFD. These include the decrease in body weight, hepatic lipid accumulation and FA synthase expression( Reference Choi, Kim and Jung 72 ) and the increase in FA oxidation marker expression in the muscle( Reference Brockman, Chen and Gallaher 73 ). Thus, some deleterious effects of the PDC and SDC diets might be explained by the decrease in the amounts of barley β-glucan along with the increase in the lipid proportion. Furthermore, other nutrients or micronutrients in the PDC might have been involved in its effects such as β-sitosterol and desmosterol, the amounts of which varied between the creams. Moreover, the amounts of flavonoids can differ between PDC and SDC, based on the fact that mountain milks contain more polyphenols than standard milks( Reference Poulet, Fraisse and Viala 74 ). Although not measured, such an increase in the amounts of phytosterols and flavonoids in PDC might explain some metabolic impacts of the PDC diet. Indeed, phytosterols are known to improve plasma lipid profiles( Reference Misawa, Tanaka and Nomaguchi 75 ) and glucose tolerance and decrease visceral adipose tissue weight( Reference Misawa, Tanaka and Nomaguchi 75 ) and, finally, their association with n-3 PUFA decreases hepatic TAG synthesis and increases FA β-oxidation( Reference Micallef and Garg 76 ). Dietary supplementation with flavonoids has been found to have anti-obesity effects in animal models( Reference Nakagawa, Kishida and Arai 77 , Reference Kamisoyama, Honda and Tominaga 78 ). Thus, we cannot rule out that at least a fraction of the observed metabolic effects of the PDC diet could be related to the presence of higher amounts of phytosterols and polyphenols in it compared with the SDC diet.
In summary, we showed that dairy cream from cows fed on pastures (1) protects mice against metabolic disorders linked to HFD feeding through cis-9, trans-11 CLA-mediated and/or ALA-mediated effects and (2) has a strong impact on Paneth and goblet cells, enabling the improvement of the intestinal barrier protective function. Practical importance of such results in human nutrition may be foreseen because significant effects were detected in the present study using a real food naturally enriched with active micronutrients. The present study supports the further exploration of such dairy products for the nutritional management of metabolic diseases through natural and beneficial food complexity. Further studies in the field could thus lead to the optimisation of animal farming practices and take product quality into account while formulating dietary guidelines.
Acknowledgements
The authors thank P. Molière, D. Gautier and M. Van Audenheage for their assistance in FA and cream analyses; A. Paquet for her help with animal study and intestinal sample processing; P. Besson and S. Serieye for useful discussions; G. Viallaret, P. Odin and J. Favier for their help with cream preparation; and D. Martel for assistance in diet formulation.
M.-C. M. received funding from Sodiaal-Candia R&D. The funder had no role in the in vivo and in vitro data collection process and data analysis, decision to publish the manuscript or preparation of the manuscript.
The authors' contributions are as follows: B. B., P. P., A. G., O. C. and M. C. M. designed the study; B. B., P. P., A. G., M. E., C. D., E. M., E. L., P. D., J. B., F. L. and M. C. M. carried out the experiments; B. B., P. P., C. D., E. M., J. B., F. L. and M. C. M. analysed the data; B. B., P. P. and M. C. M. wrote the manuscript; A. G., H. V., C. D. and F. L. contributed to data interpretation and manuscript preparation. All authors read and approved the final manuscript.
O. C. is an employee of Sodiaal-Candia R&D.
The authors have no conflicts of interest to declare.


