


In recent years a trend within nutritional epidemiology has been to assess overall dietary quality; however, no overall standard on how to best capture the whole diet has been set( Reference Cunha, Almeida and Pereira 1 – Reference Tucker 3 ).
Several computer-driven (a posteriori) studies from the Scandinavian countries have identified dietary patterns by use of factor or cluster analysis, and some of them have reported country-specific or traditional patterns( Reference Winkvist, Hornell and Hallmans 4 – Reference Lau, Glumer and Toft 8 ). However, to our knowledge no studies have looked at patterns in the Scandinavian countries in a combined way. In a study of the diversity of dietary patterns in the European Prospective Investigation into Cancer and Nutrition (EPIC), mean dietary intake from 24h dietary recalls from each participating centre was compared with an overall EPIC mean and showed that the diet was relatively similar in the Scandinavian countries, but the proportions of what was consumed varied across countries and indicated country-specific dietary patterns( Reference Slimani, Fahey and Welch 9 ).
Among theoretically (a priori) defined patterns, the Mediterranean diet has been associated with positive health outcomes in many studies( Reference Bonaccio, Di Castelnuovo and Bonanni 10 – Reference Singh, Parsaik and Mielke 14 ). Similarly, a Nordic Food Index has been suggested for the Nordic countries. In recent studies, a Nordic diet including fish, cabbages, whole grain rye, whole grain oat, apples/pears and root vegetables has also been related to a range of beneficial health effects( Reference Adamsson, Reumark and Cederholm 15 – Reference Akesson, Andersen and Kristjansdottir 18 ).
In the HELGA project, a joint project including parts of three Scandinavian countries, the aim is to establish a Nordic comprehensive foundation for whole grain research and to generate knowledge about the health effects of whole grain foods. A high intake of whole grains has been associated with a reduced risk of several lifestyle-related diseases( Reference Aune, Chan and Lau 19 , Reference Ye, Chacko and Chou 20 ), and the whole grain consumption in Scandinavia is traditionally higher than in many European countries and the USA( Reference Kyro, Skeie and Dragsted 21 ).
There are also common whole grain recommendations for Scandinavia( 22 – 24 ), but the type of grain dominating the whole grain intake differs between countries( Reference Kyro, Skeie and Dragsted 21 ).
The aim of the present study is to identify dietary patterns for the HELGA cohort by use of principal component analysis (PCA) to see if we find a common whole grain pattern for the three countries and to see if the items suggested for a Nordic Food Index will form a typical Nordic pattern or will be distributed on several different patterns.
Method
Study population
The HELGA study population consists of sub-samples of existing cohorts from the three Scandinavian countries: the Norwegian Women and Cancer Study, the Västerbotten Intervention Programme and the Danish Diet, Cancer and Health study. All three cohorts are part of the EPIC study. The participants were recruited from the general population, but the Norwegian study only includes women. At baseline (1992–1998), the participants filled in a questionnaire regarding their habitual food intake and lifestyle. The full HELGA cohort includes a total of 120 016 participants.
The study was conducted according to the guidelines laid down in the Declaration of Helsinki. All participants gave written informed consent, and the study was approved by the local ethical committees of the participating countries.
Diet questionnaires
The HELGA cohort collected dietary information through different validated FFQ( Reference Hjartaker, Andersen and Lund 25 – Reference Parr, Veierod and Laake 28 ). Whole grain variables from the FFQ were reclassified to distinguish between the different types of whole grains (wheat, rye, oat, others), and the reclassified whole grain variables were used together with other relevant food variables in the present study.
Food intake from the dietary questionnaires was translated into main food groups and subgroups, using the food classification system developed in EPIC( Reference Slimani, Kaaks and Ferrari 29 ). Due to missing information on diet from some participants, the current study includes a total of 119 913 participants; only foods/food groups common for all three cohorts are included.
The particular food groups included in the analyses are: potatoes, vegetables, fruit, nuts/nut-spread and seeds, milk, yoghurt/thick fermented milk, cheese, dairy creams, pasta, rice, white bread, non-white bread, crisp bread/rusks, breakfast cereals, salty biscuits/aperitif biscuits/crackers, red meat, poultry, processed meat, fish, crustaceans/molluscs, fish products/fish in crumbs, egg and egg products, vegetable oils, butter, margarine, sugar/honey/jam/syrup, chocolate/candy bars/paste/confetti, ice cream/water/ice, cakes and biscuits, fruit and vegetable juices, carbonated/soft/isotonic drinks and diluted syrups, coffee/tea/herbal tea, water, alcoholic beverages, condiments and sauces, whole wheat cereal, whole rye cereal, whole oat cereal, other whole grain cereals. The whole grain cereals may be referred to as only oat, wheat or rye later in the present paper.
Other food groups were not included into the analyses due to inhomogeneous quality in questionnaire information between the countries and/or very low intakes.
The Nordic Food Index
For simplicity, and to reduce the number of variables, no subgroups of fruit and vegetables were included. Therefore the food groups used in the present study do not give detailed information about different types of fruits and vegetables, like apples, pears, cabbages and root vegetables as suggested parts of a Nordic Food Index. However, all four items were included in the food groups ‘fruit’ and ‘vegetables’; thus these food groups were used together with the food groups ‘fish’, ‘crustaceans/molluscs’, fish products/fish in crumbs’, ‘whole rye cereal’ and ‘whole oat cereal’ to examine the Nordic diet items in the patterns found.
Statistical methods
The associations between the variables were investigated by using PCA (IBM SPSS Statistics 19), the most commonly used approach in factor analysis of dietary data( Reference Edefonti, Randi and La 30 ). The factors were constructed by orthogonal varimax transformation to maintain uncorrelated factors and greater interpretability. Two criteria were used in order to choose the number of factors: the eigenvalue criterion (eigenvalue>1) and the scree plot. In addition we looked at the interpretability of the factors and how much detail they gave about whole grains since this was part of the aim.
Food items with positive loadings contribute to a dietary pattern; food items with negative loadings are inversely associated with a dietary pattern. Only items with absolute factor loadings of 0·3 or higher were considered in the interpretation of the factors. The higher the factor loading of a food item, the higher correlation of that item to that specific diet factor/pattern.
Analyses were conducted for the total cohort and separately for the different countries. Separate analyses were also performed for men and women.
The factors found in the total cohort were divided into quartiles and examined using the χ 2 test for categorical variables to look at the distribution of persons belonging to the different countries and of different genders.
To test the robustness of the patterns the data were divided randomly into two arbitrary parts and the analysis was repeated as in the total set. This procedure was done for the total cohort and for the three countries separately.
Results
Mean age for the Danish participants was approximately 8–10 years higher than for the Norwegian and Swedish participants, and they also had a lower mean intake of total whole grains. Both Denmark and Sweden had rye as their main whole grain item, while Norway had highest consumption of wheat (Table 1).
Table 1 Characteristics of the total cohort and by country. The HELGA project

* Do not reach 100 % due to missing values.
The Danish participants had the highest consumption of fruit and vegetables; however, they also had the highest consumption of alcohol and red meat, and they had the highest BMI (mean 26 kg/m2) compared with the other countries (Table 1).
Sweden had the lowest consumption of non-white bread, and had a substantially higher consumption of crisp bread and breakfast cereals than both Norway and Denmark (Table 1).
Patterns from principal component analysis: total cohort
The eigenvalue criterion alone indicated that there were ten important factors for the total cohort (Norway, Sweden and Denmark together). However, the scree plot indicated that only six factors were of importance. When studying the factors, all six factors were interpretable but the strong overlapping of the factors suggested that a three- or four-factor solution would be more meaningful. The three-factor solution revealed one fish factor (fish, fish products, vegetables and non-white bread), one meat factor (red meat, poultry, coffee, water and alcohol) and one cereal factor (white bread, crisp bread, breakfast cereals and cakes). We decided, however, to go for the four-factor solution since this gave more detailed information about whole grains (Table 2).
Table 2 Factor loadings for the four-factor solution (dietary patterns) patterns in the total cohortFootnote *. The HELGA project

* Factor loadings below ±0·30 are not listed in the table.
The patterns in the four-factor solution were named ‘meat and beverages’, ‘bread and potatoes’, ‘fish and non-white bread’ and ‘cereals and vegetables’, based on the food items with the highest loadings in each pattern or the food items most characteristic for the pattern (an item may give name to a pattern even though other items have higher loadings because these items are seen to supplement the naming item, e.g. ‘bread pattern’ where margarine had higher loading but is associated with buttered sandwiches). The ‘cereals and vegetables’ pattern had highest loading on oat, but had quite high loadings on rye and other grains as well. The ‘bread and potatoes’ pattern had the highest loadings on rye and other whole grains, and the ‘fish and non-white bread’ had the highest loading on wheat. The ‘meat’ pattern and the ‘fish’ pattern remained the same as in the three-factor solution. The four factors explained 33 % of the variation (Table 2).
The ‘meat and beverages’ pattern was completely dominated by the Danes in the highest quartiles, while they were almost absent in the lowest ones. There was also a higher percentage of male participants in the highest quartile. The ‘bread and potatoes’ pattern had a higher percentage of the Swedish participants in the highest quartile, and more than 50 % of male participants were found here. The ‘fish and non-white bread’ pattern was highly dominated by Norwegians in the highest quartile; however, males and females were more evenly distributed across the quartiles. While a slightly higher percentage of the Danes and Swedes were found in the highest quartile of the ‘cereals and vegetables’ pattern, only 9 % of the Norwegian participants were found here. Again, males and females were evenly distributed across the quartiles (Table 3).
Table 3 Distribution of countries and genders in the dietary patterns of the total cohort. The HELGA project

As for the items indicating the Nordic Food Index, they were distributed between three patterns: ‘bread and potatoes’ (with whole grain rye), ‘fish and non-white bread’ (with vegetables and fish) and ‘cereals and vegetable’ (with fruit, vegetables and whole grain oat).
When looking separately at the males, three distinct factors appeared when taking whole grains into consideration (see online supplementary material, Supplemental Table 1). The first factor was a ‘meat and fish’ pattern scoring high on red meat, poultry, fish, egg products and vegetables. It also had a high score on non-white bread; however, it did not score high on any of the whole grain variables. The second factor made a ‘bread’ pattern with white bread, crisp bread, processed meat, margarine and cakes. It had the highest score on rye and other grains. The third factor was named ‘cereal’ pattern because of its high score on breakfast cereals and all the whole grain items, especially wheat and oat.
For women in the total cohort we saw three patterns as well (Supplemental Table 1); however, this time there were a ‘meat and beverages’ pattern, a ‘cereal’ pattern and a ‘fish and non-white bread’ pattern. The first pattern scored high on red meat and egg, as well as most of the drinks. The second pattern scored high on crisp bread, breakfast cereals and on all of the whole grain items except wheat. The last pattern had a high score on non-white bread, fish and fish products, and scored highest on wheat. This pattern was dominated by Norwegians (data not shown).
Patterns from principal component analysis: country specific
When studying the factors for the different countries, a three- or four-factor solution was most meaningful for all three countries. A four-factor solution gave a little more detailed information that was lost with a three-factor solution. However, as the whole grain factors remained unchanged whether three or four factors were included, and to ensure comparability between countries, we went for the three-factor solution (Table 4).
Table 4 Factor loadings for the patterns found in Norway, Sweden and Denmark for the total cohort*. The HELGA project
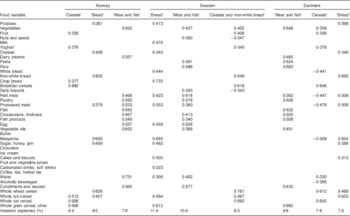
* Factor loadings below ±0·30 are not listed in the table.
Norway
The three-factor solution (Table 4, Fig. 1(c)) revealed what we may call a ‘cereal’ pattern which includes breakfast cereals, rye, oat and other whole grain items. The second pattern was a ‘bread’ pattern, with non-white bread, jam, margarine and whole-grain wheat, and the last pattern was a ‘meat and fish’ pattern including items like fish and fish products, meat and meat products, vegetables, condiments and sauces, and water. The scores were only moderately high for meat and fish items. The three factors explained 25 % of the variation.

Fig. 1 Dietary patterns for Swedish (a), Danish (b) and Norwegian (c) women. The HELGA project
For Norway, items included in the Nordic Food Index were divided between two patterns: the ‘cereal’ pattern (fruit, whole grain rye and whole grain oat) and the ‘meat and fish’ pattern (fish, fish products and vegetables).
Sweden
We found the same type of pattern in Sweden as in Norway, but they differed from one another in content. The first pattern, a ‘bread’ pattern, included white bread, crisp bread, processed meat, margarine, jam, cakes, whole grain rye and other whole grains. The second pattern was named ‘meat and fish’ and scored high on red meat as well as pasta and rice, but did not score high on fish, and only moderately high on fish products. The third pattern, named ‘cereals and non-white bread’, scored high on non-white bread and breakfast cereals, as well as on all the main whole grain cereals (Table 4). The three factors explained 29 % of the variation.
Sweden was quite comparable to Norway concerning Nordic Food Index items, with fruit, vegetables, whole grain rye and whole grain oat in the ‘cereal’ pattern, and vegetables, crustaceans and fish products in the ‘meat and fish’ pattern.
In gender-specific analyses, we found the same three patterns for both men (Fig. 2(a), Supplemental Table 2) and women (Fig. 1(a), Supplemental Table 3); one ‘cereal’ pattern with non-white bread and breakfast cereals, one ‘meat and fish’ pattern with meat and fish products, and one ‘bread’ pattern with white bread, crisp bread and sweet products. However, the ‘meat and fish’ patterns and the ‘bread’ patterns did not appear in the same order. The three factors explained 29 % of the variation for men and 27 % for women.

Fig. 2 Dietary patterns for Swedish (a) and Danish (b) men. The HELGA project
Denmark
The first pattern for Denmark was a ‘meat and fish’ pattern with moderately high scores on meat and fish, and with quite high scores on pasta, rice and vegetables. It also had a high score on other whole grains. The second pattern was a ‘cereals’ pattern that scored high on breakfast cereals, wheat and oat. A ‘bread’ pattern was seen for Denmark as well, including non-white bread, processed meat, margarine and rye (Table 4). The three factors explained 24 % of the variation.
Unlike Sweden and Norway, the Nordic Food Index items were divided on all three patterns; the ‘cereals’ pattern (fruit, vegetables and whole grain oat), the ‘bread’ pattern (whole grain rye) and the ‘meat and fish’ pattern (vegetables and fish/fish products).
When divided into men and women, Danish men had a ‘meat and fish’ pattern, a ‘cereals’ pattern and a ‘bread’ pattern (Fig. 2(b), Supplemental Table 2), as seen for total men. The ‘cereals’ pattern had high scores on breakfast cereals and wheat and oat. The ‘bread’ pattern had high scores on non-white bread and rye. The ‘meat and fish pattern’ had highest scores on rice and other grains and moderately high scores on the different meat and fish items.
Danish females (Fig. 1(b), Supplemental Table 3) had a ‘poultry and fish’ pattern with highest scores on vegetables, rice and other whole grains, and moderately high scores on poultry and fish. The ‘cereals’ pattern was similar to the men’s ‘cereals’ pattern with breakfast cereals, wheat and oat as main items. The ‘bread’ pattern seen for Danish women was similar to the men’s, with non-white bread, margarine and rye as main items. The three factors explained 24 % of the variation for men and 23 % for women.
Comparing the countries on gender
The ‘cereal’ patterns for women (Fig. 1(a)–(c)) were quite similar in all three countries. However, looking at the whole grain contribution to the patterns, we found some differences. In Norway, this pattern had high loadings on rye, oat and other grains, while the Swedish ‘cereal’ pattern included non-white bread and loaded highest on wheat, rye and oat. Danish women had high loadings on wheat and oat in their cereal pattern.
The ‘bread’ patterns may be called ‘traditional’ patterns as they express the traditional way of consuming bread in Scandinavia, with open sandwiches dressed with margarine, cheese, jam or meat/processed meat. A closer look at the food items in the ‘traditional’ bread patterns revealed big differences. In Norway and Denmark non-white bread appeared with the traditional sandwich dressings, while in Sweden white bread and crisp bread were found together with the sandwich dressings. In addition, the Swedish pattern included several sweet items: chocolate, cakes, ice cream and soft drinks. The whole grain items in these patterns were different too; in Norway wheat was the main item, Sweden scored highest on other whole grains and moderately high on rye, while Denmark scored highest on rye and moderately high on wheat.
The ‘meat and fish’ patterns were quite compatible for women in Norway and Sweden, but the Swedish pattern did not include fish, only crustaceans and fish products. They also shared some similarities with the Danish women’s ‘poultry and fish’ pattern. However, the Danish pattern did not include red and processed meat or fish products. None of the countries had patterns that were very similar to the patterns for females in the total cohort.
The patterns for men (Fig. 2(a) and (b)) were almost similar to what we saw for women in the respective countries, except that Danish women had a ‘poultry and fish’ pattern that did not include red meat and fish products as found in the ‘meat and fish’ pattern for Danish men. Thus, the differences between Swedish and Danish men were approximately the same as seen between Swedish and Danish women. Compared with the patterns for men in the total cohort, most similarities were seen in the Swedish patterns.
Robustness of the patterns
When dividing the data set randomly in two equal sized parts, both for the total cohort and in country-specific analyses, the same patterns appeared as in the main analyses, only with slightly different factor loadings.
Discussion
Our data indicate that even though we find similar dietary patterns in the Scandinavian countries, the food items representing the patterns reflect slightly different food cultures. Hence, one should be careful when treating the Scandinavian or Nordic countries as one.
Our results are in accordance with a previous study of Mäkelä et al. that found differences between meal patterns in the Nordic countries, with most similarities between Norway and Denmark, and between Sweden and Finland( Reference Makela, Kjaernes and Pipping 31 ). It also supports to some extent results shown in country-specific studies( Reference Winkvist, Hornell and Hallmans 4 – Reference Lau, Glumer and Toft 8 ). A traditional pattern found by factor analysis in The Oslo Health Study( Reference Kjollesdal, Holmboe-Ottesen and Wandel 5 ) corresponds to a fish pattern we found when we tried out a four-factor solution for Norway, and it also corresponds to the ‘traditional fish eaters’ pattern formerly found in the present Norwegian cohort( Reference Engeset, Alsaker and Ciampi 7 ). The Norwegian cohort was previously used for pattern analysis; however with a different approach and with different variables involved. The previous study revealed six different patterns, and two of the patterns were quite similar to two of the patterns found here; a ‘healthy eater’ pattern similar to our cereal pattern and a ‘traditional bread eater’ pattern similar to our traditional bread pattern.
Pattern analysis was previously performed on males in the present Danish cohort as well( Reference Gorst-Rasmussen, Dahm and Dethlefsen 32 ). Both PCA and Treelet transform were used to explore the patterns, and seven different factors were found both in PCA and Treelet transform. When comparing the results from the PCA with our results, one factor is quite similar to our Danish ‘bread’ and one is close to our Danish ‘meat’ pattern. However, the choice of factors and the food group classification are different from our study; hence a direct comparison is not possible.
Additional analysis has not been performed on the entire Swedish cohort, but parts of the Västerbotten Intervention Programme constitute a part of the present Swedish cohort where Winkvist et al.( Reference Winkvist, Hornell and Hallmans 4 ) reported patterns they assumed were more typical for Sweden. These patterns can to some extent correspond to the Swedish patterns we found, although it is difficult to compare the results since the analysis was done on a different cohort and different food items, and cluster analysis was performed, not PCA. The traditional pattern found by Wirfält et al. ( Reference Wirfalt, Mattisson and Gullberg 6 ) in analysis of the Malmö Diet and Cancer study is quite similar to our Swedish bread pattern when comes to food items: white bread, sweets and soft drinks, but like for Winkvist et al. it is difficult to compare directly.
Patterns similar to our cereal pattern are found by several researchers; Hu et al.( Reference Hu, Rimm and Stampfer 33 ) identified two different patterns by use of PCA in the Health Professionals Follow-up Study in the USA and named them ‘prudent’ and ‘western’. The ‘prudent’ pattern had high scores on fruit and vegetables, fish, poultry and whole grains. Another American study by Hsiao et al.( Reference Hsiao, Mitchell and Coffman 34 ) identified, by means of cluster analysis, three patterns which they called ‘western-like’, ‘low produce, high sweets’ and ‘more healthful’. The ‘more healthful’ pattern was characterised by high intakes of fruits, vegetables, whole grains, eggs, nuts, legumes and dairy products. A Greek study( Reference Yannakoulia, Yiannakouris and Melistas 35 ) on healthy women identified ten patterns by the use of PCA, one of them a pattern with high scores on whole grain cereals and low-fat dairy. None of the studies has distinguished between different types of whole grains.
Our results confirm the results from a recent analysis of HELGA, based on data from 24 h dietary recalls( Reference Kyro, Skeie and Dragsted 21 ), where large differences in the type of whole grains used in Scandinavian countries were found; predominantly wheat in Norway, and rye in Sweden and Denmark.
The strength of the present study is the large sample size and the use of standardized data from validated questionnaires( Reference Hjartaker, Andersen and Lund 25 – Reference Parr, Veierod and Laake 28 ), in addition to the detailed information on intake of whole grains gained from the reclassification of the food variables.
FFQ are commonly known to have errors (inadequate food lists, inappropriate response categories, under- or over-reporting, etc.). The FFQ in the present study differ in design and are specific for each country, thus the details behind each food group included in the study may vary. This may be considered a limitation of the study.
There is an over-representation of persons with high socio-economic status in all three cohorts( Reference Lund, Kumle and Braaten 36 – Reference Weinehall, Hallgren and Westman 38 ), therefore the results may not be representative for the general population. Participants were recruited from all over Norway, but only from certain areas in Sweden and Denmark. However, participants were recruited from both rural and urban areas and may to some extent be considered to represent the entire countries, or regions( Reference Lund, Kumle and Braaten 36 – Reference Weinehall, Hallgren and Westman 38 ). Only the age groups represented in the current study can be considered; hence the findings do not reflect young people and in Norway they only reflect women.
The factors used in the analysis explained between 33 % (total cohort) and 23 % (Danish women) of the variation. This is the percentage of the variation that could be explained based on the criteria used to choose the number of factors; the rest is ‘noise’. The factors cannot explain all the food choices of Scandinavian people, but represent those that can be identified and interpreted in the midst of the ‘noise’. A higher number of factors would give a higher variation explained; however, the factors would give less meaning. The ‘noise’ only indicates that there are other dietary patterns than the ones mentioned here; but as explained in the Results section, they may be strongly overlapping the factors we have chosen.
The patterns were given approximately the same names in all three countries based on the food items characterising the patterns. However, a closer look at all the items included in each pattern revealed some differences between the countries and thus the names can be somewhat misleading. They were chosen based on the food items with the highest loadings in each pattern or most characteristic for the pattern (e.g. ‘bread’ pattern, because products with higher scores, like margarine, are associated with bread/sandwiches; or ‘meat’ pattern where vegetables, rice and pasta may have higher scores, but will be served with meat as the main dish). Therefore, patterns with the same names may include quite different food items, except for those representing the names. It is therefore important not to look only at the names, but to study patterns given the same names more closely. Factor analyses are encumbered with other subjective choices than the naming of patterns as well; the choice of how many factors to keep is another subjective choice to make. In our case we were most interested in whole grain items, and the factors were chosen based on what gives best information on whole grains.
Summing up, our data indicate that there are similar dietary patterns in the Scandinavian countries, however with differences reflecting different food cultures. The cereal pattern found in all three countries for both men and women, with high loadings on breakfast cereals and whole grain oat, may be considered a common Scandinavian whole grain pattern.
Food wise, the bread patterns seen for Norway and Denmark look quite similar. The Swedish bread pattern differs from the other two countries with white bread and crisp bread instead of non-white bread, and more sweet food items. However, the main whole grain in the Norwegian bread pattern is wheat, while it is rye in both Denmark and Sweden. The meat pattern for Danish women differs from the other meat patterns since it does not include red or processed meat, only poultry and fish.
There are some gender differences in Denmark compared with Sweden, where men and women seem to share the same patterns.
Food items suggested to belong to a Nordic Food Index were found in three patterns for the total cohort and in Denmark, and in two patterns for Norway and Sweden.
The results from the current study are adding some information about food habits and patterns in Scandinavia and may be useful for Scandinavian health authorities when revising their food recommendations.
Acknowledgements
Financial support: This research was supported by NordForsk – Centre of Excellence Programme HELGA (070015). The funder had no role in the design, analysis or writing of this article. Conflict of interest: None. Authorship: All authors contributed with formulation and critical evaluation of the manuscript. D.H. also gave statistical advice. D.E. performed all statistical analyses and is the main author of the manuscript. Ethics of human subject participation: The study was conducted according to the guidelines laid down in the Declaration of Helsinki. All participants gave written informed consent, and the study was approved by the local ethical committees of the participating countries.
Supplementary material
To view supplementary material for this article, please visit http://dx.doi.org/10.1017/S1368980014001104


