


Energy intake (EI) and diet composition are related to a range of preventable diseases such as obesity, heart disease, diabetes, disorders of lipid metabolism and some cancers. National dietary and public health policies are heavily influenced by large-scale surveys of dietary intakes in relation to a panoply of health outcomes( Reference Kant and Graubard 1 – Reference Romaguera, Guevara and Norat 4 ). Given the scale of interest and resources invested in elucidating the relationship between diet and disease, it is remarkable that so little attention has been given to the fact that, with the exception of the direct observation in laboratory and clinical settings, all dietary intake measurements are self-reported and prone to distortion by the subject. This does not imply that researchers are unaware of the problem of misreporting of dietary intakes( Reference Macdiarmid and Blundell 5 – Reference Forrestal 8 ). They simply do not have sufficiently accurate tools at their disposal to account for this problem, and large-scale dietary surveys are obliged to resort to approximate measures that necessitate assumptions about the energy balance (EB) of subjects studied( Reference Rennie, Coward and Jebb 9 , Reference Tooze, Krebs-Smith and Troiano 10 ).
It became apparent over 20 years ago that a large proportion of dietary intake assessments do not represent a plausible level of habitual intake high enough to maintain EB. The development of isotopic techniques to objectively measure total energy expenditure (EE) revealed that reporting of EI in study groups usually falls short of actual EE, implying that subjects were either in a negative EB or were misreporting their EI( Reference Prentice, Black and Coward 11 – Reference Schoeller 15 ). Based on the fundamental principles of EB, it is now generally accepted that under-reporting or misreporting is widespread( Reference Livingstone and Black 6 , Reference Black, Prentice and Goldberg 14 , Reference Black and Cole 16 ). In other words, a large proportion of subjects in diet surveys misreport their energy (and probably nutrient) intakes to an extent that would probably distort the relationships between diet and health that inform policy decisions( Reference Rennie, Coward and Jebb 9 ).
Despite these considerations, little work has been done to examine the extent to which dietary intake assessments relate to actual food intake. The discrepancy between what people eat and what they say they eat has rarely been directly measured( Reference Singh, Martin and Hickey 7 , Reference Poppitt, Swann and Black 17 ). Instead, a number of attempts have been made to ‘correct’ for misreporting statistically by excluding subjects with implausibly low EI from analyses. Initial attempts were made to establish EI:BMR ratios at which intakes can be deemed implausibly low. These cut-offs have been called the Goldberg cut-offs( Reference Black, Goldberg and Jebb 18 ). Their use has been inconsistent but widespread in attempting to identify and exclude misreporters from analysis of diet surveys. However, the Goldberg cut-offs only identify implausibly low EI( Reference Livingstone and Black 6 , Reference Black 19 ). This practice itself requires a number of assumptions, which render the whole process approximate when assessing the degree of misreporting. For example, linear regression equations to predict BMR are approximate and physical activity levels are usually assumed. Moreover, the inclusion or exclusion of misreporters of food intake may distort relationships under investigation( Reference Macdiarmid and Blundell 5 ), because higher reported intakes are also affected by misreporting and are more likely in those with higher activity levels.
Validation of food intake records most commonly compares one self-reported method of collecting dietary intake data with other self-reported methods( Reference Block 20 – Reference Masson, McNeill and Tomany 22 ). Clearly, if dietary misreporting is a property of the subject itself, those errors between techniques may co-vary, giving false validity of a new technique. A valid report should be free of altered feeding behaviour, such as change in dietary patterns (be it actual behaviour or the subject's report of that behaviour) or false memory. For a report of food intake to be valid, it must reflect what an individual eats and drinks over the measurement period( Reference Livingstone and Black 6 ).
Attempts have also been made to validate dietary intakes using water( Reference Goris and Westerterp 23 – Reference Goris, Meijer and Westerterp 25 ) or N balance( Reference Bingham and Cummings 26 – Reference Bingham, Murphy and Waller 28 ). These approaches assume that water and N are fixed proportions of the diet, which of course they are not. At present, there is no reliable biomarker of energy or macronutrient intake that will quantify the nature and extent of misreporting( Reference Livingstone and Black 6 ). Its true nature and extent are largely unknown.
The overall aim of the present study was to directly measure the nature and extent of misreporting of dietary intakes under carefully controlled laboratory conditions.
The objectives of the present study were to use measures of EB to (1) develop and validate a ‘gold standard’ measurement of food intake against which self-reported methods can be compared, (2) compare in fifty-nine UK adults, food intake using different self-reported measures with the ‘gold standard’, under ad libitum feeding conditions in a laboratory environment specifically designed to monitor the accuracy of reporting of dietary intakes, and (3) examine the effect of self-recording intake on actual feeding behaviour in men and women.
Methods and materials
Study design
Subjects
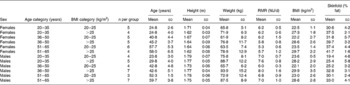
A total of thirty normal weight and twenty-nine overweight men and women were recruited from the Aberdeen area. The men and women were stratified into three age categories (20–35, 36–50 and 51–65 years) and two BMI categories (20–25 and >25 kg/m2). Table 1 gives details on the age, height, weight, BMI, RMR and percentage of body fat of the subjects who were included in the study. The purpose of the study was, necessarily, not explained to the subjects. They were informed that the study examined the relationships between diet and lifestyle. All subjects were apparently healthy, and smokers were excluded.
Table 1 Baseline characteristics of the study participants by sex, age and BMI groups (Mean values and standard deviations)
Concept and design of the study
The aim was to develop a ‘gold standard’ measurement of food intake against which common self-reported dietary intake methods could be evaluated. The ‘gold standard’ was obtained by covertly monitoring the food intake of subjects who were given access to their own individual kitchen and store of food. Food intake was covertly measured as food disappearance from the individual kitchens. The ‘gold standard’, here termed ‘laboratory-weighed intakes’ (LWI), was then validated by comparison with independent measures of the components of EB; EE was measured using doubly labelled water (DLW) and body weight was recorded daily. Thus, EI − EE was compared with EB estimated from changes in weight. Once validated, the ‘gold standard’ measure of food intake (LWI) was then compared with four common methods for self-assessing food intake in diet surveys.
Protocol
Fig. 1 describes the experimental protocol. On days 1 and 2, subjects were fed a fixed diet designed to maintain EB estimated at 1·6 and 1·5 times RMR, for men and women, respectively. The diet comprised, as a percentage of energy, 35 % fat, 55 % carbohydrate and 15 % protein.
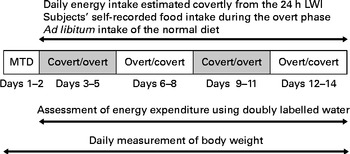
Fig. 1 Experimental protocol. LWI, laboratory-weighed intakes; MTD, maintenance days.
Subjects were studied in a randomised cross-over design for 12 d. During days 3 to 14, food intake of the subjects was quantified covertly by trained staff (see below). A 7 d diet history (DH), completed before the study, and shopping list records were used to formulate a list of foods and beverages usually consumed by each subject. Each subject had ad libitum access to these foods and beverages throughout days 3 to 14. Subjects were asked whether the variety of the food was to their liking, and whether the investigator had omitted any food items usually consumed. If food items had been omitted, these were then purchased and included in the subjects' selection of habitual food intake.
During days 3 to 14, subjects were studied under the specifically developed environment of the Feeding Behaviour Suite at the Human Nutrition Unit (HNU) at the Rowett Institute of Nutrition and Health. The HNU had a residential suite, which was specifically tailored for unobtrusive, precise, accurate measures of energy and nutrient intakes in volunteers. This environment simulated a natural environment, but enabled the nature and extent of misreporting of dietary intakes to be quantified. Normally, food was cooked and provided to volunteers in the metabolic kitchens. This suite was extended for the present study by adding a specifically designed facility that enabled the amount of ingredients used in food preparation and subsequent ingestion to be quantified covertly by staff members. This was achieved by a system in which subjects could not throw leftovers away. All used dishes and cooking utensils were placed in a section of their own kitchen to be removed and surreptitiously quantified by staff. Each subject only had key access to his/her own kitchen. This approach was important since recording errors can arise from errors in the estimate of ingredients used in both preparation and ingestion. Video cameras continually monitored feeding behaviour and compliance to the protocol. Combination of these data allowed the size, frequency, composition of meals and cooking methods to be monitored. Thus, throughout days 3 to 14, in the HNU, each subject's feeding behaviour was continuously but unobtrusively monitored in the following ways. (1) Each subject could only access food from their own specific kitchen, which contained a fridge, freezer and a cupboard for storage of fresh and dried produce containing food to which only they were allowed ad libitum access. The kitchen contained a small discrete camera and video data were used to cross check, item by item, the validity of the food intakes, calculated from the weight of foods eaten, as determined by the investigators. This qualitative information provided reassurance that the subjects complied with the protocol, i.e. they ate the foods provided. (2) All parts of the HNU were monitored by video camera with the exception of the subjects' private rooms and bathroom facilities. Subjects were not allowed to take food into these areas. Subjects were informed that cameras were present for security purposes, although they were not made overtly aware of the camera in their larders, which resembled an infrared motion detector commonly used in burglar alarm systems. (3) The purpose of the study was to monitor the actual food intake of subjects. Because the subjects were continually resident in the HNU, considerable effort was made to create a comfortable environment. There was continuous staff cover from 07.00 to 21.00 hours throughout the study and a member of staff was on call outside of these hours. If a subject left the laboratory grounds at anytime during the twelve measurement days, they were accompanied and observed by a member of staff. It was not possible for anyone to enter or leave the HNU without being monitored by the Institute's security system.
The 12 d used to quantify the nature and extent of misreporting of food intakes were broken down into four groups of 3 d, the order of which was counterbalanced across the subjects. There were two 3 d overt phases and two 3 d covert phases. During the overt phases, subjects were asked to quantify their food intake using a number of self-reporting methods (see below). Furthermore, during the covert phases, subjects were asked to not to quantify their food intake. During this time frame, food intake was covertly quantified on a daily basis by an investigator using the LWI method.
Description of the laboratory-weighed intake method
All food items were weighed, by research staff, to the nearest 0·1 g on digital scales (Soehnle model 820; Soehnle-Waagen GmbH or Ravencourt model 333; Ravencourt) including the weight of packaging before they were placed into each subject's personal kitchen on day 3. Each subject received bottled water for drinking and their own individual kettle in order to estimate water consumption.
Each subject was given full verbal and written instructions regarding the kitchens including information on waste and packaging and use of kettles and water. Each subject was instructed not to throw any waste away including packaging of food items and peelings and leftovers from meals. Every kitchen contained a special bin for all waste and packaging, with all waste items individually wrapped. Subjects were also instructed not to do any washing of dishes.
Each morning an investigator entered the kitchen before the subject awoke, typically before 06.00 hours, and re-weighed all food items contained in the kitchen using digital scales. These LWI included weights of any leftovers including peelings, packaging found in the subjects' individual bins. This enabled accurate estimates of 24 h food intake to be calculated. This information was then transcribed onto a 24 h summary sheet along with a full description of each food item. Subjects were unaware of this procedure, and this constituted the ‘gold standard’ against which to compare self-reported food intakes.
Each 24 h summary sheet was doubled checked for errors by cross-checking weights of individual food items, and then entered into Diet 5 (Robert Gordon University, Aberdeen), a computerised version of McCance and Widdowson's composition of foods and supplements( Reference Holland, Welch and Unwin 29 ).
Validation of the laboratory-weighed intakes
Components of energy balance
The validation of EI against estimated EE rests on the fundamental physiological equation:
 $$\begin{eqnarray} EI = total\,EE\pm \Delta \,body\,stores. \end{eqnarray}$$
By comparing EI minus EE with the change in weight for the group of subjects, it was possible to compare two independent measures of EB. Good agreement between the two estimates of EB indicates that actual EI, as measured by LWI, was accurately measured, provided EE and energy stores (i.e. change in body weight) were measured with reasonable precision and accurately.
Measurement of energy expenditure using doubly labelled water
On the morning of day 3, subjects received a bolus dose of DLW to estimate total EE during the 12 d period (see Fig. 1). At 07.00 hours, subjects were woken and asked to empty their bladders and were weighed. At 09.00 hours, they gave a sample of urine to be used as baseline, along with two further background samples collected on the maintenance days to provide information on the pre-dose isotopic enrichment of the subjects' body water pools. Immediately after providing the 09.00-hour sample, each subject was asked to consume a pre-prepared dose of 2H2 18O. The dose, bottle and straw used for dose consumption were weighed before and after dosing to two decimal places to allow for accurate determination of the quantity consumed by the subject. Subjects also consumed 100 ml tap water after the dose to prevent the dose being lost from the subjects' buccal cavity. The dose levels were 0·15 g/kg body weight of a 99 % 2H2O–H2O mixture and 1·5 g/kg body weight of a 10·0 % H2 18O–H2O mixture for subjects one to forty-two and forty-four. Dose levels of oxygen 18 were reduced to 0·9 kg body weight for the last nineteen subjects (i.e. forty-three and forty-five to fifty-nine) because of the world shortage in DLW at the time of the experiment. The dose was made up as a single dose that was sealed and autoclaved the day before dosing. Subjects then collected urine samples at 4, 5 and 6 h after dosing to enable the plateau to be individually measured( Reference Coward, Cole, Whitehead and Prentice 30 ). For days 4 to 14 inclusive, subjects continued to collect urine samples, at 11.00 hours, which were frozen at − 20°C until analysis.
Calculation of average daily energy expenditure over the 12 d period
Urine samples were collected for a multi-point stable-isotope analysis using gas isotope ratio MS. The log-transformed data of enrichment by time were extrapolated back to time 0, giving a theoretical enrichment at time 0, which provided information on the individual's size of the body water pool assuming the dilution principle.
Isotopic enrichment of the post-dose urine samples was analysed relative to the original background amounts. Pool sizes and flux rates were calculated as described by Coward( Reference Coward and Prentice 31 ). EE was calculated from CO2 production using the Weir equation( Reference Black, Prentice and Coward 32 ):
 $$\begin{eqnarray} EE = 4\cdot 63CO_{2} + 16\cdot 49(CO_{2}/RQ), \end{eqnarray}$$
where RQ is the respiratory quotient. Food quotient was substituted for RQ as it was assumed to be equivalent( Reference Black, Prentice and Coward 32 ). For each individual subject, food quotient was calculated from macronutrient intakes taken from the LWI, after having adjusted for changes in fat stores resulting from energy imbalance (body-weight gain or loss) over the DLW measurement period, and assuming an energy value of 29 MJ/kg and that all changes in body stores were in the form of fat( Reference Black, Prentice and Coward 32 ).
The use of the DLW technique enabled an accurate determination of average daily total EE for the duration of the study.
RMR
Respiratory exchange was measured using a ventilated hood system (Deltatrac II, MBM-200; Datex Instrumentarium Corporation) under standardised conditions in subjects who were fasted for 12 h from the previous night. RMR was calculated using the equations of Elia & Livesey( Reference Elia and Livesey 33 ).
Energy storage
Body composition measures
Weight was measured on a digital platform scale (DIGI DS-410; CMS Weighing Equipment) to the nearest 0·01 kg on a daily basis after voiding and before eating. Subjects were weighed in dressing gowns of a known weight, and body weight was then corrected back to nude.
Height was measured to the nearest 0·5 cm on day 3 using a portable stadiometer (Holtain Limited). The percentage of body fat was estimated on day 3 using the skinfold technique( Reference Durnin and Womersley 34 ).
Self-reported measures of food intake
Weighed dietary records
Subjects were instructed to carry out two 3 d weighed dietary records (WDR) over the 12 d period. These 3 d WDR occurred during the overt phases of the 12 d. Each 3 d period was matched to 3 d of non-weighing (covert phase), with the order of the overt and covert phases randomised across the subjects. Each subject was asked to weigh, using portable scales (Soehnle model 820; Soehnle), and record in a food diary all food items eaten and all fluids drunk( Reference Bingham 21 ). Scales were calibrated before use by the subjects. Full written and verbal information on how to carry this out was given at the beginning of the study.
24 h recalls
A trained member of staff carried out six 24 h recalls based on the multiple-pass design( Reference Jonnalagadda, Mitchell and Smiciklas-Wright 35 ). Each 24 h recall was conducted the day after a WDR was completed during the overt phase of the 12 d, hence following the same randomisation as the 3 d WDR. Suitable portion sizes and weights were assigned to each food item( 36 ).
7 d diet history
Subjects completed a 7 d, multiple-pass, DH with a trained member of staff before the study( Reference Jonnalagadda, Mitchell and Smiciklas-Wright 35 ). Subjects were asked to describe what their usual food intake would be in a week, in household terms. Each DH was entered into a spreadsheet, and suitable portion sizes were assigned to each food item from the UK Food Standard Agency book on average portion sizes( 36 ).
FFQ
Subjects completed a 150-item, semi-quantitative FFQ on two occasions. The FFQ was developed as a general tool for dietary assessment, and relates to the frequency of consumption of specific foods over the preceding 2 to 3 months( Reference Masson, McNeill and Tomany 22 ). On day 1, subjects were asked to complete the FFQ with reference to the previous 2 to 3 months (FFQ1), and the previous 14 d on day 15 (FFQ2). Mean daily energy and nutrient intakes were obtained.
Food intake analysis
Analyses were carried out for 24 h energy and nutrient intakes from the LWI, 3 d WDR, 24 h recall and the 7 d DH using Diet 5 (Robert Gordon University, Aberdeen). Nutritional information from manufacturers was added to the Diet 5 database for processed foods. Dietary data were then exported from Diet 5 and a series of checks for outliers and erroneous values (such as 100 g of instant coffee instead of 1 g) made.
Recruitment and ethics
Prospective volunteers were invited to visit the HNU. All procedures involved in the study and any discomfort or risk they may have posed were explained. The present study was conducted according to the guidelines laid down in the Declaration of Helsinki, and all procedures involving human subjects were approved by the Joint Ethical Committee of the Grampian Health Board and the University of Aberdeen. Written informed consent was obtained from all subjects.
Statistical analyses
All analyses were performed using the Genstat 5 release 4.1 statistical package (Genstat 5 Committee, Numerical Algorithms Group, 1997). Paired Student's t tests were used for comparison of EI (LWI) with EE (DLW). A Bland–Altman plot was used to compare the deviations between the methods used for the assessment of EB. ANOVA was used to compare differences in food intake methods observed between men and women and between different BMI categories and also for average EI, EE, change in body weight over the 12 d period and EB (EI − EE).
Linear regressions, and segmented linear regressions, were carried out to examine the relationship between the average rate of weight change per d and energy difference (intake minus expenditure) for (1) all subjects, (2) male and females, (3) subjects with a BMI ≤ 25 and >25 kg/m2.
Results
Validation of the covert-weighed intakes with the components of energy balance
Energy intake
Table 2 gives the average daily EI (LWI), expenditure and balance. The average daily EI calculated from the LWI was 11·3 MJ for the fifty-nine subjects. Men consumed 17 % more energy than women. There was no significant difference between LWI EI or EE estimated from DLW (n 59, P= 0·652). The relationship between EI and EE was also plotted as a Bland–Altman diagram (Fig. 2). This plot shows the spread of the differences (EI − EE) against the mean of the two methods. There were four individuals outside the ± 2 sd limits. These outliers were associated with individual changes in body weight over the DLW measurement period. Overall, it can be demonstrated that there is a good spread in the data with no apparent trend. As might be expected, there were significant differences in EE between men and women (P< 0·001), with men expending 12·14 MJ/d compared with 9·91 MJ/d for women (sed 0·483 MJ/d). Body-weight change did not differ significantly from zero for the group as a whole (P= 0·16) or for males (P= 0·14) or females (P= 0·19) separately. The relationship between EI − EE and EB, estimated from the change in body weight, was examined. If the estimates of EI were biased, then the regression line would not go through zero EB at the zero rate of weight change per d. The intercepts of the regression lines differed significantly from zero for (1) all subjects ( − 0·019 kg/d, P= 0·039) and (2) subjects with a BMI >25 kg/m2 ( − 0·038 g/d, P= 0·023). However, when the regressions were analysed separately for subjects in positive and negative EB using segmented linear regression, the intercepts of the regression lines were not significantly different from zero for (1) all subjects, (2) male and females, and (3) subjects with a BMI ≤ 25 and >25 kg/m2 (see the Supplementary Appendix, available online).
Table 2 Average energy intake, energy expenditure, energy balance and rate of weight change over the 12 d period for men and women with BMI 20–25 or >25 kg/m2
* Measured using laboratory-weighed intakes.
† Measured using doubly labelled water.
‡ Energy intake minus energy expenditure.
Fig. 2 Bland–Altman plot of difference in energy intake (EI) and energy expenditure (EE) (mean daily energy intake using the laboratory-weighed intake method minus mean daily energy expenditure using the doubly labelled water method) against the mean of the two measures for the fifty-nine subjects who were included in the study.
There was thus a good agreement between EB, estimated from the change in body weight, and EI − EE (as determined by the linear regression).
On analysis of the video surveillance, it was found that 64 % of the food items consumed by a subject were seen by an investigator reviewing the tape. This accounted for 71 % of energy consumed during the 12 d period.
Effect of being observed on feeding behaviour, energy and macronutrient intake
Table 3 compares the overt and covert phases of the LWI for men, women and all subjects together for absolute energy and macronutrient intakes as well as the percentage of EI derived from each of the macronutrients. Comparison of the overt and covert phases of the LWI demonstrated the effect of self-recording food intake on actual feeding behaviour. This we have termed the ‘observation effect’. The overt phase (10·9 MJ/d) was significantly (P< 0·01) lower than the covert phase (11·6 MJ/d) for all subjects. The average difference between the two phases was 5 % overall (n 59), with females altering their feeding behaviour to a greater extent ( − 8 %) than males ( − 3 %). Women altered their protein ( − 8 % P< 0·001), fat ( − 12 % P< 0·01) and carbohydrate ( − 6 %, P< 0·05) intakes to a greater extent than men, while men had a significantly lower alcohol intake during the overt phase compared with the covert phase (P< 0·01). However, when the macronutrients were expressed as the percentage of EI, no significant differences between the phases were observed except for alcohol intake for men, which was slightly lower during the overt phase (P< 0·05).
Table 3 Effect of monitoring food intake on feeding behaviour (observation effect) (Mean values with their standard errors)*
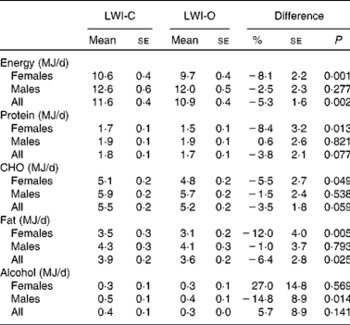
LWI, laboratory-weighed intakes; CHO, carbohydrates.
* Values are given as absolute energy intakes and absolute energy intakes from the macronutrients for the covert (C) and overt (O) phases of the study.
The main effects of being observed, therefore, are that EI dropped on average by 5 %. This was mainly due to decreases in protein, carbohydrate and, especially, fat intakes in women. Men were less pronounced in this regard with the exception of their alcohol intake.
Difference between what people eat and what they record eating, having taken account of changes in eating behaviour when being observed
We have defined the ‘reporting effect’ as the discrepancy between what people actually eat and what they say they eat, having taken account of the observation effect. Table 4 compares absolute energy and macronutrients for the self-reported methods of quantifying food intake in comparison with the overt phase of the LWI, giving the percentage difference between the methods. This constitutes an estimate of the reporting effect. The results are given as a difference in energy and macronutrient intakes by the self-reported methods, relative to the ‘gold standard’. This varied from − 5 % for the WDR to − 15 % for the FFQ2 in terms of absolute energy and macronutrients. Those dietary assessment methods that showed the largest percentage differences (DH and 24 h recalls) for energy intake also had significant percentage differences for macronutrient intake. Differences in macronutrient intake between the overt phase of the LWI and the other dietary assessment methods were not significant when expressed as the percentage of energy. Indeed, there was no evidence of any strong macronutrient specificity in the reporting effect.
Table 4 Percentage differences between the overt phase of laboratory-weighed intakes and other self-reported methods (reporting effect) (Percentage difference values with their standard errors)*
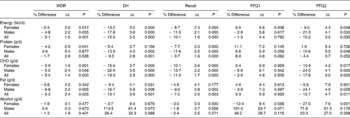
WDR, weighed dietary record; DH, diet history (7 d); CHO, carbohydrates.
* Results are presented for absolute energy and macronutrient intakes.
Combined influence of the observation and reporting effects on energy and macronutrient intakes
Table 5 compares the absolute energy and macronutrient intakes between each self-reported method of food intake reporting with the covert phase of the LWI. Table 6 gives the corresponding values for the percentage of EI from the macronutrients. The differences between the covert phase of the LWI and the self-reported methods equate to the sum of the observation and reporting effects that occurred during food intake measurements. This is the ‘total misreporting effect’. The self-reported methods of quantifying food intake significantly under-estimated EI compared with the covert phase of the LWI ( − 10 and − 21 % for the WDR and DH, respectively). The exception to this was FFQ1, where there was a 7 % (NS) difference between the two methods. Percentage differences were similar for the DH, recall and FFQ2 across men and women. There were also significant differences for most of the macronutrients, when expressed in absolute terms. When expressing macronutrients as a percentage of EI, significance levels were more variable for the differences between the ‘gold standard’ and the self-reported methods of assessing food intake.
Table 5 Percentage differences between the covert phase of laboratory-weighed intakes and other self-reported methods (overall misreporting) (Percentage difference values with their standard errors)*
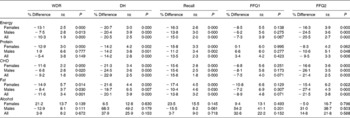
WDR, weighed dietary record; DH, diet history (7 d); CHO, carbohydrates.
* Differences are given as absolute values.
Table 6 Differences in the percentage of energy ingested from the macronutrients between the covert phase of laboratory-weighed intakes and other self-reported methods of measuring intake* (Percentage of energy difference values with their standard errors)
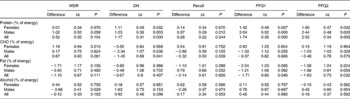
WDR, weighed dietary record; DH, diet history (7 d); CHO, carbohydrates.
* These differences represent both observation and misreporting effects (i.e. total misreporting).
Discussion
A major problem in cross-validation of dietary assessment techniques is that they are all self-reported and, by definition, subjective methods. Errors due to the reporting or observation effects would tend to co-vary giving the erroneous impression of cross-validation( Reference Livingstone and Black 6 , Reference Block 20 ). We therefore designed a Feeding Behaviour Suite and experimental protocol, which used EB methodology in combination with dietary assessment techniques, to concurrently measure actual intake and to validate that measurement. Once validated, the ‘gold standard’ could then be compared with common methods for assessing dietary intakes. The ‘gold standard’ measure of actual intake was validated using independent measures of the change in EB using the DLW technique and body-weight change( Reference Schoeller 13 , Reference Black, Prentice and Goldberg 14 ). There was good agreement between the independent assessments of the components of the EB equation (Table 2 and Fig. 2; see the Supplementary Appendix, available online), confirming the validity of the ‘gold standard’. These conclusions are further confirmed by the regression of EI − EE with change in body weight (two independent assessments of EB), which allowed us to conclude that the ‘gold standard’ was accurately measuring EI. Second, the fact that subjects were, on average, in EB over the 12 d period of the study removes any doubt that the laboratory environment influenced feeding or activity behaviour differentially to the extent that EB would be perturbed.
Identifying the nature and extent of the discrepancy between what people eat and what they eat when they are observed (observation effect)
Each subject was provided with food that was typical of their normal diet (based on an initial 7 d DH and shopping lists). Subjects' food was purchased on the basis of the 7 d DH and shopping lists. This was independently assessed using a FFQ, which asked subjects about their intake in the 2 to 3 months before the study. These limited insights are the only evidence to suggest that the subjects were actually eating a diet similar to that which they normally ate. The study was not designed to monitor ‘habitual’ intake but to ensure that subjects consumed familiar foods from their normal everyday diet.
Comparison of the LWI during the covert phases with that during the overt phases gave an estimate of the effect of overtly recording food intake on eating behaviour (observation effect). The mean EI was 5 % lower in the overt phase compared with the covert phase in which subjects were not asked to record their food intake. This was primarily due to the 8 % drop in EI in women. The 3 % drop in men was not significant. While women showed a marked drop in their fat intake of 12 % when reporting their food intake, men dropped their alcohol intake by 15 % compared with when they were not reporting their food intake. However, the absolute change in alcohol intake was relatively small, amounting to about 0·3 standard alcoholic drinks/d. Some subjects may be more sensitive about reporting foods high in these two nutrients( Reference Macdiarmid and Blundell 5 , Reference Rennie, Siervo and Jebb 37 ). These discrepancies are due to actual changes in behaviour as a consequence of subjects recording their own food intake or the effect of knowing their intake is being observed.
There was no evidence of a macronutrient-specific component to the reporting effect (i.e. the difference between actual intake during the overt phase and that measured using WDR, DH, recall or FFQ). When macronutrient intakes were expressed as their relative contribution to EI (percentage of energy), the differences between WDR, DH, recall, FFQ2 and the reference LWI (Table 6) appeared smaller than when differences in absolute values (g) were compared (Table 5) and fewer significant differences were found between the methods, at least for the main macronutrients. This effect has been noted previously by Kipnis et al. ( Reference Kipnis, Subar and Midthune 38 ) and is a consequence of the inevitable correlation between errors, or low energy reporting, in macronutrients and energy as the total EI is the sum of the energy from the individual macronutrients. There was little macronutrient-specific effect of observation, and therefore energy-adjusted macronutrient intakes were less affected than were absolute intakes. The use of energy-adjusted nutrient intakes has been suggested as a way of improving (albeit slightly) the performance of some dietary assessment tools when considering the associations between diet and health( Reference Kipnis, Subar and Midthune 38 ).
The present study raises the possibility that differences in macronutrient intake between low-energy reporters and non-low-energy reporters, found in diet surveys( Reference Livingstone and Black 6 , Reference Rennie, Coward and Jebb 9 , Reference Poslusna, Ruprich and de Vries 39 ), may be due more to changes in feeding behaviour when being observed (observation effect) than differences between what people actually eat and what they report eating (reporting effect). This is a concern because current diet survey methods are unable to detect changes in subjects' feeding behaviour relative to when they are not being monitored. When recording food intake, changes in diet can be assessed at the level of the individual using similar techniques to those used in the present study( Reference Goris and Westerterp 23 – Reference Goris, Meijer and Westerterp 25 , Reference Goris and Westerterp 40 ). However, under-eating relative to energy requirements may not be exactly the same as a change in behaviour under observation. Assessment of under-recording of EI using water balance makes the same assumptions as that of other biomarkers. As noted by Goris & Westerterp( Reference Goris and Westerterp 23 ), ‘A good recording of water intake does not necessarily imply that the same holds for the recording of food intake’. Nevertheless, Goris et al. showed the impact of weighing subjects at the beginning and end of a 7 d dietary measurement period on body weight in well-motivated lean women( Reference Goris and Westerterp 23 ) and in obese men( Reference Goris, Westerterp-Plantenga and Westerterp 24 ). When adult males (mean BMI 24 kg/m2, range 19–36 kg/m2) completed two 7 d weighed food records, negative changes in body weight suggested an observation effect of about 10 % of energy requirements, and changes in body weight were not related to BMI( Reference Milne, McNeill and Zakary 41 ). Insights into the likely size of the observation effect can also be gleaned from dietary intake measures over the course of 7 d provided body weight is recorded at the beginning and end of this period. In a 14 d dietary intervention study, subjects completed weighed food intake diaries during the second week. Body weight was recorded on days 1, 8 and 15, allowing changes in EB due to the observation effect alone to be assessed. It was clear that the subjects altered their intake during the recording week relative to the week before, and this effect was in the order of 3 MJ/d( Reference Whybrow, Mayer and Kirk 42 ). Simply measuring weight in this way can give an estimate of how EI may vary in relation to EB during the period of measurement. The implication for diet surveys is that to link self-reported intake to cheap, objective indices of EB; records of approximately 7 d should be used in well-structured populations. In addition, weight should be recorded immediately before and after the measurement period. This will allow some estimate of the observation effect to be assessed with reference to EB.
The reporting effect was identical in men and women and amounted to 5 % of EI for the WDR. Both the observation and reporting effects were greatest for the DH and FFQ2 compared with the other methods, although FFQ2 covered all four 3 d covert and overt phases combined and was not directly comparable to the other methods. Furthermore, FFQ are not usually used to measure EI but rather to rank nutrient intake adjusted for EI. For the WDR at least, the reporting effect was as high as the observation effect and both combined to produce an average misreporting effect of approximately 10 % under laboratory conditions.
The present study is unique in that it has established two separate but simultaneous features associated with misreporting; the observation effect and the reporting effect. Scatter plots of the observation and reporting effects and their combined difference to the LWI (shown in the Supplementary Appendix, available online) demonstrated that, in these fifty-nine subjects at least, both effects were continuously distributed and occurred in most subjects to some degree( Reference O'Reilly 43 ). Furthermore, current diet survey methods are unable to precisely or accurately measure either discrepancy, particularly for subjects with a higher EI:BMR ratio. Body weight can only identify observation effects that significantly alter EB, i.e. under-eating relative to energy requirements. A change in the composition of the diet with a similar EI would go undetected.
Evidence from the present study suggests that the observation effect is more pronounced in women than in men, and is more specific for fat intake in women. For men, alcohol intake changed the most. However, this was a relatively small study and the applicability of these findings needs to be assessed in future studies, as this is the first study to quantify these effects. The reporting effect ranged from − 5 % for the WDR to − 21 % for the DH and FFQ2. The reporting effect appears to be the most detectable component of misreporting. It is of concern that the most specific discrepancy with reference to nutrient intake is currently undetectable (observation effect). The results of this problem await the development of precise, accurate biomarkers of nutrient balance status. While this is theoretically possible in terms of ‘free-living indirect calorimetry’, we are still a long way off achieving a practical solution.
Supplementary material
To view supplementary material for this article, please visit http://dx.doi.org/10.1017/S0007114514000154
Acknowledgements
The present study was funded by the Food Standards Agency, UK. The Food Standards Agency had no role in the design, analysis or writing of this article.
The authors' responsibilities were as follows: R. J. S., L. M. O'R. and G. W. H. designed the research; L. M. O'R. and Z. F. conducted the research and analysed the data; G. W. H. performed the statistical analyses; P. R. carried out the DLW analysis; R. J. S. had primary responsibility for the final content; R. J. S., L. M. O'R., Z. F., S. W. and M. B. E. L. wrote the paper.
None of the authors had a potential conflict of interest.


