


INTRODUCTION
Influenza is a prevalent and potentially severe public health problem worldwide. The World Health Organization (WHO) estimates that each year seasonal influenza is responsible for 3–5 million cases of severe illness and 250 000–500 000 deaths globally [1]. The pandemic strain influenza A(H1N1)pdm09, which first emerged in 2009, was associated with an estimated 280 000 deaths worldwide in its first year of circulation [Reference Dawood2]. Teenagers and younger adults were disproportionately affected, with 62·2% of laboratory-confirmed cases in Australia aged between 10 and 44 years, compared to an average of 42·8% in the previous four influenza seasons [Reference Karageorgopoulos3].
Influenza infection is often demographically and spatially heterogeneous. For example, infants and young children are at greatly increased risk of hospitalization from influenza compared to other age groups [Reference Izurieta4]. Socioeconomic disadvantage has also been associated with increased influenza activity [Reference Balasegaram5]. Spatially varying infection rates could be explained by spatial variation in age distribution or disadvantage, as well as vaccine coverage or environmental factors [Reference Stark6].
Influenza surveillance systems, which enable systematic collection of influenza-related data through a variety of mechanisms, are a valuable tool for public health management and scientific research. Surveillance systems are used to detect influenza outbreaks, monitor circulating strains, inform disease control, assess the effectiveness of interventions and measure epidemic severity, onset and duration [Reference Grant7, 8]. Data collected often include spatial and demographic variables, permitting study of the effects of these factors on the spread of infection.
In general, surveillance systems capture biased and noisy subsets of the underlying influenza epidemic. Noise stems from low specificity in the method of case ascertainment, leading to false positives in the dataset. Laboratory testing for influenza infection typically yields high (although variable) specificity, while syndromic measures such as clinical diagnosis of influenza like illness (ILI) have low specificity for detecting true infection due to the non-specific nature of influenza symptoms [Reference Uphoff and Cohen9]. Accordingly, although ILI and laboratory-confirmed surveillance often record comparable trends [Reference Clothier10], ILI-based systems typically have higher noise levels.
Bias may occur according to a number of variables, measured or otherwise. For example, sentinel surveillance, which involves passive reporting of incident cases by volunteer medical practices, captures only cases in the catchment area of participating practices, leading to geographical bias [Reference Clothier11]. Relative to syndromic datasets, which typically consist of all individuals with ILI presenting to participating health practitioners, laboratory-confirmed surveillance data may incur greater bias due to variable testing practices, as health practitioners usually select patients for testing at their own discretion. For example, severe symptomatic cases (typically the very young and elderly) or those with poor background health status (often elderly) are more likely to be laboratory tested, potentially causing demographic bias.
Bias and noise may cause differences in the epidemic trajectories observed by different surveillance systems. Such discrepancies are commonly recorded (e.g. [Reference Clothier10–Reference Gaines13]) and may be seen as capturing different aspects of the true underlying epidemic. For example, if younger cases are over-represented in a given system and also typically present earlier in the epidemic than older cases, this will be reflected as an earlier epidemic peak compared to other systems. Factors endogenous to the surveillance system, such as reporting mechanism or case ascertainment method, may also result in biased or imprecise estimates of epidemiological quantities.
When multiple surveillance systems report on the same influenza epidemic, the data can be compared to investigate the contribution of observed variables such as age and spatial distribution to differences in the epidemic curves. This study used data from three surveillance schemes operating in Melbourne, Australia across four influenza seasons (2009–2012), including the year of emergence of pandemic influenza A(H1N1)pdm09. We aimed to:
-
(1) characterize key features of the distribution of influenza cases across space, time and demographic dimensions as recorded by the three surveillance systems;
-
(2) describe the differences in these distributions between the systems, and;
-
(3) investigate the extent to which recorded variables – year, spatial location, age, pandemic status (2009 vs. subsequent years) and the surveillance system itself – account for observed differences in the epidemic time series.
METHODS
Surveillance systems
We compared data from three surveillance schemes operating in metropolitan Melbourne: laboratory-confirmed influenza cases notified to the Victorian Department of Health (VDH), ILI cases reported through the Victorian General Practice Sentinel Surveillance (GPSS) scheme, and ILI cases presenting to the Melbourne Medical Deputising Service (MMDS). Key attributes of these systems are summarized in Table 1.
Table 1. Key attributes of three influenza surveillance systems in Melbourne, Australia

We restricted all datasets to those cases whose primary residence was in metropolitan Melbourne (defined as the Melbourne greater capital city statistical area [14]). We defined the influenza seasons as beginning on the first full ‘surveillance week’ (Monday–Sunday) of each year: 2009 (5 January 2009 to 3 January 2010), 2010 (4 January 2010 to 2 January 2011), 2011 (3 January 2011 to 1 January 2012) and 2012 (2 January 2012 to 6 January 2013).
Ethical approval for this study was granted by the Health Sciences Human Ethics Sub-Committee of the University of Melbourne.
VDH
In Victoria, all medical practitioners and pathology services are required by law to notify laboratory-confirmed influenza cases to the VDH within 5 days of a positive result. From 2010–2012, patients were selected for testing at the discretion of the health practitioner. In 2009, following the introduction of A(H1N1)pdm09 influenza to Victoria, the Victorian Government implemented a multi-phase pandemic response plan [Reference Lester and Moran15]. From 22 May to 2 June 2009, the Contain phase of this response was in place and laboratory testing of suspected cases was mandatory. Victoria transitioned to the Modified Sustain phase on 3 June and to the Protect phase on 23 June. During these phases, testing of suspected cases was no longer mandatory and instead focused on moderate, severe or at-risk cases [Reference Lester and Moran15, 16]. As a consequence of the pandemic response, the proportion of ILI cases tested was higher in 2009 compared to previous years, but evidence from the GPSS suggests this increase in testing was sustained in subsequent years [Reference Grant17].
We considered only those cases that were notified after presentation to a medical clinic or hospital. Cases that were identified through an institutional outbreak investigation, tracing of a known case's contacts or through the GPSS (these were considered only in the GPSS dataset) were excluded. We were unable to identify laboratory-confirmed cases originally presenting through the MMDS, leading to the potential for a small number of duplicate cases in the MMDS and VDH datasets.
GPSS
The GPSS scheme is coordinated through the Victorian Infectious Diseases Reference Laboratory (VIDRL), which recruits volunteer general practitioners (GPs) throughout Victoria. In total, 125 GPs from 57 practices (43 of them in Melbourne) participated in the scheme for various lengths of time within this period. Sentinel GPs reported ILI diagnoses to VIDRL in each reporting week during the GPSS operating period, typically April–October each year. Combined nose/throat swabs were taken from a subset of ILI patients at the GP's discretion and laboratory tested at VIDRL; however, the results of these tests were not considered in the present analyses.
MMDS
The MMDS provides medical care to patients in their own home or aged-care facility in Melbourne and its surrounds on weekends, public holidays and after-hours on weekdays [18]. In 2009–2012, influenza surveillance through the MMDS was coordinated by VIDRL. MMDS doctors recorded ILI diagnoses in a digital database on a daily basis; VIDRL searched this database and extracted the date and postcode for each ILI consultation.
Measures
To facilitate comparisons, we grouped the data by surveillance system, year, age group (0–4, 5–24, 25–49, ⩾50 years) and geographical region within Melbourne [Inner, North-East (NE), North-West (NW) and South-East (SE)]. We do not present sex-stratified analyses here as sex differences in the datasets were minimal. The influenza case counts were then aggregated by surveillance week (Monday–Sunday). Since this amounts to averaging the incidence rate across each week, we took the midpoint of each reporting week as the time corresponding to data from that week. This resulted in 3 × 4 × 4 × 4 = 192 individual weekly incidence rate time series or epidemic curves.
The Statistical Area Level 4 (SA4) (as defined by the Australian Statistical Geography Standard [14]) was our initial geographical unit. Due to small numbers of cases appearing in each SA4 in the GPSS and MMDS datasets, we further aggregated the SA4s into four larger regions within Melbourne (Inner, NE, NW, SE). These aggregations were chosen due to geographical proximity and to reflect similarities in socioeconomic advantage/disadvantage and health. Figure 1 maps the SA4 s and larger regions, and summarizes statistics on socioeconomic status and health.

Fig. 1 [colour online]. The Melbourne greater capital city statistical area divided into nine Statistical Area Level Fours (SA4) (map adapted from [14]). The SA4 code is shown inside each boundary. For each larger region, the boxes show: (1) approximate population size according to the 2011 Australian census [28]; (2) number of Victorian General Practice Sentinel Surveillance scheme (GPSS) practices located in that region; (3) Index of Relative Socioeconomic Advantage and Disadvantage (IRSAD) score, where a higher score indicates greater socioeconomic advantage and a lower score indicates disadvantage [29], and; (4) percentage of adults reporting good to excellent health on the Australian Bureau of Statistics Patient Experience Survey 2011–12, as a summary measure of regional health (data are available by Medicare Local catchment area; boundaries coincide with SA4 s only approximately) [30].
Analyses
To describe the overall epidemiology of the three datasets, we computed counts and percentages of influenza cases in each dataset, first by age group and then by geographical region, for each year in our study period. We tested for significant differences in these proportions using Pearson's χ 2 tests.
To quantify the contribution of surveillance system, year, age group and region to the shape of the epidemic curves, we performed multivariable nonlinear regression with the weekly disease incidence rate as the response. We had N = 8416 observations representing the average incidence rate (in units of cases per week) in each surveillance week for each year, surveillance system, age group and region. For the GPSS system, case counts outside of the GPSS operating period were treated as missing data.
We modelled the mean instantaneous incidence rate λ t at time t (measured in weeks) as the sum of a Gaussian function representing the epidemic component and a time-invariant constant representing the endemic component of the weekly incidence rate:
 $$\lambda _t = \displaystyle{S \over {\sqrt {2\pi} (D/3 \cdot 92)}} \ \exp \ \left[ {\displaystyle{{(t - T)^2} \over {2(D/3 \cdot 92)^2}}} \right] + C.$$
Here, S may be interpreted as representing the final size (disease count) of the epidemic component, T the timing of the week of peak incidence and C the constant baseline or endemic incidence rate. As D/3·92 is the standard deviation parameter and T is the mean of the Gaussian function in equation (1), about 95% of epidemic cases are expected to occur in the time interval T ± 0·5D, so that D approximates the duration of the seasonal epidemic.
We modelled log S, D, T and log C as linear in all variables, choosing the natural logarithms of S and C as these parameters are necessarily positive. We then fitted interaction terms between all variables and ‘pandemic year’ (2009). This decision was made a priori as we judged that the effects of surveillance system, age group and region were likely to be very different in a year in which a pandemic strain first appeared compared to subsequent years.
As we expected unmeasured sources of variation in the data to cause over-dispersion, we modelled the weekly counts of incident disease as independent negative binomials with mean λ t and over-dispersion parameter α. We allowed α to vary by surveillance system as we expected greater numbers of false positives in the ILI datasets to lead to greater variability in case counts compared to the laboratory-confirmed dataset.
We numerically maximized the likelihood for this model with respect to all regression coefficients and computed likelihood-based confidence intervals. All analyses were performed in Stata v. 13.0 (StataCorp, USA).
Sensitivity analysis
From 22 May to 2 June 2009, the Contain phase of the Victorian Government's pandemic response plan was in place and laboratory testing of suspected cases was mandatory. On 3 June, Victoria transitioned to the Modified Sustain phase and testing was restricted to moderate, severe or at-risk cases. This probably contributed to the sharp drop in the observed number of cases in the VDH dataset around this time [Reference Fielding19].
We therefore removed the two data points which covered the majority of the Contain phase (surveillance weeks beginning 25 May and 1 June) and re-fitted our multivariate model to check for any large changes in coefficient estimates.
RESULTS
Table 2 shows the number and proportion of cases detected by each surveillance system in each year in our study period, by age group and region. All differences in proportions (eight comparisons in total) were found to be significant (P < 0·001). Figure 2 shows a time series of weekly incidence for each system from 2009 to 2012.
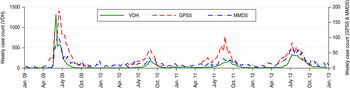
Fig. 2 [colour online]. Weekly counts of confirmed influenza cases notified to the Victorian Department of Health (VDH) and influenza-like illness cases reported through the Victorian General Practice Sentinel Surveillance scheme (GPSS) and Melbourne Medical Deputising Service (MMDS), from the week starting 5 January 2009 to the week starting 31 December 2012.
Table 2. Yearly counts (%) of VDH laboratory-confirmed influenza cases, and GPSS and MMDS influenza-like illness cases, first by age group, then by region*

VDH, Victorian Department of Health; GPSS, Victorian General Practice Sentinel Surveillance scheme; MMDS, Melbourne Medical Deputising Service.
* All differences (eight comparisons in total) were significant at the P < 0·001 level using Pearson's χ 2 tests.
Overall, the VDH system detected the largest number of cases (13 514, 63·5% of total) during the study period, followed by the GPSS (4189, 19·7%) and MMDS (3568, 16·8%) systems. This pattern was roughly consistent from 2009 to 2012, although VDH notifications were comparatively larger in 2009, probably due to increased testing practices as part of the pandemic response.
In 2010–2012, the spatial distribution of cases detected by the VDH surveillance system broadly reflected Melbourne's regional population distribution (~30% of the population lives in the Inner region with 23% in each of the remaining regions; see Fig. 1). Across these years the age distribution of cases was largely consistent, with the 25–49 years age group contributing the greatest number of cases. In 2009, the 5–24 years age group and the NW region predominated.
For the GPSS system, Melbourne's Inner region consistently reported the highest number of cases, reflecting the high proportion of GPSS practices located there (Fig. 1). For the MMDS system, the oldest age group (⩾50 years) and the NW region were typically over-represented compared to the other systems, and the SE region was strongly under-represented.
Effect of year, surveillance system, age group and region on epidemic characteristics
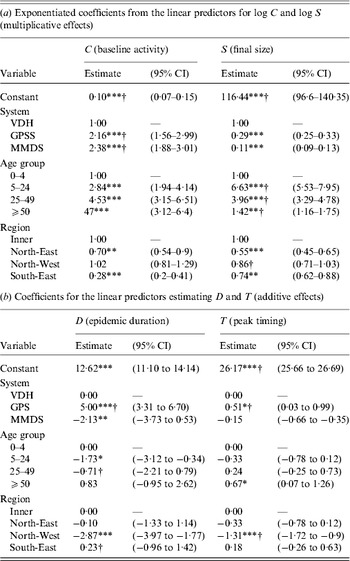
Table 3 (2010–2012) and Table 4 (2009) present fully adjusted estimates for the effects of year, surveillance system, age group and region on influenza constant baseline activity (parameter C), final size of the epidemic component (S), epidemic duration (D) and timing of peak incidence (T). Results for 2009 are shown separately as effects in this year were allowed to vary by fitting interaction terms. Confidence intervals (CIs) for epidemic timing are reported as date ranges rather than being constrained to discrete surveillance weeks, since all parameters were estimated on a continuous scale.
Table 3. Effects of year, surveillance system, age group and region on influenza epidemic characteristics in 2010–2012

CI, Confidence interval; VDH, Victorian Department of Health; GPSS, Victorian General Practice Sentinel Surveillance scheme; MMDS, Melbourne Medical Deputising Service.
C represents the constant rate of baseline influenza activity; S represents the final size of the epidemic component; D represents the approximate duration of the epidemic component; T represents the timing of the epidemic peak in weeks from 8 January each year, since Thursday 8 January 2009 is halfway through the earliest surveillance week included in this study.
* P < 0·05, ** P < 0·01, *** P < 0·001.
Table 4. Effects of surveillance system, age group and region on influenza epidemic characteristics in 2009 (first emergence of the H1N1 pandemic influenza virus)
CI, Confidence interval; VDH, Victorian Department of Health; GPSS, Victorian General Practice Sentinel Surveillance scheme; MMDS, Melbourne Medical Deputising Service.
C represents the constant rate of baseline influenza activity; S represents the final size of the epidemic component; D represents the approximate duration of the epidemic component; T represents the timing of the epidemic peak in weeks from 8 January each year, since Thursday 8 January 2009 is halfway through the earliest surveillance week included in this study.
* P < 0·05, ** P < 0·01, *** P < 0·001.
† Significantly different from 2010 estimate (P < 0·05).
We estimated the over-dispersion parameter α to be 0·25 (95% CI 0·22–0·29) for the VDH system, 0·36 (95% CI 0·30–0·43) for the GPSS and 0·52 (95% CI 0·43–0·61) for the MMDS, suggesting significantly greater over-dispersion in the ILI-based systems compared to the laboratory-confirmed system. Plots of the fitted curves and data are available in the online Supplementary material.
2010–2012
For the 2010–2012 data, we estimated significant effects of year, surveillance scheme, age group and region on baseline activity and final epidemic size (Table 3 a). This was expected as these parameters are dependent upon true variations in the size of the underlying population by age and region, the catchment population of each surveillance system, and the overall epidemic attack rate in each year.
The duration of the influenza epidemic was estimated to be significantly longer in both 2011 and 2012 compared to 2010, by 4·1 (95% CI 2·4–5·7) and 6·5 (95% CI 5·0–7·9) weeks, respectively (Table 3 b). Epidemic duration was estimated to be significantly longer in the 25–49 and ⩾50 years age groups compared to the 0–4 years age group, by 3·9 (95% CI 1·6–5·0) and 3·0 (95% CI 0·9–5·0) weeks, respectively. The duration was estimated to be significantly shorter in the NW region and longer in the SE region compared to the Inner region, with differences of −3·3 (95% CI −4·8 to −1·7) and 4·0 (95% CI 2·0–6·0) weeks, respectively. We found no significant effect of surveillance system on epidemic duration in 2010–2012.
In 2010, and for baseline values of age group (0–4 years) and region (Inner), the peak of the seasonal epidemic was estimated to occur between 12 and 20 September 2010 with 95% confidence (Table 3 b). The 2012 peak was estimated to occur 4·3 (95% CI 3·9–4·7) weeks earlier in the year than the 2010 peak, or between 12 and 19 August 2012.
The incidence of cases reported through the GPSS was estimated to peak 2·1 (95% CI 1·6–2·5) weeks earlier than the VDH scheme. The incidence of cases in the ⩾50 years age group was estimated to peak 1·2 (95% CI 0·7–1·8) weeks later than in the 0–4 years age group. Notifications in the NW region were estimated to peak 0·6 (95% CI 0·1–1·0) weeks later than the Inner region.
2009
Here we report on effects that were significantly different in 2009 from those already reported for 2010–2012 (i.e. effects arising from significant interactions with pandemic year).
We estimated that in 2009, baseline influenza activity was greater for the GPSS (a 2·2-fold increase, 95% CI 1·6–3·0) and MMDS (2·4-fold increase, 95% CI 1·9–3·0) compared to the VDH surveillance system. These effects were significantly different from those estimated for years 2010–2012, where baseline activity was the same for the VDH and GPSS and slightly lower for the MMDS.
We found significant effects of age group on final epidemic size in 2009, with the 5–24 and 25–49 years age groups estimated to account for 6·6 (95% CI 5·5–8·0) and 4·0 (95% CI 3·3–4·8) times more cases than the 0–4 years age group, respectively, a greater relative amount than in subsequent years. The ⩾50 years group was estimated to account for 1·4 (95% CI 1·2–1·8) times more cases than the youngest group, a smaller relative effect than in subsequent years.
The GPSS exhibited a greater epidemic duration, by 5·0 weeks (95% CI 3·3–6·7), compared to the VDH system, and the MMDS exhibited a shorter duration, by 2·1 weeks (95% CI 0·5–3·7). No significant differences were observed in subsequent years. The significantly longer epidemic duration observed in the SE region compared to the Inner region in 2010–2012 was not observed in 2009.
For the baseline levels of age group (0–4 years) and region (Inner), the peak incidence of influenza in 2009 was estimated to occur 9·5 (95% CI 8·9–10·2) weeks earlier in the year than the 2010 epidemic (between 7 and 15 July 2009 with 95% confidence). The influenza epidemic was estimated to peak 1·3 (95% CI 0·9–1·7) weeks earlier in the NW region than the inner region in 2009, whereas in subsequent years the NW peak incidence occurred significantly later (although this effect was marginal). GPSS notifications were estimated to peak 0·5 (95% CI 0·0–1·0) weeks later than VDH notifications in 2009. This also entailed a significant interaction; in subsequent years, GPSS incidence peaked earlier than VDH incidence.
Sensitivity analysis
In a sensitivity analysis, we excluded data points from the VDH dataset corresponding to the surveillance weeks from 25 May to 8 June 2009, covering the majority of the Contain phase of the pandemic response. We observed a moderate decrease in our estimate for the effect of the VDH system on final epidemic size. This was expected since the excluded data points represented a period of heightened influenza testing in Victoria. We also observed a 35% decrease in our estimate of the over-dispersion parameter α for the VDH data, suggesting lower variability in the data. A likely explanation is that the excluded data points exhibited large deviations from the mean which were unexplained by variables in the model. Most other significant parameter estimates did not change by >20% and this sensitivity analysis did not change our qualitative interpretation of the results.
DISCUSSION
We have used a nonlinear regression approach to estimate the contribution of four factors – year, surveillance system, age group and region – to the final epidemic size, epidemic duration, timing of peak incidence and constant baseline activity observed by three influenza surveillance schemes. This has allowed us to investigate the extent to which differences in the epidemic curves recorded by the three schemes can be explained by observed demographic, spatial and seasonal variables, and what differences are due to unobserved variables or factors endogenous to each surveillance system.
We found that after adjusting for age, region and year, the surveillance system from which the data were derived still had an effect on the shape of the epidemic curve. This suggests that unmeasured factors related to each surveillance system have caused differences in the patterns of influenza recorded.
Significant effects of surveillance system on final epidemic size and baseline activity were found. These differences were largely expected as the catchment populations of each surveillance system differ markedly.
More notably, in 2009 compared to 2010–2012, we observed a greater relative amount of baseline activity in the GPSS and MMDS systems compared to the VDH system. We further estimated that constant baseline activity, which includes out-of-season activity, was 4–6 times higher in 2010, 2011 and 2012 compared to 2009. This suggests that the baseline incidence of laboratory-confirmed cases increased substantially after 2009 while ILI rates did not increase proportionately. This is consistent with previous observations in Victoria and throughout Australia which have been attributed in part to an increase in testing rates following the 2009 pandemic [Reference Kelly20].
We observed significant effects of surveillance system on the timing of the epidemic peak. The ILI-based systems (GPSS and MMDS) each peaked 1–2 weeks earlier than the system based on confirmed influenza notifications (VDH), demonstrating that measurement of epidemic timing may differ significantly according to the surveillance strategy used. This effect cannot be explained by reporting delays in the VDH system, as in this study notifications to the VDH were dated according to the day the case presented to a clinician, the same time reference used by the GPSS and MMDS systems.
By contrast, in 2009 notifications through the GPSS system were estimated to peak significantly later than the VDH, by about half a week. This may have been caused by the extended GPSS surveillance period, changes in the reporting behaviour of GPs, or changes in laboratory testing recommendations during the season. Overall, in 2009 influenza incidence peaked much earlier in the year than in subsequent seasons [Reference Fielding19], and this was reflected in our results.
We observed no significant effect of surveillance system on epidemic duration, except in 2009 when the epidemic duration observed through the GPSS was estimated to be 5 weeks longer than that of the VDH and 7 weeks longer than that of the MMDS. This aligns well with previous estimates of season length in 2009 for the GPSS and MMDS, as defined using seasonal thresholds proposed by the WHO [21]. Using this method, the 2009 influenza season was estimated to last from 10 May to 5 September (17 weeks) for the GPSS data, and from 31 May to 15 August (11 weeks) for the MMDS [Reference Tay22]. We estimated a season's duration of between 13 May and 14 September (17·6 weeks) for the GPSS and between 2 June and 16 August (10·5 weeks) for the MMDS (at baseline levels of region and age group). Estimates of season duration in subsequent seasons were less well-matched, with our analysis typically yielding longer seasons than the WHO method [Reference Tay22, Reference Sullivan, Tay and Kelly23].
This study has described in detail the differences between three surveillance systems reporting on the same seasonal epidemics across multiple geographical regions and age groups. When multiple surveillance systems overlap, meta-analysis can yield deeper insights into the underlying influenza epidemic. For example, Bayesian evidence synthesis of multiple data sources can be used to estimate important epidemiological quantities with improved accuracy and precision (e.g. [Reference Presanis24, Reference Presanis25]). Our results suggest that systematic differences exist between the three systems examined; future data synthesis studies could be improved by accounting for such differences.
Variations in influenza spread across the regions and age groups included in our study demonstrate that influenza epidemics can be spatially and demographically heterogeneous, even within a relatively small and inter-connected region such as a city. Data synthesis could enhance studies of this heterogeneity, since surveillance systems are subject to spatial and demographic bias that could distort analyses based on individual datasets. In particular, this could enable more effective examination of hypotheses related to spatial facilitators of infection spread, such as area-level socioeconomic disadvantage.
Limitations
This study had several limitations. First, we chose a nonlinear model that imperfectly described the true mean behaviour of the systems being studied. Model misspecification can lead to biased parameter estimates and false conclusions. We chose a simple model that could be parameterized by quantities of epidemiological interest and assumed that the effects of the variables being studied on these parameters were additive unless we had strong reason a priori to fit interaction terms (as in the case of the 2009 pandemic). Further interactions may have been present; we did not test for these. Added complexity would have reduced the interpretability of the parameters and increased the risk of over-fitting.
Second, some cases detected by the VDH, GPSS or MMDS schemes were missing records of one or more variables, leading to missing data in our study. However, this missingness was unlikely to be systematic since data loss in routine surveillance systems could have a wide variety of causes. As such this would be unlikely to bias our results. The GPSS scheme also operates for a limited period during the influenza season; extrapolation of results from our study to times outside the GPSS operating period (typically April–October) should be treated with caution.
Third, we were unable to identify laboratory-confirmed cases in the VDH dataset who had originally presented through the MMDS, leading to the potential for duplicate cases in the VDH and MMDS datasets. However, the fraction of VDH cases attributable to the MMDS is likely to be small. The number of MMDS cases included in our analysis was 74% less than the number of VDH cases; assuming conservatively that on average 50% of MMDS cases were laboratory tested and 50% of these were positive, then only 7% of the VDH dataset would overlap with the MMDS. Consequently, we would not expect this overlap to be a source of significant error in our analysis.
Fourth, for the purposes of this study we treated the GPSS as an ILI-only surveillance system. A subset of ILI cases detected by the GPSS are also swabbed and laboratory-tested; future studies would be enhanced by considering differences between the epidemic curves of the test-positive and test-negative cases. This would allow further investigation of hypotheses regarding differences between ILI-based and laboratory-confirmed surveillance data.
Finally, appropriate population denominators for this study were not available, meaning that it was necessary to use disease counts rather than rates. Raw counts for different systems, regions, age groups and years are not directly comparable due to variations in underlying population size; future studies would benefit from investigating incidence rates when possible. For example, for the GPSS data, using total number of laboratory tests conducted as the denominator for number of positive tests could lead to further insights [Reference Lambert26]. For the MMDS system, total numbers of call-outs by MMDS doctors could serve as a population denominator [Reference Turner and Kelly27].
CONCLUSIONS
This study has described key differences in the patterns of influenza spread observed by three surveillance systems (VDH, GPSS, MMDS) in Melbourne, Australia from 2009 to 2012. We found that these differences were not entirely explained by variation in the spatial and age distributions of cases across the three systems. This suggests that factors related to the surveillance mechanisms, or other unmeasured variables, are contributing to systematic differences in the observed epidemic curves. Future research, particularly data synthesis or meta-analysis studies, would be improved by accounting for these differences where possible.
SUPPLEMENTARY MATERIAL
For supplementary material accompanying this paper visit http://dx.doi.org/10.1017/S0950268814000764.
ACKNOWLEDGEMENTS
We gratefully acknowledge the contribution of the patients, general practitioners, practice staff and laboratory staff involved in the Victorian General Practice Sentinel Surveillance Scheme and the Melbourne Medical Deputising Service, and who have contributed to the Victorian Department of Health (VDH) database. We thank VDH for granting access to the confirmed influenza notifications data, in particular Lucinda Franklin for providing advice on and facilitating access to these data.
Jodie McVernon was supported by an Australian Government National Health and Medical Research Council Career Development Award (566 635). James McCaw is supported by an Australian Research Council Future Fellowship (FT1101002) and the Defence Science Institute.
DECLARATION OF INTEREST
None.


