


Osteoporosis and obesity are two disorders that share several features including genetic predisposition and common progenitor cells( Reference Rosen and Bouxsein 1 ). While genetic factors contribute to an individual's risk of developing osteoporosis and subsequent fragility fractures, modifiable factors such as nutrition can also influence bone health either positively or negatively( Reference Rosen, Beamer and Donahue 2 ). The connection between fuel utilisation and skeletal remodelling begins in the bone marrow with lineage allocation of mesenchymal stem cells to adipocytes or osteoblasts( Reference Kawai, Devlin and Rosen 3 ). Mature bone cells secrete factors that influence insulin sensitivity, and fat cells synthesise cytokines that regulate osteoblast differentiation; thus, these two pathways are closely linked. Any effects beneficial to bone are mainly based on well-established positive correlations between body weight or mechanical loading conferred by body weight and bone mineral density found in animals and humans( Reference Cao, Gregoire and Gao 4 ). There are studies that suggest positive correlations between fat mass and bone. A study by Ma et al. ( Reference Ma, Turpeinen and Silvennoinen 5 ) has shown that in mice the femur bone adapts to obesity and exhibits improved bone strength even at the micro-structural level. Adaptation is also seen in response to running exercise, with increased trabecular density and improved three-dimensional structure( Reference Ma, Turpeinen and Silvennoinen 5 ). However, accumulating data also suggest that excessive fat mass is detrimental to bone( Reference Cao 6 , Reference Sheu and Cauley 7 ). In a study by Hsu et al. ( Reference Hsu, Venners and Terwedow 8 ) in a large cohort of a Chinese population, with a certain body weight there was a negative relationship between fat mass and bone mass. Risk of osteoporosis, osteopenia and non-spine fractures were significantly higher in subjects with higher percentage body fat, independent of body weight. The negative genetic correlation denoted by ρG between fat mass and weight-adjusted bone mass suggests that fat and bone mass share some common genetic factors and molecular pathways that appear to have opposite effects on fat v. bone mass( Reference Zhao, Liu and Liu 9 ).
In growing animal models, a high-fat diet (HFD) could deleteriously affect bone mineral content, structure and mechanical properties( Reference Xiao, Cui and Li 10 ). Consistent with our data, a recent study on young male mice suggests that HFD-induced obesity in growing animals may affect the total available osteoblastic cell differentiation progenitors in the bone with increasing adipogenesis. This may result in negative consequences for the bone later on in adult life( Reference Lu, Zhao and Wang 11 ). These discrepancies could be explained by the different animal characteristics (sex, age and breed), the duration and the quality of the diet used. However, finally, it was the diet that could influence the results or the outcome by its ability to either induce obesity or not( Reference Gerbaix, Metz and Mac-Way 12 ).
Various intervention studies on murine bone structure have been carried out in ageing models that indicate that cortical thickness decreases and that the cross-sectional moment of inertia increases with increasing age. In addition, total femoral volumetric bone mineral density increases until 4 months of age and is maintained thereafter( Reference Willinghamm, Brodt and Lee 13 ). Studies on diet-induced obesity mouse models indicate that a HFD decreases cancellous bone mass but has no effect on cortical bone mass in tibia in mice( Reference Cao, Gregoire and Gao 4 ). One interesting study has also investigated the possible role of HFD-induced bone loss through comparing femoral gene expression profiles in HFD-fed mice v. normal diet-fed mice during the growth stage and have shown that genes associated with bone resorption are increased and bone formation is decreased in mice fed a HFD( Reference Xiao, Cui and Li 14 ). Our earlier studies have shown that there are differences in peak bone mass (PBM) acquisition in young female and male adults. Difference in bone mineral density in males and females could be attributed to an increase in bone size in males during growth. However, how PBM is influenced in the presence of a HFD in both males and females remains uninvestigated.
In the present study we evaluated the bone architecture of the femur and proximal and mid-shaft tibia by microcomputed tomography in mice fed a HFD for 10 weeks to determine whether a HFD influences bone structure in males and females differentially. Further, to determine the effect of a HFD on the functions of osteoblasts, we cultured bone marrow stromal/osteoblastic cells (BMSC) for up to 21 d. The areas of positive colony-forming units at day 14 and Ca nodules at day 21 were measured in addition to the expression of adipogenic, osteogenic and osteoclastogenic genes.
Materials and methods
Animals and diets
All animal care and experimental procedures were approved by the Institutional Animal Ethics Committee (IAEC) following the guidelines of the Committee for the Purpose of Control and Supervision of Experiments on Animals and conform to the international norms of the Indian National Science Academy. Male and female C57BL/6 mice (n 24; aged 4 weeks), obtained from the National Laboratory Animal Centre at the Council of Scientific and Industrial Research – Central Drug Research Institute, Lucknow, India, were used and received humane care in compliance with the Guidelines for the Care and Use of Laboratory Animals, and were randomly assigned to four groups of eight mice each. Animals were kept in a 12 h light–12 h dark cycle, with controlled temperature (22–24°C) and humidity (50–60 %) and were given ad libitum access to water and food. The control group of female and male mice was fed with a standard chow diet and the second group was fed with a HFD (D12492, 60 % energy from fat; Research Diets, Inc.) (see online supplementary Tables S1 and S2) that was given by weight in grams for 10 weeks, respectively. Body weight was recorded weekly.
Biochemical analysis
At the end of 10 weeks of study, mice were euthanised and autopsied. Blood was collected in tubes containing EDTA and plasma was immediately separated by centrifugation and frozen at − 80°C. Total cholesterol, TAG, HDL and LDL were determined by colorimetric assay in a semi-automatic biochemistry analyser( Reference Gautam, Kushwaha and Swarnkar 15 ). On the basis of our previously published protocols, plasma osteocalcin (OCN) (midportion) and carboxy-terminal collagen crosslinks (CTx) levels were determined with ELISA kits (Immunodiagnostic Systems Ltd) following the manufacturer's protocols( Reference Trivedi, Kumar and Gupta 16 , Reference Khedgikar, Gautam and Kushwaha 17 ).
Mineralisation of bone marrow cells
At the end of 10 weeks, bone marrow cells were isolated from mice and cultured according to a previously published protocol( Reference Trivedi, Kumar and Gupta 16 , Reference Malaval, Modrowski and Gupta 18 ). Briefly, the femora were excised aseptically, cleaned of soft tissues, and washed three times, 15 min each, in a culture medium. The epiphyses of femora were cut off and the marrow was flushed out in 20 ml of minimum essential medium (α-MEM). Released bone marrow cells were collected and plated (2 × 10⁶ cells/well) in twelve-well plates in the culture medium, consisting of α-MEM, supplemented with 10 % fetal bovine serum, 100 nm-dexamethasone, 10 mm-β-glycerophosphate and 50 μg/ml ascorbic acid. Cells were cultured for 21 d at 37°C in a humidified atmosphere of 5 % CO2 and 95 % air, and the medium was changed every 48 h. At day 14 of culture, cells were washed twice with PBS, then plates were fixed by keeping them at − 70°C for 1 h, and then brought to room temperature to determine alkaline phosphatase (ALP) activity. The rate of the reaction here is directly proportional to the enzyme activity, which itself is proportional to osteoblast differentiation. Optical density was measured at 405 nm with a microplate reader( Reference Trivedi, Kumar and Kumar 19 ). After 21 d, the differentiated cells were fixed in 4 % formaldehyde for 20 min at room temperature and rinsed once in PBS. After fixation, the specimens were processed for staining with 40 mm-Alizarin Red-S, which stains areas rich in nascent Ca. The stain was extracted and quantified by the ELISA plate reader at 405 nm( Reference Trivedi, Kumar and Gupta 16 , Reference Trivedi, Kumar and Kumar 19 – Reference Khedgikar, Kushwaha and Gautam 21 ).
Induction of adipogenic differentiation in bone marrow cells
For adipogenic differentiation, 1 × 10⁷ bone marrow cells from all groups were seeded in twenty-four-well plates and cultured in an adipogenic medium (Dulbecco's modified Eagle's medium) containing 1·0 μm-dexamethasone, 0·5 mm-isobutylmethylxanthine, 100 μm-indomethacin, 10 % FBS and insulin (10 μg/ml), for 7 d. On day 3, medium was replaced with complete growth medium containing only insulin (10 μg/ml). Medium was replaced every third day and continued for 21 d. Cells were fixed after 21 d in 4 % paraformaldehyde and stained with Oil Red O. To quantify the incorporation of lipid, the area stained with Oil Red O was measured by taking photomicrographs( Reference Gautam, Kushwaha and Swarnkar 15 , Reference Trivedi, Kumar and Kumar 19 , Reference Heim, Johnson and Boess 22 , Reference Santiago-Mora, Casado-Diaz and De Castro 23 ). For the extraction of the Oil Red O stain, 500 μl of 70 % propanol were added to the stained cells and left at 37°C for 20 min. The extracted stain was quantified by the ELISA plate reader at 490 nm( Reference Trivedi, Kumar and Kumar 19 , Reference Heim, Johnson and Boess 22 ).
Glucose tolerance test
At the end of 10 weeks of treatment with the HFD, mice were fasted overnight and blood glucose was measured from the tail vein at 0 (before intraperitoneal injection), 15, 30, 60, 90 and 120 min (after intraperitoneal injection) (injection of 50 % d-glucose (dextrose) at 3 ml/kg body weight). Blood glucose measurements were done using an Optimum Exceed glucometer (Abbott Diabetes Care Inc.). AUC for glucose tolerance was compared among different groups( Reference Wang, Suzuki and Lee 24 ).
Real-time PCR for quantification of the messenger RNA levels of various bone-specific genes
From frozen left femora, total RNA was extracted with TRIzol (Invitrogen) according to the manufacturer's instructions. The concentration and purity of RNA were determined by measuring the absorbance at 260 nm (A260) and the ratio of the absorbance at 260 nm to the absorbance at 280 nm (A260/A280), respectively. Primers were designed using the Universal Probe Library (Roche Applied Sciences) for genes, as presented in Table 1. Complementary DNA was synthesised with the Revert Aid cDNA Synthesis Kit (Fermentas) using 2·0 μg of total RNA. SYBR Green chemistry was used to perform a quantitative determination of the relative expression of transcripts for all genes. Relative mRNA expression of all the genes were analysed using the Light Cycler 480 (Roche Molecular Biochemicals) real-time PCR machine, as we have reported previously. Table 1 shows the primer sequences of various murine genes used for quantitative PCR. The reaction volume was 20 μl/well on ninety-six-well plates. Transcript levels were normalised to glyceraldehyde-3-phosphate dehydrogenase levels. The relative messenger RNA (mRNA) expression levels were calculated according to the comparative cycle threshold (CT) (ΔΔCT) method, as described by the manufacturer (LightCycler® 480 Instrument, Software Version 1.5, February 2008; http://www.roche-applied-science.com). Target quantity is normalised to endogenous control and relative to a calibrator and is calculated using the formula: target amount 2-ΔΔCT(16,21,25).
Table 1 Quantitative PCR primers
OCN, osteocalcin; F, forward; R, reverse; Col-1, collagen type-1; RUNX-2, runt-related transcription factor 2; aP-2, adipocyte protein 2; FABP4, fatty acid binding protein 4; OPG, osteoprotegerin; RANKL, receptor activator of NF-κB ligand; TRAP, tartrate-resistant acid phosphatase; RANK, receptor activator of NF-κB; GAPDH, glyceraldehyde-3-phosphate dehydrogenase.
Microcomputed tomography
Microcomputed tomography of excised bones was carried out using the SkyScan 1076 micro-computed tomography (μCT) scanner (Bruker microCT) as described before( Reference Khedgikar, Kushwaha and Gautam 21 , Reference Kumar, Gupta and Khedgikar 26 ). The bone samples were scanned at a resolution of 9 mm. Reconstruction was carried out using SkyScan Nrecon software (Bruker microCT). The X-ray source was set at 50 kV and 200 mA, with a pixel size of 9 mm. A total of 100 projections were acquired over an angular range of 180°. The trabecular bone was selected by drawing ellipsoid contours with the computed tomography analyser (CTAn) software (SkyScan; Bruker microCT). Trabecular bone volume/tissue volume (BV/TV), trabecular number (Tb.N) and trabecular separation (Tb.Sp) of the distal femoral metaphysis (covering secondary spongiosa and the secondary ossification centre) and proximal tibial metaphysis were calculated by the mean intercept length method. Three-dimensional parameters were based on analysis of a Marching cubes-type model with a rendered surface. CTVol software (Skyscan) was used to create a three-dimensional model of the bones( Reference Gupta, Kumar and Khedgikar 20 , Reference Khedgikar, Kushwaha and Gautam 21 ). Lengths of femora were measured. After that femora were subjected to the three-point bending test with the bone strength tester model TK 252C (Muromachi Kikai Co. Ltd)( Reference Trivedi, Kumar and Kumar 19 ).
Statistical analysis
Values were expressed as mean values with their standard errors. Comparisons of each parameter among all of the groups were analysed via one-way ANOVA followed by Neuman–Keuls post hoc tests using Prism version 3.0 software (GraphPad). Probability values of P< 0·05 were considered to be statistically significant. In addition, two-way ANOVA was used to determine the effects of diet and sex in all groups, using Prism version 3.0 software.
Results
Differential susceptibility to obesity between male and female mice
The HFD was used to induce the metabolic syndrome and the stage of disorder was defined by taking body weight at each point for the four groups as shown in Fig. 1. Starting from 4 weeks of age, the body weight of animals fed the HFD was significantly greater than that of mice fed the control diet (P< 0·05). From this time on, the difference between all the groups increased consistently. At the end of the 10-week study on experimental diets, female mice on the HFD weighed about 27 % heavier than female mice on control chow diet (18·5 (se 0·2) and 20·8 (se 0·9) g for the control and HFD female mice, respectively), while male mice on the HFD weighed about 15·8 % heavier than male mice on the chow diet (22·5 (se 0·6) and 24. 9 (se 0·8) g for control and HFD male mice, respectively). However, data suggest that the susceptibility to weight gain as percentage weight gain was higher in male mice compared with female mice. Comparison of data within the control diets (chow) at the end of 10-week study shows that male mice showed a 28 % increase in body weight while female mice showed a 9·1 % increase. The results of two-way ANOVA indicated that both diet (P= 0·029) and sex (P< 0·0001) individually affected body weight, but no interaction was found between these effects.

Fig. 1 High-fat diet (HFD) feeding induces differential susceptibility to obesity in male and female mice. Feeding the HFD for 10 weeks to C57BL/6 mice increased body weights in both males and females but the weight gain in male mice showed more increase as compared with the females. Values are means for eight mice per group, with standard errors represented by vertical bars. * Mean values were significantly different compared with the HFD group (P< 0·05). Two-way ANOVA was performed to assess the effects of diet (P= 0·029), sex (P< 0·0001) and of their interaction (diet × sex; NS) on body weights. ![]() , Chow-fed females;
, Chow-fed females; ![]() , HFD-fed females;
, HFD-fed females; ![]() , chow-fed males;
, chow-fed males; ![]() , HFD-fed males.
, HFD-fed males.
Effect of high-fat diet on lipid profile and development of hyperinsulinaemia in males
Table 2 shows changes in serum lipid parameters for the four groups. Circulating levels of total cholesterol were increased in both female and male HFD-fed mice; however, male mice on the HFD had about 20–25 % higher serum cholesterol concentrations compared with female mice fed the HFD. HDL, considered to be the good cholesterol, is actually a carrier molecule that transports cholesterol in the blood. Levels were significantly less (about 60 %) in male HFD mice compared with those fed the chow diet; however, 10 weeks of HFD treatment did not affect the females. LDL is a carrier molecule that transports cholesterol and TAG in the blood from the liver to the body's cells and a high level of LDL is associated with a high risk of heart attack as it indicates artery-clogging cholesterol in the blood. Data show that LDL levels were significantly (P< 0·05) higher in male HFD-fed mice compared with female HFD-fed mice. TAG are the principal fat in the diet and the serum levels of these indicate how much fat is moving through the body, potentially to clog the arteries. Data show that TAG levels were high (about 70 %) in male HFD-fed animals as compared with the chow diet-fed male mice. Comparison of data with the female group shows that male mice had the susceptibility towards higher TAG levels (P< 0·01). However, TAG levels of female chow v. HFD animals remain unchanged. The results of two-way ANOVA indicated that diet was the main factor to increase total cholesterol (P= 0·0002), TAG (P= 0·0092) and LDL (P= 0·0036) levels. However, for HDL sex seemed to be a greater contributor in decreasing the HDL levels (P= 0·0011). Assessment of plasma glucose concentrations in males and females shows that glucose levels increased in HFD female mice over time compared with mice on the control chow diet. However, glucose levels in HFD male mice remained constant v. the control chow diet animals. After 10 weeks of HFD treatment, glucose tolerance was impaired in female mice as compared with age-matched male mice (Fig. 2).
Table 2 Plasma biochemical parameters (Mean values for eight mice per group with their standard errors)
HFD, high-fat diet; TC, total cholesterol; CTx, carboxy-terminal collagen crosslinks; OCN, osteocalcin.
Mean value was significantly different from that of the male chow-fed group: * P< 0·05, ** P< 0·01, *** P< 0·001.
Mean value was significantly different from that of the female chow-fed group: † P< 0·05, †† P< 0·01, ††† P< 0·001.
‡‡ Mean value was significantly different from that of the male HFD-fed group (P< 0·01).
§ Values of two-way ANOVA are P values for the main effects for the four groups of diet, and sex, and interaction between diet and sex.

Fig. 2 Effect of oral glucose tolerance test in female and male chow-fed and high-fat diet (HFD)-fed mice. Values are means for eight mice per group, with standard errors represented by vertical bars. * Mean value was significantly different from that of the female chow-fed group (P< 0·05). Two-way ANOVA was performed to assess the effects of diet (NS), sex (NS) and of their interaction (diet × sex; NS) on glucose tolerance.
Effect of high-fat diet on trabecular bone architecture as shown by microcomputed tomography
Having checked the status of the lipid profile after 10 weeks of HFD treatment, we next studied the effect of the HFD on bone. Tables 3 and 4 show gross observations of the trabecular architecture by three-dimensional microcomputed tomography of the distal femur and tibia in both male and female groups. Deterioration in the trabecular structures is clearly visible in HFD groups (Fig. 3(a)). Data show that 10 weeks of HFD treatment to both males and females resulted in significant decreases in BV/TV and Tb.N, when compared with the chow group (control group). Comparison of data between male and female groups shows that loss of percentage bone was the same in both the sexes. However, Tb.Sp increased in both the males and females but a greater increase was observed in males on the HFD than female mice fed the HFD. Likewise, the structural model index (SMI) was used to assess plate-like trabeculae. A higher SMI as attained by 10 weeks of HFD treatment indicates deterioration of trabeculae from a plate- to a rod-like structure that was significantly more in the male group as compared with the females. As trabecular micro-architecture is an independent determinant of fractures we therefore also assessed micro-architecture at the cortical sites. The HFD with 60 % energy as fat for 10 weeks did not produce any change in cortical thickness in either the male or female animals (Table 3, Fig. 3(b)), when compared with their chow-fed counterparts; this was corroborated by no changes in the energy to failure and maximum stiffness in males fed the HFD and no change in the energy to failure in females fed with the HFD (Table 5). To assess whether the HFD affects the growth of animals, as these were young growing animals, we measured femoral length at the end of the experiment. We observed no change in the growth (length) of the femur as compared with the control chow diet-fed animals, both males and females (Table 3). The results of two-way ANOVA indicated that in the case of femoral metaphysis, diet had a significant effect on BV/TV (P< 0·0001), Tb.Sp (P= 0·0024), Tb.N (P< 0·0001) and SMI (P< 0·0001); however, in the case of Tb.N (P= 0·0175) and SMI (P< 0·0001), sex was also a factor that affected the results. There was no significant interaction between diet and sex on either of the variables. Similarly, in the tibial metaphysis region diet had a significant effect (P< 0·0001) on BV/TV, Tb.Sp, Tb.N and SMI. A significant interaction between diet and sex affected Tb.Sp in tibia (P= 0·0078), where males exhibited greater Tb.Sp as compared with the females.
Table 3 Micro-architectural parameters of femoral metaphyseal region (Mean values for eight mice per group with their standard errors)
HFD, high-fat diet; BV/TV, bone volume/tissue volume; Tb.Sp, trabecular separation; Tb.N, trabecular number; SMI, structure model index; Cs.Th, cortical thickness.
Mean value was significantly different from that of the male chow-fed group: * P< 0·05, ** P< 0·01, *** P< 0·001.
Mean value was significantly different from that of the female chow-fed group: † P< 0·05, †† P< 0·01, ††† P< 0·001.
Mean value was significantly different from that of the male HFD-fed group: ‡ P < 0·05, ‡‡ P< 0·01, ‡‡‡ P< 0·001.
§ Values of two-way ANOVA are P values for the main effects for the four groups of diet, and sex, and interaction between diet and sex.
Table 4 Micro-architectural parameters of tibial metaphyseal region (Mean values for eight mice per group with their standard errors)
HFD, high-fat diet; BV/TV, bone volume/tissue volume; Tb.Sp, trabecular separation; Tb.N, trabecular number; SMI, structure model index.
Mean value was significantly different from that of the male chow-fed group: * P< 0·05, ** P< 0·01, *** P< 0·001.
Mean value was significantly different from that of the female chow-fed group: † P< 0·05, †† P< 0·01, ††† P< 0·001.
‡ Mean value was significantly different from that of the male HFD-fed group (P< 0·05).
§ Values of two-way ANOVA are P values for the main effects for the four groups of diet, and sex, and interaction between diet and sex.
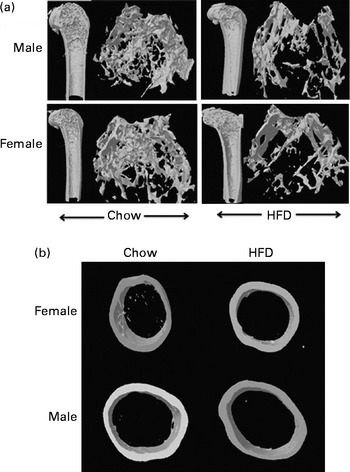
Fig. 3 High-fat diet (HFD) feeding induced differential effects in trabecular bone micro-architecture of femoral and tibial metaphysis regions by microcomputed tomography. (a) Representative microcomputed tomography images (longitudinal and transverse cross-sectional three-dimensional view) of the distal femoral metaphysis of male and female chow- and HFD-fed mice by microcomputed tomography. (b) Representative microcomputed tomography images of the cross-sectional three-dimensional view of the femoral diaphyseal region of female and male chow- and HFD-fed mice. HFD treatment did not induce changes in cortical thickness.
Table 5 Biomechanical strength of femora (Mean values for eight mice per group with their standard errors)
HFD, high-fat diet.
* Mean value was significantly different from that of the male chow-fed group (P< 0·05).
† Mean value was significantly different from that of the female chow-fed group (P< 0·05).
‡ Mean value was significantly different from that of the male HFD-fed group (P< 0·05).
§ Values of two-way ANOVA are P values for the main effects for the four groups of diet, and sex, and interaction between diet and sex.
Effects of high-fat diet on bone turnover markers in males and females
The established bone formation marker, plasma OCN, and a resorption marker (CTx) were studied to corroborate our findings on bone deterioration as observed by us. Plasma CTx levels were higher in the HFD-treated mice compared with the control chow groups. Data suggest that the HFD impairs bone loss via increased osteoclastic bone resorption. Although we found higher levels of plasma CTx in both HFD-fed male and female mice (P< 0·05), collagen loss was significantly more in the male group (P< 0·01) as compared with the females (Table 2). Results of two-way ANOVA indicated that both diet (P= 0·0029) and sex (P< 0·0001) had significant effects on CTx levels, with higher bone resorption in males as compared with females.
OCN levels that are indicative of bone formation as compared with resorption were assayed in the plasma and data suggest that whereas females could not compensate for the bone loss, the male group had modestly increased OCN levels (Table 2). Similarly, two-way ANOVA results showed that sex contributed to significant changes in OCN levels (P= 0·0013), with higher OCN levels in males.
Effect of high-fat diet on modulation of progenitor cells in the bone marrow
To determine the effect of dietary fat on bone marrow stromal cells, BMSC from long bone were isolated and cultured at the end of the 10-week HFD treatment. BMSC were differentiated into osteoblasts and adipocytes, as both cell types differentiate from mesenchymal cells and share a reciprocal relationship with each other. Fig. 4(a) shows that BMSC following from HFD treatment had significantly reduced ALP (osteoblast proliferation) activity in both males and females (about 50–60 %) in response to osteogenic stimulus as compared with chow-fed (control) animals. Comparison of data between males and females shows that there was no significant difference in the decrease in ALP, as both the groups showed an equal response towards the decrease. Two-way ANOVA results corroborated the above findings suggesting the effect of both diet (P< 0·0001) and sex (P= 0·0008) on ALP activity.

Fig. 4 Modulation of osteoprogenitor cells in the bone marrow by high-fat diet (HFD) feeding. For the alkaline phosphatase (ALP) assay, 1 × 10⁵ cells were plated in forty-eight-well plates; for the mineralisation assay 2 × 10⁶ bone marrow cells (BMC)/well were plated onto twelve-well plates. (a) ALP activity. (b) Calcium deposition by osteoblasts was determined by Alizarin Red-S staining of the cultures at the end of the experiment for all four groups. Representative photomicrographs show mineralisation nodules for the four groups stained with Alizarin-S dye. (c) For quantification Alizarin-S dye was extracted and mineralisation quantified. (d) To assess the differentiation of BMC to adipocytes, 1 × 10⁷ BMC/well were differentiated into adipocytes of four groups. Cultures were maintained for 21 d. At the end of the experiment, cells were stained with Oil Red O. Photomicrographs show that HFD feeding inhibits the differentiation of BMC to adipocytes. (e) Quantification of lipid droplet accumulation in the cells by extraction of the dye. Values are means (n 3 times), with standard errors represented by vertical bars. Mean value was significantly different from that of the male chow-fed group: ** P< 0·01, *** P< 0·001. Mean value was significantly different from that of the female chow-fed group: † P< 0·05, †† P< 0·01, ††† P< 0·001. ‡‡‡ Mean value was significantly different from that of the male HFD-fed group (P< 0·001). Two-way ANOVA was performed to assess the effects of diet, sex and of their interaction (diet × sex) on ALP activity (P< 0·0001, P= 0·0008 and NS, respectively), the Alizarin assay (P= 0·0002, P= 0·0003 and NS, respectively) and the Oil red-O assay (P< 0·0001, P< 0·0001 and NS, respectively). OD, optical density.
Further we analysed the mineralising ability of the BMSC that started to form mineralising nodules at day 14 of culture and maximal Ca nodules were observed at day 21 of culture. At day 21 of culture, the number of Alizarin Red-stained Ca nodules (Fig. 4(b)) was decreased about 30 % (P< 0·05) in mice fed the HFD compared with control chow diet-fed mice. Extraction and quantification of the dye showed that HFD treatment in males as compared with females rendered significantly less (P< 0·01) mineralisation (Fig. 4(c)), suggesting the effect of both diet (P= 0·0002) and sex (P= 0·0003) on the mineralisation of bone marrow cells.
Differentiation of BMSC into adipocytes as in Fig. 4(d) shows that BMSC obtained from HFD-fed mice (both male and female) favoured the progression towards adipogenic lineage and showed more accumulation of lipid droplets. Fig. 4(d) shows adipocytes stained with Oil Red O from the four groups. After 21 d of differentiation, absorbance data of extracted Oil Red O from the cells showed that there was increased adipogenesis in male and female HFD-fed mice compared with chow-fed mice; however, we found increased adipogenesis in male HFD-fed mice compared with female HFD-fed mice (P< 0·001) (Fig. 4(e)) as confirmed by two-way ANOVA (P< 0·0001 for diet and P< 0·0001 for sex).
Direct effect of high-fat diet at messenger RNA level on femur long bone
We next assessed the status of osteoblasts, osteoclasts and adipocytes by quantifying mRNA levels of various genes after HFD treatment. Table 6 shows the mRNA levels of adipogenic, osteogenic and osteoclast specific genes. For osteoblasts we assessed runt-related transcription factor 2 (RUNX-2), type I collagen (Col-1) and OCN. Two-way ANOVA analysis suggests that diet was the main factor to affect Col-1 (P= 0·0022) and OCN (P= 0·0002) levels. Real-time PCR shows that mRNA levels remained unchanged in the females fed the HFD for RUNX-2 and Col-1 but were significantly reduced for OCN levels. In males the reduction in osteoblastic gene expression was more pronounced when compared with the female group fed the HFD for 10 weeks. Since osteoblasts and adipocytes derive from the same mesenchymal stem cells, our data for adipogenic genes show that adipocytic transcription factors were significantly more (PPARγ 2-fold and adipocyte protein-2 (aP-2) 6-fold) as compared with not only the control chow diet-fed animals but also with the females fed the HFD. Two-way ANOVA analysis confirms that diet and sex individually affected the levels of PPARγ and aP-2 (P< 0·0001), with a significant interaction also between diet and sex (P= 0·0014 for PPARγ and P< 0·0001 for aP-2). Data in osteoclasts for the resorptive genes robustly increased tartrate-resistant acid phosphatase (TRAP) about 3-fold and receptor activator of NF-κB (RANK) about 20-fold in the males on the HFD for 10 weeks whereas this expression remained unchanged in the female counterparts when compared with their controls. Two-way ANOVA for diet and sex shows P= 0·0013 for TRAP and P< 0·0001 for RANK expression. However, interaction between diet and sex was also found to affect mRNA levels of TRAP (P= 0·0013) and RANK (P< 0·0001). During bone remodelling, osteoblasts produce important paracrine signals that promote osteoclastogenesis. Osteoprotegerin (OPG) and receptor activator of NF-κB ligand (RANKL) produced by osteoblasts regulate osteoclastogenesis and osteoclast function. We next studied whether or not the HFD modulates osteoblast function such that osteoclastogenesis is inhibited. When data were expressed as the ratio of OPG:RANKL (measure of induction of osteoclastogenesis), HFD treatment, specifically in males, led to a 30–40 % decrease in the ratio. Altogether, the data suggest that HFD treatment for 10 weeks may lead to more deterioration in the bones of males as compared with females.
Table 6 Messenger RNA levels in long bones (Mean values for eight mice per group with their standard errors)
HFD, high-fat diet; Col-1, collagen type-1; RUNX-2, runt-related transcription factor 2; OCN, osteocalcin; aP-2, adipocyte protein-2; TRAP, tartrate-resistant acid phosphatase; RANK, receptor activator of NF-κB; OPG/RANKL, osteoprotegerin/receptor activator of NF-κB ligand.
Mean value was significantly different from that of the male chow-fed group: * P< 0·05, ** P< 0·01, *** P< 0·001.
Mean value was significantly different from that of the female chow-fed group: † P< 0·05, †† P< 0·01, ††† P< 0·001.
§ Values of two-way ANOVA are P values for the main effects for the four groups of diet, and sex, and interaction between diet and sex.
Discussion
In the present study we assessed the effects of association between HFD-induced osteoporosis in C57BL/6 male and female mice. Obesity was induced by the HFD with 60 % energy as fat in C57BL/6 mice, as this strain is more likely to develop metabolic alterations that closely delineate the human metabolic syndrome such as dyslipidaemia, inflammation and obesity. Adiposity influences bone remodelling through secretion of several adipokines that directly target bone. These adipokines influence the central nervous system, thereby changing sympathetic impulses to bone and paracrine signals that influence adjacent skeletal cells( Reference Karsenty and Oury 27 , Reference Kawai, de Paula and Rosen 28 ). Evidence from epidemiological and animal-feeding trials suggests that low vitamin D and/or Ca alone or along with a Western-style diet that is high in fat, low in Ca, vitamin D and folic acid may result in low bone mass and poor bone quality( Reference Ward, Kim and Bruce 29 , Reference Creedon and Cashman 30 ). Further, studies with high-fat high-sucrose diets or a diet low in folic acid led to abnormalities in bone( Reference Cavadini, Siega-Riz and Popkin 31 – Reference Wohl, Loehrke and Watkins 33 ).
The present study with a HFD illustrates differential effects of HFD feeding in males and females. The HFD for 10 weeks increased body weight with deterioration of bone in young male mice as compared with females, but impairment in response to glucose challenge was found in females v. the males. The notion that obesity may not be beneficial to skeletal health is echoed frequently in paediatric literature and studies have shown that children and young adults with distal forearm fractures were more likely to have a higher degree of adiposity( Reference Goulding, Jones and Taylor 34 ). Further, sex differences have been suggested in humans in the prevalence of metabolic diseases, with males being more prone to the disease as compared with females( Reference Vlassoff 35 ). Studies in human subjects show that there is differential accumulation of fat, fat mobilisation, utilisation as a fuel and finally the presence of excess and insufficient fat stores in both males and females. Many of these differences have evolved because of the differences in the much higher reproductive cost due to lactation and gestation in females as compared with males. Other studies have shown that NEFA release in men is higher because of higher subcutaneous fat deposits than women, making them resistant to anti-lipolytic effects of meal ingestion; therefore, regional differences in the regulation of fatty acid metabolism between men and women( Reference Power and Schulkin 36 , Reference Blaak 37 ) cannot be ignored. Studies also show that visceral fat depots with an inflammatory element secrete cytokines, including resistin, TNF-α, IL-1 and IL-6, which uncouple bone remodelling by enhancing bone resorption( Reference Karsenty and Oury 27 , Reference Kawai, de Paula and Rosen 28 ). In osteoporosis too, these differences stand out prominently. Testosterone in contrast with oestrogen is not uniformly associated with fracture risk in men( Reference Sinnesael, Claessens and Boonen 38 ). Androgen receptor-mediated action is important for trabecular bone maintenance in male mice whereas both oestrogens and androgens regulate cortical bone growth( Reference Moverare, Venken and Eriksson 39 ). Further, bone mass that is an established determinant of bone strength is achieved at the end of the growth period, commonly designated as PBM. PBM plays an important role in the risk of osteoporotic fractures occurring in adulthood which significantly differs in males and females( Reference Bonjour, Chevalley and Ferrari 40 ). It is considered that a decrease of PBM by 1 sd may increase the fracture risk by 50 %( Reference Bonjour, Chevalley and Ferrari 40 ).
We specifically investigated changes in both bone quality and content in the presence of a HFD in both males and females. Although larger bone size is expected, especially with higher body mass, mechanical performance of the bone was degraded by the effects of obesity with no change in bone size (length). Multiple comparisons between groups showed that diet was a major contributor to lipid changes observed in both sexes but its effects on bone were differential. Male animals on the HFD lost more trabecular bone as compared with the females. This was evident with higher urinary CTx (breakdown products of collagen type 1 cross-linked C-telopeptide) levels in males v. females. We observed impaired glucose tolerance in female mice with unaltered plasma OCN levels while their male counterparts fed with the HFD remained protected towards glucose intolerance with modestly increased plasma OCN levels. Karsenty's group has shown that serum levels of uncarboxylated OCN regulate bone resorption mediated by insulin signalling in osteoblasts( Reference Lee, Sowa and Hinoi 41 ). Lower serum uncarboxylated OCN levels were observed in patients with osteoporosis taking medication that inhibits bone resorption, than in controls( Reference Lee, Sowa and Hinoi 41 , Reference Ferron, Wei and Yoshizawa 42 ). However, treatment for the duration of 10 weeks could be one of the limitations of the present study, as it led to no change in mechanical properties of the cortical bone compartment. However, maintenance of cortical bone because of the action of both the gonadal hormones (testosterone and oestrogen) as protection to the bone specifically in males at the cortical site cannot be ruled out.
Our data on bone marrow progenitor cells show preferential differentiation of these cells and genes more towards an adipogenic lineage as compared with osteogenic. In fact, haematopoietic cells experienced more osteoclastogenic response in the presence of the HFD. Studies show that more (number) marrow adipocytes as seen by us in HFD treatment exert a lipotoxic effect on osteoblast function and survival through the reversible biosynthesis of fatty acids into the bone marrow micro-environment( Reference Elbaz, Wu and Rivas 43 ). Our data corroborate these findings, with a higher BMSC response towards adipogenesis. Thus, it is possible that it is the lipotoxic effect induced by adipocytes on osteoblast survival that may have contributed to cancellous bone loss in males as compared with females.
Overall, our data suggest that HFD feeding leads to a greater loss of bone and prevents preservation of the trabecular micro-architecture in males that may further increase fracture risk beyond bone mineral density.
Supplementary material
To view supplementary material for this article, please visit http://dx.doi.org/10.1017/S0007114514000051
Acknowledgements
The authors thank Swasti Tiwari for critical reading of the manuscript.
We gratefully acknowledge the University Grant Commission (UGC), Council of Scientific and Industrial Research (CSIR), Indian Council of Medical Research (ICMR), New Delhi, India for the award of research fellowships (to J. G., V. K., P. K., D. C. and R. S. S.). Financial support from ‘BSC0103 (New approaches towards understanding disease dynamics and accelerate drug discovery)’ is acknowledged. BSC0103 had no role in the design, analysis or writing of this article.
J. G. and D. C. contributed to the planning and execution of the animal experimental groups. J. G. conducted the biochemical analysis and gene expression studies. R. S. S. and D. C. carried out the oral glucose tolerance test experiment. V. K. and P. K. along with J. G. contributed to the cell culture and microcomputed tomography analyses. R. T. and D. S. contributed to the preparation of the manuscript. R. T. and S. T. provided the concept and resources for the experiments, and were involved in the planning, execution and troubleshooting of the experiments.
There are no conflicts of interest.


