


- DED
-
dietary energy density
- %E
-
% energy
- IOTF
-
International Obesity Task Force
- MDI
-
mean daily intakes
- NCFS
-
National Children's Food Survey
- TV
-
television
Background
Childhood obesity has been defined by the WHO as a disorder of excess body fatness that is associated with an increased risk of disease( 1 ). For both adults and children, the measurement of BMI (weight/height2) is widely accepted as a measure of body fatness (where weight acts as a surrogate for body fat). Children can be classified into categories of body weight (normal, overweight or obese) by comparing their BMI with a reference population that describes the distribution of BMI of that population by age and sex. A child's BMI changes substantially with age and differs between sexes; therefore it is not appropriate to use fixed thresholds as category cut-offs, as is done for adults (25 and 30 kg/m2). Instead, various international and national BMI reference datasets and cut-offs have been developed for this purpose( Reference Cole, Bellizzi and Flegal 2 – 5 ). It is important to acknowledge that many of these and other published cut-offs are based on statistical convenience rather than a known health risk. In addition, studies have shown disparity in classification when different BMI reference datasets and cut-offs are applied to the same population group( Reference Johnson, Wright and Cameron 6 – Reference Lang, Kipping and Jago 8 ). However, despite some discussion regarding the appropriateness of different reference datasets and cut-offs, it is widely agreed that childhood obesity is on the rise globally( 9 ).
The origin of obesity is multi-factorial and a variety of genetic, cultural, environmental, lifestyle and economic factors have been implicated in its development( Reference Lobstein, Baur and Uauy 10 , Reference Dehghan, Akhtar-Danesh and Merchant 11 ). No single nutrient or food has been unequivocally associated with the development of obesity although the strongest evidence for an increased risk of obesity relates to diets that are high in dietary fat or low in fibre( Reference Jebb 12 , Reference Ambrosini, Emmett and Northstone 13 ). In terms of dietary patterns, the higher consumption of high-energy dense foods, sugar-rich beverages and large food portion sizes has each been shown to increase the likelihood of overconsumption of energy.( Reference Jebb 12 ).
This review will report on levels of overweight and obesity in Irish children and examine the diet and lifestyle patterns in this group in relation to some of the factors that are proposed to promote or protect against an increase in body fatness in children.
Description of the surveys
The present paper reports the findings from three nationally representative dietary surveys carried out in Ireland by the Irish Universities Nutrition Alliance. The National Pre-School Nutrition Survey 2011–2012, The National Children's Food Survey (NCFS) 2003–2004 and the National Teens’ Food Survey 2005–2006 were carried out to establish databases of habitual food and drink consumption in representative samples of Irish children aged 1–4, 5–12 and 13–17 years, respectively. Each of the surveys was designed to be representative of the population in the Republic of Ireland with respect to age, gender, residential location and socio-economic status. For both the NCFS and the National Teens’ Food Survey, children were recruited through the school setting and both groups of children were found to be representative according to the census( 14 , 15 ) as per design. For the National Pre-School Nutrition Survey, pre-school children were recruited from a database of names and addresses of children compiled by ‘eumom’ (an Irish parenting resource; www.eumom.ie) or from randomly selected childcare facilities in selected locations. While this facilitated a representative sample with regard to age, gender and residential location, our sample of 1–4-year olds contained a higher proportion of children of professional workers and a lower proportion of children of skilled manual workers than the general population( 14 ).
Weighed food records (National Pre-School Nutrition Survey, 4 d; NCFS, 7 d) were used to collect food intake data from 500 pre-school children (1–4 years) and 594 older children (5–12 years). A 7 d semi-weighed food record was used to collect food intake data from 441 teenagers (13–17 years). A significant focus for all the surveys was the researcher/participant interaction (up to four visits) allowing for additional clarification of data where necessary. Food intake data were converted to nutrient intakes using UK and Irish food composition data( 16 , Reference Black, Ireland and Møller 17 ). No adjustments were made to dietary intake data for possible under-reporting. For all three surveys, anthropometric measurements including weight (in duplicate) and height were taken for each child in their own home. More detailed information on the methodology of all three surveys is available at www.iuna.net.
Defining overweight and obesity
BMI (kg/m2) was calculated for each child in each of the three surveys. For each survey group, children were classified into body weight categories (normal, overweight or obese) using two different approaches based on separate BMI reference populations and cut-off points. One-year-old children were excluded from BMI analyses as it is deemed inaccurate to apply these cut-points to children aged less than 2 years. In addition, self-reported measurements were excluded.
The first approach involved using the UK–WHO age and sex-specific BMI charts as the reference sample( 18 ). These charts combine data from the UK 1990 growth reference for children at birth and from 4 to 18 years( Reference Cole, Freeman and Preece 3 ) with the WHO growth standard for children aged 2–4 years, which describe the optimal growth for healthy, breastfed children( 5 ). The centile cut-offs used for these charts were as follows: overweight being a BMI >91st and ≤98th percentile and obesity equalling a BMI >98th percentile.
The second approach involved using the International Obesity Task Force (IOTF) age- and sex-specific BMI cut-offs for children aged 2–18 years. These cut-offs are based on pooled international data for BMI and are linked to the widely used adult overweight and obesity cut-off points of 25 and 30 kg/m2( Reference Cole, Bellizzi and Flegal 2 ).
BMI
Mean BMI for girls and boys by age are plotted in Fig. 1. For younger children (up to age 8 years), BMI remained relatively constant with age and values were similar for both boys and girls. From age 8 years, BMI increased steadily with age and was higher in girls than in boys. Data from the UK National Diet and Nutrition Survey (collected 2007) showed that the mean BMI of 4–17-year-old children in the UK was similar to that of Irish children for both boys and girls and for each age-group examined( Reference Gregory, Lowe and Bates 19 ).

Fig. 1. (colour online) Mean BMI (kg/m2) of Irish children (1–17 years) by sex and age( Reference Walton 20 – 22 ).
Prevalence of overweight and obesity
The proportion of children defined as normal, overweight and obese is shown in Table 1 using the reference populations and thresholds as described earlier. Overall, for 2–4-year olds, 18 % were classified as overweight (including obese) using the IOTF cut-offs and 23 % were classified as overweight (including obese) using the WHO growth charts( Reference Walton 20 ). As discussed, the WHO growth charts only include data describing the growth patterns of breastfed children, who are typically of lighter weight than those fed infant milk formula. For 5–12-year olds, 22 % were classified as overweight (including obese) using IOTF cut-offs and 24 % were classified as overweight (including obese) using the UK 1990 growth charts( Reference O'Neill, McCarthy and Burke 21 ). For 13–17-year olds, 18 % of children were classified as overweight (including obese) using both approaches( 22 ). When examined by sex/age-group, the prevalence of overweight and obesity differed depending on which approach was used, with the use of growth charts typically classifying more children as obese (as opposed to overweight) compared with the IOTF cut-offs. This is consistent with the findings from other countries( Reference Lang, Kipping and Jago 8 , Reference Monasta, Lobstein and Cole 23 , Reference Shields and Tremblay 24 ) and it has been recommended that until there is clear evidence to support adopting one method over the other, both IOTF and one or more country-specific criteria should be reported in country-level surveillance and research( Reference Lang, Kipping and Jago 8 ). As part of The Growing Up in Ireland Study (a longitudinal development study of children in Ireland)( 25 , 26 ), weights and heights were measured for 8500 9-year olds in 2007–2008 and almost 10 000 3-year olds in 2011. Using the IOTF cut-offs, 25 % of 3-year olds and 26 % of 9-year olds were classified as overweight (including obese), which is consistent with our own findings for children of these ages.
Table 1. The proportion of Irish children defined as normal, overweight or obese using the International Obesity Task Force cut-offs and UK–WHO centile charts( Reference Walton 20 – 22 )

IOTF, International Obesity Task Force; IOTF cut-offs, age- and sex-specific BMI cut-offs( Reference Cole, Bellizzi and Flegal 2 ).
UK–WHO charts (including UK 1990 reference charts( Reference Cole, Freeman and Preece 3 ) and WHO growth standards( 5 )).
Underweight analysed but not presented.
Comparison with previous studies in Ireland
The Irish National Nutrition Survey carried out in 1988–1989 also collected data on weight and height for Irish children( Reference Lee and Cunningham 27 ). These data are available for children from 8 years of age and were compared with children of the same age-group (8–12 years) from the NCFS( Reference O'Neill, McCarthy and Burke 21 ). Significant increases in weight and BMI were noted for both boys and girls, whereas no change in height was observed in either sex. Mean weight, height and BMI from these two surveys along with equivalent data for 8–12-year olds from the preceding National Nutrition Survey (1948) were plotted as a percentage increase since 1948 illustrating a much more dramatic increase in body weight than height or BMI over this 57-year period (Fig. 2)( Reference O'Neill, McCarthy and Burke 21 ).

Fig. 2. (colour online) Percentage change in mean weight (Wt), height (HT) and BMI relative to 1948 for Irish children aged 8–12 years (reproduced with permission from O'Neil et al.( Reference O'Neill, McCarthy and Burke 21 )).
Dietary energy density
There is a growing body of evidence to support a relationship between dietary energy density (DED) and body weight in adults, children and adolescents( Reference Perez-Escamilla, Obbagy and Altman 28 ). To better understand this relationship, it is important to identify the foods and nutrients that determine DED in free-living populations. Defined as the amount of energy intake in the diet per gram of food consumed, DED (kJ/g) has been examined in Irish children( Reference Walton, Gleeson and Lyons 29 , Reference O'Connor, Walton and Flynn 30 ). For each child, DED was calculated using ‘food only, excluding all beverages’. This method is preferred as the inclusion of beverages in the calculation method has been known to disproportionally influence DED values( Reference Johnson, Wilks and Lindroos 31 ). In our studies, DED was shown to increase as children got older. DED values for 1-year olds were estimated at 6·4 kJ/g increasing to 8·3/8·4 kJ/g for older children (5–12 years) and teenagers (Fig. 3). For each of the survey groups, the children were split into three categories (low, medium and high) based on their individual DED. Energy intakes (MJ) were statistically similar across categories for 5–12-year olds (low: 6·9; medium: 6·9; high: 7·2) and for 13–17-year olds (low: 8·1; medium: 8·4; high: 8·5).( Reference O'Connor, Walton and Flynn 30 ). For 1–4-year olds, however, a higher DED was associated with higher intakes of energy (MJ; low: 4·5; medium: 4·8; high: 5·0)( Reference Walton, Gleeson and Lyons 29 ). For each of the survey groups, a higher DED was characterised by a higher proportion of energy from fat, a lower proportion of energy from protein and a less fibre-dense diet than a lower DED. For the young children (1–4 years) and teenagers (but not 5–12-year olds), a higher DED was also characterised by a lower proportion of energy from carbohydrate (Fig. 4).

Fig. 3. (colour online) Dietary energy density (kJ/g) in Irish children (age 1–17 years) by age-group( Reference Walton, Gleeson and Lyons 29 , Reference O'Connor, Walton and Flynn 30 ).
Energy-adjusted intakes of foods by category of DED are reported for those foods, which were associated with DED in both 5–12- and 13–17-year olds( Reference O'Connor, Walton and Flynn 30 ) (Table 2). Children and teenagers with a high DED compared with those with a low DED consumed less fruit, vegetables, fruit and vegetable juices, wholemeal bread, ‘grains, rice, pasta and pizza’, yoghurt, potatoes (mashed/boiled/baked), ‘soups and sauces’ and ‘fresh meat and meat dishes’ and more sugar-sweetened carbonated beverages, chocolate confectionery and savoury snacks. Some preliminary analysis for pre-school children has shown some similar trends with those with a high DED compared with those with low DED consuming less fruit, vegetables, milk, yoghurt and ready to eat breakfast cereals and more white bread, ‘biscuits and cakes’, ‘confectionery and savoury snacks’ and carbonated beverages( Reference Walton, Gleeson and Lyons 29 ).
Table 2. Mean daily food group intakes (g/10 MJ) by tertile of dietary energy density (DED) in Irish children and teenagers (Adapted from O'Connor et al.( Reference O'Connor, Walton and Flynn 30 ))

Superscripts abc denote significant differences between groups. Arrows denote direction of association with increasing DED.
* As determined by ANOVA, unless otherwise specified. **As determined by a Kruskal–Wallis test.
Dietary fat
Despite the likelihood that total dietary fat intake and specific dietary lipids play a role in the development of childhood obesity, there are insufficient data available to suggest quantitative recommendations in relation to obesity prevention( 32 ). The European Food Safety Authority has recently proposed reference intake ranges for daily total dietary fat of 20–40 % energy (%E) for those in the 2nd and 3rd year of life and 20–35 %E for those aged 3 years and over( 33 ). However, it is important to note that these are largely based on adult data and account for practical considerations such as the current levels of intake and achievable dietary patterns( 33 ). Additionally, the European Food Safety Authority suggest that while diets with moderate fat intake (<35 %E) may provide some advantages over diets with a higher fat intake (>35 %E) for medium-term weight reduction and long-term prevention of weight gain, fat intakes >35 %E may be compatible with good health and normal body weight depending on other dietary patterns and the level of physical activity( 33 ). Nonetheless, foods containing high amounts of fat are likely to be energy dense and there is convincing evidence for the association of energy density with energy intake( Reference Rolls 34 )and increased body weight( Reference Perez-Escamilla, Obbagy and Altman 28 ). When examining fat intake in relation to obesity, the sources of dietary fat may be of relevance. Intakes and sources of dietary fat have been reported for Irish children( Reference Joyce, Wallace and McCarthy 35 , 36 ) and are described in Table 3. Mean daily intakes (MDI) of fat as a proportion of energy were 33, 35 and 36 %, respectively, for 1–4-, 5–12- and 13–17-year olds. Using the upper end of the reference intake range( 33 )as a cut-off, 25 % of 1–4-year olds, 40 % of 5–12-year olds and 56 % of 13–17-year olds had fat intakes exceeding this cut-off (Table 3). Dietary fat intakes in Irish children are positioned in the middle of a range of intakes from dietary surveys of children across Europe with mean intakes of 30–41 %E being reported for 4–6-year olds, 31–41 %E for 7–14-year olds and 28–42 %E for 15–19-year olds( 33 ). Dairy (milk, yoghurt and cheese), meats (including dishes) and ‘confectionery and snacks’ (biscuits, cakes, chocolate, sweets and savoury snacks) were found to be the main sources of fat for each survey group. For 1–4-year olds, over one-third of their fat intake came from dairy with 17 % provided from meats and 14 % from ‘confectionery and snacks’. For 5–12-year olds, ‘confectionery and snacks’ and dairy each provided 21 % of fat intake and meats provided a further 19 %. For 13–17-year olds, meats provided 22 %, ‘confectionery and snacks’ provided 18 % and dairy provided 16 %. Within the meats category, 11–12 % of fat intake was attributable to processed meats for 5–12- and 13–17-year old children. Both ‘confectionery and snacks’ and processed meats (teenagers only) have been associated with higher energy-dense diets in these children( Reference O'Connor, Walton and Flynn 30 ).
Table 3. Mean daily intake of fat (%TE), proportion of children with intakes of fat exceeding reference intake range* and key sources of dietary fat for Irish children by age-group( Reference Joyce, Wallace and McCarthy 35 , 36 )

TE, total energy.
* Reference intake range for fat intake for 1–3 years: 20–40 %, 20–35 % from 3 years onwards( Reference Perez-Escamilla, Obbagy and Altman 28 ).
Dairy: milk, cheese, yoghurt.
Meats: fresh meat, meat dishes, meat products.
Confectionery/snacks: biscuits, cakes, pastries, chocolate, sweets and savoury snacks.
Dietary fibre
There is considerable evidence to support increased dietary fibre (DF) intakes with a reduced risk of obesity in adults( 37 ) and whilst there are fewer data available for children, there are some studies clearly supporting this association( Reference Ambrosini, Emmett and Northstone 13 , Reference Brauchla, Juan and Story 38 , Reference Johnson, Mander and Jones 39 ). DF intake and sources were estimated for Irish children( Reference Bannon, Walton and McNulty 40 – Reference Deasy, Walton and Hannon 42 ). There are no quantitative guidelines for DF intake in relation to protecting against obesity. The European Food Safety Authority has recently proposed an intake of 2 g/MJ to be adequate for normal laxation in children from the age of 1 year( 37 ). The MDI of DF for 1–4-year olds was 2·5 g/MJ and 72 % of these children met or exceeded the European Food Safety Authority recommendation (Table 4)( 37 ). For school-aged children and teenagers, MDI of DF was 1·8 and 1·9 g/MJ, respectively, with 72 % of 5–12-year olds and 66 % of 13–17-year olds having intakes of dietary fibre <2 g/MJ (Table 4). Mean DF intakes for Irish children are similar to those reported from dietary surveys in other European countries with DF intakes ranging from 2·3 to 2·5 g/MJ for 1–3-year olds and between 1·7 and 2·2 g/MJ for 4–17 years( 37 ).
Table 4. Mean daily intake of dietary fibre (g/MJ), proportion of children with intakes of dietary fibre below the adequate intake (AI) and key sources of dietary fibre for Irish children by age-group( Reference Bannon, Walton and McNulty 40 , Reference Deasy, Walton and Hannon 42 , Reference Bannon, Walton and Hannon 44 )

* AI of 2 g/MJ( 33 ).
The main sources of DF in the diets of Irish children were breads, potatoes, breakfast cereals, fruit and vegetables. For 1–4-year olds, fruit, breads, breakfast cereals and vegetables were the key sources of DF. For these children, fruit contributed one-fifth (22 %) of their DF intake compared with 10 % in older children and teenagers. Breads were the highest contributor to DF intakes in both 5–12- and 13–17-year olds followed by ‘potato and potato products’ and breakfast cereals. For 5–12- and 13–17-year olds, the consumption patterns that distinguished between those with high and low DF intakes were also examined. Children with high DF intakes differed from those with low DF intakes by consuming higher amounts of brown/wholemeal bread, high-fibre ready-to-eat-breakfast-cereals, vegetables and fruit( Reference Bannon, Walton and Flynn 43 , Reference Bannon, Walton and Hannon 44 ).
Fruit and vegetables
Higher intakes of both fruit and vegetables were associated with lower energy density diets in Irish children( Reference Walton, Gleeson and Lyons 29 , Reference O'Connor, Walton and Flynn 30 ). Furthermore, for 5–12- and 13–17-year olds for which determinants of DF were examined, both fruit and vegetables were shown to be of importance in explaining the difference between high- and low-fibre diets( Reference Bannon, Walton and Flynn 43 , Reference Bannon, Walton and Hannon 44 ). For each survey group, intakes of fruits and vegetables were estimated and for school-aged children and teenagers, intakes were compared with the 400 g/d WHO recommendation( 45 ). For both children and teenagers, mean intakes of ‘fruit and vegetables’ were 200 g/d of which almost half were made up of fruit juices. Only 10 % of these population groups met the WHO guideline. These findings mirror those recently reported for 11–18-year old children from the UK National Diet and Nutrition Survey Rolling Programme where only 8 % of girls and 11 % of boys achieved the ‘5 a day’ guideline( Reference Stephen, Mak and Fitt 46 ). For pre-school children, intakes were slightly higher with an average intake for this group of 280 g/d and less reliance on the contribution of fruit juice (20 %) to these intakes.
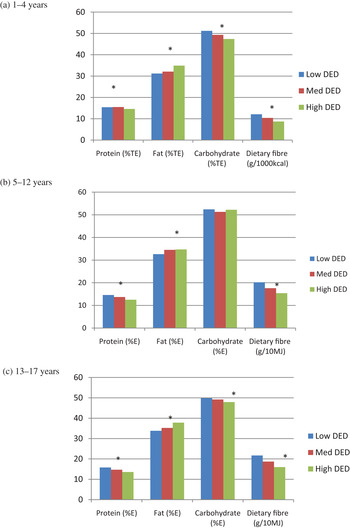
Fig. 4. (colour online) Energy-adjusted intakes of macronutrients and dietary fibre by tertile of dietary energy density (DED) in Irish children aged (a) 1–4 years, (b) 5–12 years and (c) 13–17 years( Reference Walton, Gleeson and Lyons 29 , Reference O'Connor, Walton and Flynn 30 ). %E, % energy; %TE, % total energy; * P<0.05, significantly different nutrient intakes between DED categories.
Confectionery and snacks
As ‘confectionery and snacks’ have been associated with a higher energy density diet and are a key source of fat in the diets of Irish children, their contribution to overall energy intakes for these children is worth noting and has been reported for each of the survey groups( 22 , 36 , 47 ). ‘Confectionery and snacks’ included any type of the following foods: biscuits, cakes, pastries, chocolate, sweets, crisps and other savoury snacks such as popcorn. For 1-year-old children, 8 % of their energy intake was provided by these foods. This increased as children got older with ‘confectionery and snacks’ contributing 13 % of the total energy in 2–4-year olds and 18 % in 5–12-year olds. For 13–17-year olds, 15 % of their energy intake was provided by these foods. The proportion of energy derived from ‘confectionery and snacks (excluding non-chocolate confectionery)’ for UK children is 21 % for 4–14-year olds and 16 % for 15–18-year olds( Reference Gregory, Lowe and Bates 19 ), marginally higher than that of Irish children taking into account the difference in food categorisation between the two surveys.
Beverages
Despite the large number of studies on the topic, evidence for a relationship between consumption of sugar-sweetened beverages and obesity in children remains controversial( 32 , Reference Gibson 48 ). Plain water is recommended as the main source of fluids for children( 32 ). Intakes of plain water have been estimated in Irish children for pre-school children only (Table 5), and show that 75 % of pre-school children consumed water as a beverage with an MDI in total population of 137 g/d. Intakes of milk (as a food or beverage), fruit juices and soft drinks (sugar-sweetened and non-sugar-sweetened) have been estimated for all survey groups (Table 5). Milk was consumed by practically all children and the MDI (g/d) was noteworthy for each age-group (2–4 years: 261; 5–12 years: 276; 13–17 years: 258) but particularly for 1-year olds who had an MDI of total milk of 462 g/d providing 28 % of their total energy intake( Reference Walton 20 ). For each population group, whole milk was consumed in preference to reduced-fat milk with children aged 2 years and upwards consuming on average only one-fifth of their milk intake as the reduced fat variety. MDI of fruit juice was 23 g/d in 1-year olds increasing to 60 g/d in 2–4-year olds and to 94 and 86 g/d in school-aged children and teenagers, respectively. With regard to soft drinks (carbonated beverages, cordials and fruit juice drinks), the MDI increased almost 2-fold from 1-year olds (89 g/d) to 2–4-year olds (165 g/d) and again to 5–12-year olds (327 g/d). Teenagers had comparable MDI of soft drinks (283 g/d) to school-aged children. Pre-school children consumed higher intakes of non-sugar-sweetened soft drinks than the sugar-sweetened alternative. The opposite was true for school-aged children and teenagers where sugar-sweetened soft drinks were preferred to the non-sugar-sweetened alternatives. In terms of their contribution to energy intake, soft drinks contributed just 2 % of the total energy intake in pre-schoolers and 5 % in both school-aged children and teenagers. This compares with soft drink consumption in the USA of 6 %E in 2009–2010( Reference Slining, Mathias and Popkin 49 ).
Table 5. Intakes (g/d; mean, sd of the total population) and per cent of consumers of milks, fruit juice, soft drinks and water in Irish children by age-group (total population)

−, data not available in this format for these survey-groups.
* ‘soft drinks’ include carbonated beverages, cordials and fruit juice drinks.
Eating location
Research has suggested that consumption of foods from outside the home may lead to an increase in energy intake( Reference Poti and Popkin 50 ) and BMI( Reference Thompson, Ballew and Resnicow 51 ). The influence of eating occasion on the diets of 5–12-year-old Irish children was examined( Reference Burke, McCarthy and O'Neill 52 ). Findings showed that food consumed from outside the home (e.g. shop, takeaway, restaurant) accounted for just 6 % of all eating occasions and only 9 % of the total energy intake in the sample population. Of the ‘out of home’ locations, takeaways made the greatest contribution to energy intakes (4 % total population, 8 % in consumers). When compared with food consumed at home, food consumed from outside the home was found to be richer in fat (37 v. 33 %E) and less fibre-dense (10 v. 14 g/10 MJ). ‘Red meats (beef, pork and lamb)’ ‘vegetables’ and ‘potatoes’ were less likely to be consumed outside the home; whereas chips, meat products, pizza, confectionery and savoury snacks made the greatest contribution to foods consumed outside the home( Reference Burke, McCarthy and O'Neill 52 ). As acknowledged by the authors of this study( Reference Burke, McCarthy and O'Neill 52 ), it is difficult to make comparisons with other published data, primarily due to the different definitions used for ‘food consumed outside the home’. For this study, the definition was based on where the food was prepared or obtained but others base the definition on where the food was actually consumed.
Television viewing
Television (TV) viewing has been shown to be associated with BMI in youth( Reference Swinburn and Shelly 53 , Reference Tremblay, LeBlanc and Kho 54 ) and evidence suggests that children and teenagers should watch <2 h TV per day during their discretionary time to improve body composition( Reference Tremblay, LeBlanc and Kho 54 ). Data on ‘time spent watching TV’ and ‘other screen time’ were collected for Irish children. For pre-school children (1–4 years), time in front of a screen was for the most part of little significance, however, it is noteworthy to mention that the per cent of young children spending >2 h watching TV or playing computer games daily increased with age from 4 % of 1-year olds to 25 % of 4-year olds( Reference Walton 20 ). For older children (5–12 years), TV viewing was more significant with 98 % of children reporting TV viewing on an average school day( Reference O' Brien 55 ). Over one-third (36 %) of 5–12-year old children reported watching >2 h/d on an average school-day and over two-thirds (65 %) reported watching TV >2 h/d on a week-end day or school-holiday. Similar findings were reported for teenagers. Among 13–17-year olds, over one-third (35 %) reported watching >2 h TV/d on an average weekday and two-thirds (64 %) reported watching TV >2 h on a weekend day. Computer game use was also popular in this age-group with 30 % of teenagers reporting playing computer games for >1 h on a weekday and half of teenagers reporting playing computer games for >1h on an average weekend day (JL O'Neill, unpublished results). A recent study of children aged 2–10 years from eight different European countries showed that 29 % of children (33 % males and 25 % of females) watched more than 2 h/d screen time (including media use), more evident on weekend days( Reference Santaliestra-Pasías, Mouratidou and Verbestel 56 ). Studies have shown that parents play a central role in their children's screen viewing and that the time that children spend in screen viewing is influenced by both environmental (e.g. media availability in bedrooms) and socio-cultural factors( Reference De Decker, De Craemer and De Bourdeaudhuij 57 – Reference Tandon, Zhou and Sallis 59 ).
Strengths and limitations of the dietary surveys
For both the NCFS and the National Teens’ Food Survey, a nationally representative sample of the population of the Republic of Ireland was obtained. The National Pre-School Nutrition Survey sample was of higher socio-economic status than the general population however food and nutrient intakes and body weight measurements were similar across the socio-economic status groups and therefore the data were left unadjusted. Data presented in this review were not adjusted for potential under-reporting however this is unlikely to have a significant effect on nutrient intakes, which have been energy adjusted. Key strengths of the surveys lie in the detailed dietary assessment methodology combined with measured anthropometry.
Conclusion
Using two separate approaches to determine the prevalence of obesity in Irish children, approximately one in five children (2–17 years) were classified as being overweight (including obese). Compared with data from the preceding Irish National Nutrition Survey (1988–89), an increase in mean BMI and weight was observed for both boys and girls aged 8–12 years with no change observed for mean height. With regard to dietary habits, one notable finding was the transition from a low energy density diet in pre-schoolers to a higher energy density diet in school-aged children and teenagers. This was associated with a change to less favourable dietary intakes for fibre, fat, fruit and vegetables, ‘confectionery and snacks’ and sugar-sweetened beverages as children got older. For 5–12-year olds, food consumed from ‘outside of the home’ was shown to contribute just 9 % of energy intake however it provided a higher portion of energy from fat and was less fibre-dense than food prepared at home. TV viewing was significant for older children (5–12 years) and teenagers with 35 % of school-aged children and teenagers reported to be watching >2 h TV on an average school-day and 65 % watching >2 h of TV/d on a weekend day. This was of lesser importance for pre-school children but TV viewing did increase with age from 1 to 4 years.
Acknowledgements
We would like to acknowledge our thanks to all the participants and researchers involved in the surveys.
Financial Support
The Irish Universities Nutrition Alliance dietary surveys are funded by the Irish Department of Agriculture, Food and the Marine (DAFM). The DAFM had no role in the design, analysis or writing of this article.
Conflicts of Interest
None.
Authorship
A. F., M. J. G. and A. P. N. are principal investigators for these studies. J. W. and B. McN. are responsible for the day-to-day co-ordination of the surveys. J. W. gave the presentation at the Nutrition Society's Irish section Meeting and wrote the paper.


