


Life style-related diseases seem to be initiated in childhood( Reference Koplan, Liverman and Kraak 1 ), and since diet affects the health, growth and development of children to a large extent( 2 ), the diet of children is important.
The Danish National Survey of Diet and Physical Activity (DANSDA) 2003–8 showed that the overall diet of Danish children contains too many energy-dense, nutrient-poor foods, too much sugar, salt, fat and saturated fat, and too little dietary fibre, fruit and vegetables, and fish( Reference Pedersen, Fagt and Groth 3 ). The same picture is found when looking at the intake on weekdays only( Reference Christensen, Kørup and Trolle 4 , Reference Hoppe, Biltoft-Jensen and Trolle 5 ). A report has suggested that the intake of fish, fruit and vegetables should be increased and that the intake of high-fat meat products should be replaced with lean meat products in the lunch meals of Danish children. The report has also suggested that children's sugar-rich snack meals should be replaced by fruit, vegetables and whole-grain products( Reference Hoppe, Biltoft-Jensen and Trolle 5 ). A similar picture was found in the UK, where Evans et al. ( Reference Evans, Greenwood and Thomas 6 ) in a cross-sectional survey found that few packed lunches meet the UK school meal standards.
Danish children have been reported to consume 40–45 % of their daily energy intake during school hours and after-school activities( Reference Damsgaard, Dalskov and Petersen 7 ). Denmark has no national school food programme, and 75 % of Danish school children aged 7–10 years bring a packed lunch from home, usually based on open sandwiches with Danish rye bread( Reference Christensen, Kørup and Trolle 4 ). The topping is usually sliced meat products and liver paste. Fruit and, to a lesser extent, vegetables are also brought from home( Reference Christensen, Kørup and Trolle 4 ). Most Danish schools (95 %) subscribe to a milk service and a few schools (0·2 %) have vending machines with sugar-sweetened beverages( Reference Lissau, Hesse and Juhl 8 ).
Since children spend more time in schools than in any other environment away from home, schools provide an excellent setting for public health nutritional interventions that will reach all children regardless of ethnic and socio-economic background( Reference Damsgaard, Dalskov and Petersen 7 , Reference Lavelle, Mackay and Pell 9 , Reference Story, Nanney and Schwartz 10 ). Social differences in overweight and obesity, especially among boys of parents with low education, have widened in Denmark( Reference Groth, Christensen and Knudsen 11 ). Since establishing healthy eating patterns in childhood has greater prevention potential than changes later in life( Reference Morrison, Friedman and Wang 12 – Reference Freedman, Khan and Serdula 14 ), establishing healthy dietary habits should start in childhood.
The OPUS School Meal Study was part of the Danish research project OPUS (Optimal well-being, development and health for Danish children through a healthy New Nordic Diet (NND))( Reference Damsgaard, Dalskov and Petersen 7 ). The aim of the present part of the OPUS School Meal Study was to assess the impact of serving school meals based on the principles of the NND compared with the usual packed lunches on dietary intake and nutrient status. The effect of the NND on growth, early disease risk markers, well-being and absence from school, cognitive function, food waste and cost, as well as social and cultural features has been investigated by other research groups.
Unlike the OPUS School Meal Study, most published school intervention studies have been multi-component studies, in which changes in existing school meals are combined with physical activity and/or nutritional education( Reference De Bourdeaudhuij, Van Cauwenberghe and Spittaels 15 – Reference Osganian, Ebzery and Montgomery 24 ) often focusing on the prevention of obesity in children( Reference Lavelle, Mackay and Pell 9 , Reference Grydeland, Bjelland and Anderssen 16 , Reference Sahota, Rudolf and Dixey 20 , Reference Caballero, Clay and Davis 23 , Reference Summerbell, Waters and Edmunds 25 – Reference Waters, de Silva-Sanigorski and Hall 28 ). Other school meal interventions have increased fruit and vegetable intake as the main focus( Reference Kristjansdottir, Johannsson and Thorsdottir 29 – Reference Knai, Pomerleau and Lock 32 ). In just a few studies, professional chefs have been hired to train cafeteria staff in providing healthier, more palatable school meals. One example is a recent pilot study that aimed at replacing trans and saturated fats with unsaturated fats, reducing added sugar and salt, and increasing whole grains and fibre intake as well as improving the palatability of the meals, and most of these aims were achieved( Reference Cohen, Smit and Parker 33 ).
To our knowledge, no randomised controlled trials have assessed the impact of introducing a full-meal concept with recipes and menus developed by chefs to ensure the gastronomic potential of the food covering lunch and all snacks during the school day, as well as measuring children's dietary intake, dietary and nutrient status, physical activity, health and cognitive function( Reference Damsgaard, Dalskov and Petersen 7 ).
The aim of the present study was to investigate the effects of serving NND school meals compared with the usual packed lunches on the dietary intake at the food level, and on the average energy, macro- and micronutrient intakes of the 834 Danish children aged 8–11 years who took part in the OPUS School Meal Study.
Subjects and methods
Design
The OPUS School Meal Study was a cluster-randomised, controlled, unblinded, cross-over study. For two 3-month periods during the school year 2011–2, children received school meals based on the NND or their usual packed lunches (control) in random order. The overall study design has been described in more detail previously( Reference Damsgaard, Dalskov and Petersen 7 ). Written informed consent was obtained from all parents/guardians of the children. The study protocol was approved by the Danish National Committee on Biomedical Research Ethics (H-1-2010-124). The trial was registered in the database www.clinicaltrials.gov (no. NCT 01457794)( Reference Damsgaard, Dalskov and Petersen 7 ).
Subjects
The initial contact was established with thirty-nine schools from the eastern part of Denmark (Zealand and Lolland-Falster). Children from forty-six school classes (3rd and 4th grades) at nine Danish schools were invited to participate in the OPUS School Meal Study. The inclusion criteria for each school have been described elsewhere( Reference Damsgaard, Dalskov and Petersen 7 ). Exclusion criteria for the children were diseases or conditions that might obstruct the measurements or put the children at risk if eating the OPUS school diet (e.g. due to nutrient malabsorption or food allergies). The recruitment procedure, inclusion and exclusion criteria have been described in more detail elsewhere( Reference Damsgaard, Dalskov and Petersen 7 ). In total, 834 children were included in the baseline part of the study.
Background information
At baseline, each child accompanied by at least one parent or guardian underwent a 2 h in-depth interview by a trained interviewer (including instructions on how to use the dietary assessment tool), either at the school or at home( Reference Damsgaard, Dalskov and Petersen 7 ). The educational level of the household was categorised according to the standard classifications of Statistics Denmark, i.e. as the highest level of education achieved by a parent in the household. The variable was divided into six different groups depending on the educational level (lower secondary education, upper secondary education or equivalent, vocational education, short higher education, Bachelor's degree or equivalent, Master's degree or higher education).
Dietary intervention
During the 3-month NND intervention period, the children were offered a mid-morning snack, an ad libitum hot lunch meal and an afternoon snack served in a small bag( Reference Damsgaard, Dalskov and Petersen 7 ). The meals were free of charge for all the children in the invited school classes, regardless of their participation in the study, and they were produced locally at each school by trained chefs and kitchen personnel hired for the study. Small groups of four to six children took part in the cooking every day. The snacks and lunch meals were designed to cover 40–45 % of the daily energy intake based on the energy requirement of an 11-year-old boy( Reference Hoppe, Biltoft-Jensen and Trolle 5 , 34 ). A 3-week menu was developed for each of the three seasons (autumn, winter and spring) and was served repeatedly during the season. The menus complied with the principles of the NND( Reference Damsgaard, Dalskov and Petersen 7 , Reference Mithril, Dragsted and Meyer 35 , Reference Mithril, Dragsted and Meyer 36 ). Each week, the menu plan was: Monday soup, Tuesday meat, Wednesday vegetarian, Thursday fish and a buffet day on Fridays consisting of pre-made leftovers from the four 1st days of the week( Reference Damsgaard, Dalskov and Petersen 7 ). During the 3-month control period, the children brought their usual packed lunches from home. The typical packed lunch consists of open Danish rye bread sandwiches with various toppings, such as sliced meat products, chocolate spread and liver paste, and fruit and/or vegetables( Reference Christensen, Kørup and Trolle 4 ). Water was served with the NND lunch, but children with milk subscriptions continued to have their milk as usual.
Dietary assessment
The whole diet of the children was recorded over seven consecutive days using an interactive Web-based Dietary Assessment Software for Children (WebDASC) developed for the purpose and validated during the OPUS pilot study( Reference Biltoft-Jensen, Trolle and Christensen 37 – Reference Biltoft-Jensen, Matthiessen and Rasmussen 39 ). Briefly, WebDASC is a self-administered Internet-based interactive food record tool for use by children aged 8–11 years with or without support from their parents, completed at the end of the day. The parents and children were instructed on how to use the dietary assessment tool by a trained interviewer before the study. Reminder emails were sent to the parents if the dietary assessments were not completed on a daily basis during the assessment periods, reminder telephone calls were made when dietary assessment was not initiated, and a telephone hotline was available for the families at all times in case of questions. The dietary assessment was recorded during the weeks before the clinical measurements as described elsewhere( Reference Damsgaard, Dalskov and Petersen 7 ), and included a baseline measurement and measurements at the end of the first and at the end of the second dietary intervention period. Since the schools joined the study one by one, the first dietary assessment started between August and November 2011, and data collection ended in June 2012. Children without access to a computer or the Internet filled in a paper version of a 7 d pre-coded food record based on the food-record used in the DANSDA 2003–8( Reference Pedersen, Fagt and Groth 3 ).
Estimation of dietary intake
The intake data were processed by the in-house-developed General Intake Estimation System, a system originally developed for the DANSDA( Reference Pedersen, Fagt and Groth 3 ), which interpreted the recorded consumption into the ingredients that form the basis for the further calculations and estimations of intake of food, energy and nutrients for each individual. For these calculations, intakes were directly collected by querying the WebDASC data tables. The General Intake Estimation System used recipes developed for the WebDASC covering both ordinary and OPUS foods. The nutrient data were obtained from the Danish Food Composition Databank, revision 7( Reference Saxholt, Christensen and Møller 40 ), supplied with data compiled in-house for the new Nordic foods. Dietary intake was estimated for each child as an average of the days recorded. Dietary intake was estimated for thirteen food groups, energy intake, energy distribution, nine macronutrients and nineteen micronutrients (ten vitamins and nine minerals).
Energy density was calculated as energy (kJ) divided by weight (g) for food and beverages separately. Food was defined as solid food and liquids consumed as food (e.g. soups and yogurt). Beverages were defined as either energy-containing (e.g. milk, sweetened drinks and juice) or non-energy-containing (e.g. water and artificially sweetened drinks).
Under-, acceptable and over-reporters
Under-reporters (UR), acceptable reporters (AR) and over-reporters (OR) were determined by the subjects' EI:BMR ratio (EI; mean reported energy intake) and classified by cut-offs suggested by Black( Reference Black 41 ) as follows: EI:BMR ≤ 1·05 for UR, EI:BMR = 1·06–2·27 for AR and EI:BMR ≥ 2·28 for OR, using a physical activity level of 1·55. The BMR was calculated from descriptive equations (Oxford prediction) using height, weight, sex and age( Reference Henry 42 ).
Statistical analysis
Analyses included standard descriptive statistics. All means and medians include both eaters and non-eaters (with zero intakes).
Hierarchical mixed models were used to investigate the effect of eating the NND compared with the control separately for all food groups, energy intake, energy distributions, energy density, micro- and macronutrients. Since the children were nested in classes, and the classes were nested in schools, the models included three random effects (child, class and school). The models also included fixed effects: sex (boy and girl); grade (3rd and 4th); season (autumn, winter and spring), BMI (in four groups of approximately similar size: BMI ≤ 15·6 kg/m2, 15·6 < BMI ≤ 16·6 kg/m2, 16·6 < BMI ≤ 18·6 kg/m2 and BMI>18·6 kg/m2); diet (packed lunch and NND); dietary period; household education (lower secondary education, upper secondary education or equivalent, vocational education, short higher education, Bachelor's degree or equivalent, Master's degree or higher education).
Possible carry-over effects were tested by the interaction between diet and dietary period, allowing for different effects of the NND in the first and second dietary periods.
Some children had zero intakes of some of the food groups (e.g. cheese, potatoes, poultry or fish), which means that the assumptions behind the normal models are not fulfilled, and these semi-continuous outcomes were therefore analysed in two steps( Reference Min and Agresti 43 ): first, a logistic regression model with random effects for the binary outcome (intake v. no intake) giving the odds of having a zero intake, and then the above-mentioned hierarchical mixed model for the continuous outcome for the children with a positive intake only.
In separate hierarchical mixed models, the effect of reporting (UR, OR and AR) was included together with sex (boy and girl), grade (3rd and 4th), diet (packed lunch and NND) and dietary period. The main reason for this was to see whether the effect of diet was influenced by this change in the model.
A separate hierarchical mixed model was also used to test whether children who dropped out of the study differed from the rest of the children with regard to energy intake and energy distributions at baseline.
The assumptions underlying the models were tested using residual plots and quartile-quartile (QQ) plots.
The outcomes were all continuous variables, and most variables (all food groups, all micronutrients and dietary fibre) were transformed using the natural logarithm (log2). All transformed variables were back-transformed using the anti-log when presenting the results.
All statistical analyses were performed using SAS version 9.3 (SAS Institute, Inc.). The significance level chosen was P< 0·05.
Results
In total, 834 children were included in the present study: 798 (95·7 %) completed the first dietary assessment sufficiently (intake registered 4–7 d), twenty-six completed the dietary assessment insufficiently (0–3 d) and ten dropped out; 741 (88·8 %) completed the second dietary assessment sufficiently, thirty completed the dietary assessment insufficiently and twenty-seven dropped out; and 663 (79·5 %) completed the third dietary assessment sufficiently, forty-nine completed the dietary assessment insufficiently and thirty-one dropped out. During the first, second and third dietary assessments, six, five and four children used the paper version, respectively. The baseline characteristics of the children included are shown in Table 1. All results are based on average total daily intakes.
Table 1 Baseline characteristics of the children included in the study (Mean values and standard deviations)
* n 792.
† n 793.
Carry-over effects
For most variables, no carry-over effect of the dietary period was observed. A carry-over effect was found for vitamin D (P= 0·007), vitamin E (P= 0·04) and vitamin C (P= 0·02), but this was found to be due to seasonal variation, because the carry-over effect disappeared when we adjusted for seasonal variation (P= 0·3, 0·7 and 0·8, respectively).
Effects of the New Nordic Diet on the intake of food groups
All children reported consuming milk, bread and other cereals, vegetables, fruit, meat, eggs, fats, sugar and candy, and beverages (excluding milk) on a daily basis. However, certain food groups (cheese, potatoes, poultry and fish) were not eaten by all children during the control and intervention periods (Table 2). The children had significantly higher odds of eating cheese (OR 2·66, 95 % CI 1·24, 5·68), potatoes (OR 16·2, 95 % CI 3·84, 68·39) and fish (OR 3·79, 95 % CI 2·80, 5·15) during the NND period than in the control period, but this was not the case for poultry (P= 0·23) (Table 3).
Table 2 Median daily food intakes in children during the control period with packed lunches and during the intervention period with New Nordic Diet (NND) lunches (Median values with their 10th and 90th percentiles)
* n 699 for milk and milk products.
† Excluding milk.
Table 3 OR of non-zero intakes for the New Nordic Diet (NND) compared with packed lunch (model 1) and the effect of the NND on food groups compared with the control (model 2) (Odds ratios or estimates and 95 % confidence intervals)
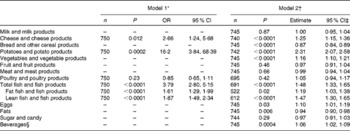
n, number of children who contributed to the analyses.
* Model 1 includes children with zero intakes. Analysed by logistic regression models for the binary outcome (intake v. no intake) with random effects to take the design into account. The analyses were carried out for the food groups for which the children had a zero intake, controlling for sex, grade and dietary period (the OR of non-zero intakes in the NND group compared with packed lunch).
† Model 2 includes children with intakes greater than zero. Analysed by hierarchical mixed models, controlling for random effects (child, class and school) and fixed effects (sex, grade, dietary period, BMI, season eating the NND and household education).
‡ All food groups were log2 transformed; hence estimates are expressed in percentages.
§ Excluding milk.
Among the consumers (intake above zero), significantly (P< 0·0001) higher intakes (% increase) of potatoes and potato products (130 %, 95 % CI 2·07, 2·58), fish and fish products (48 %, 95 % CI 1·33, 1·65), cheese and cheese products (25 %, 95 % CI 1·15, 1·36), vegetable and vegetable products (16 %, 95 % CI 1·10, 1·21) and eggs (10 %, 95 % CI 1·01, 1·19), as well as beverages (excluding milk) (P= 0·0004) (6 %, 95 % CI 1·02, 1·09) were reported during the NND period than in the control period. Significantly lower intakes (% decrease) of bread and other cereal products (13 %, 95 % CI 0·84, 0·89; P< 0·0001) and of fats (6 %, 95 % CI 0·90, 0·98; P= 0·006) were reported during the NND period than in the control period (Table 3). No differences in the reported intake of milk and milk products (P= 0·87), fruit and fruit products (P= 0·46), meat and meat products (P= 0·66), poultry and poultry products (P= 0·42) or sugar and candy (P= 0·29) were found between the two periods (Table 3).
Effect of the New Nordic Diet on energy intake, energy distributions and energy densities
No difference was found in the average energy intake per d between the NND and control periods (P= 0·44) (Table 4). However, the energy density from food (P< 0·0001) and beverages (P= 0·001) was lower during the NND period than in the control period. On average, energy density was 0·5 kJ/g less from food and 0·04 kJ/g less from beverages during the NND period than in the control period (Table 4). Finally, the energy distributions from fat and protein were both statistically different (P< 0·0001) between the two periods, with children reporting on average 0·9 % lower energy intake from fat and 0·9 % higher energy intake from protein during the NND period than in the control period with packed lunches. No differences in energy distribution from carbohydrate and added sugar were found between the two periods (P= 0·72 and 0·56) (Table 4).
Table 4 Mean daily energy and macronutrient intakes in children during the control period with packed lunches and during the intervention period with New Nordic Diet (NND) lunches and the effect of the NND on energy and macronutrients compared with the control (Mean values and standard deviations; estimates and 95 % confidence intervals)
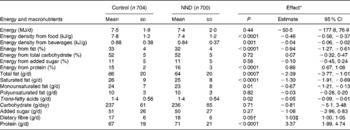
* Analysed by hierarchical mixed models, controlling for random effects (child, class and school) and fixed effects (sex, grade, dietary period, BMI, season eating the NND and household education).
† Borderline significant.
‡ Dietary fibre was log2 transformed; hence this estimate is expressed in percentages.
Effect of the New Nordic Diet on the intake of macronutrients
Children reported a significantly lower average daily intake of total fat (2·4 g, P= 0·0007), saturated fat (1·3 g, P< 0·0001), monounsaturated fat (0·7 g, P= 0·01) and trans-fatty acid (0·05 g, P= 0·02) during the NND period than in the control period, and they reported an average higher daily intake of protein (3·4 g, P< 0·0001) (Table 4). The intake of dietary fibre was borderline significantly higher during the NND period than in the control period (P= 0·05). No differences in the intake of polyunsaturated fat (P= 0·82), carbohydrate (P= 0·71) and added sugar (P= 0·27) were found between the two periods (Table 4).
Effect of the New Nordic Diet on the intake of micronutrients
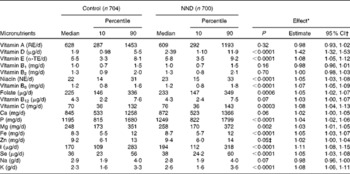
For the majority of the micronutrients, the NND period resulted in higher reported average daily intakes than in the control period with packed lunches (Table 5).
The largest effect was found in the intake of vitamin D (P< 0·0001), with a 42 % higher intake during the NND period than in the control period. The children reported 5–8 % higher intakes of vitamin E (P< 0·0001), niacin (P< 0·0001), vitamin B6 (P< 0·0001), folate (P= 0·0006) and vitamin C (P= 0·0003) during the NND period than in the control period. No differences were found in the intakes of vitamin A (P= 0·32), B1 (P= 0·16), B2 (P= 0·70) and B12 (P= 0·07) (Table 5).
The largest difference in the intake of minerals between the NND and control periods was found for the intake of iodine (P< 0·0001), where the intake in the NND period was 11 % higher than that in the control period with packed lunches. The average reported intakes of P (P< 0·0001), Mg (P= 0·002), Fe (P< 0·0001), Se (P< 0·0001) and K (P< 0·0001) were 3–8 % higher during the NND period than in the control period. The intake of Zn was borderline significantly higher during the NND period than in the control period (P= 0·05). No differences in the intakes of Ca (P= 0·06) and Na (P= 0·07) were found between the two periods (Table 5).
Table 5 Median daily micronutrient intakes in children during the control period with packed lunches and during the intervention period with New Nordic Diet (NND) lunches and the effect of the NND on micronutrients compared with the control (Median values with their 10th and 90th percentiles; estimates and 95 % confidence intervals)
RE, retinol equivalent; TE, tocopherol equivalent; NE, niacin equivalent.
* Analysed by hierarchical mixed models, controlling for random effects (child, class and school) and fixed effects (sex, grade, dietary period, BMI, season eating the NND and household education).
† All micronutrients were log2 transformed; hence estimates are expressed in percentages.
‡ Borderline significant.
Sex and grade differences
With the exception of vitamin C, significant sex differences (P< 0·05) were found between the reported intakes for all macro- and micronutrients, total energy intake and food energy density, with the girls having a lower intake than boys. The same pattern was found for several of the food groups (bread/cereals, meat, fats, sugar/candy and beverages). Fruit intake was higher in girls than in boys. However, no differences were found between boys and girls (P>0·05) for the intakes of milk, cheese, potatoes, vegetables, poultry, fish and eggs, and energy density or energy intake distributions from fat, carbohydrate, added sugar and protein.
For thirteen of the nineteen micronutrients, differences were found between the children attending the 3rd and 4th grades (P< 0·05), with the children attending the 3rd grade reporting higher average intakes than those in the 4th grade (vitamin A, vitamin B1, vitamin B2, niacin, vitamin B6, folate, vitamin B12, C, Ca, P, Mg, Se and K). There was also a borderline significant difference for milk. For the remaining variables, no differences between the children attending the 3rd and 4th grades (P>0·05) were observed.
Over- and under-reporters
In the three dietary assessments, 9–14 % of the children were classified as UR and 2–3 % as OR. The effect of eating the NND on most variables was the same whether the child was an UR, an AR or an OR. However, for monounsaturated fat, trans-fatty acids and fats, the effect changed from a significant (P values shown in Tables 3 and 4) to a non-significant (P>0·05) decrease. For vitamin B12 and Ca, the effect of eating the NND changed from being a non-significant (P values shown in Table 5) to a significant (P< 0·05) increase. The variables with a borderline significance (dietary fibre and Zn; P values shown in Tables 4 and 5) changed to having a significant increase.
Dropouts
Of the total children, sixty-eight dropped out of the study. Of these, fifty-five completed the dietary assessment at baseline. Their total energy intake and the energy distribution from fat and carbohydrate were not different from the remaining children (P>0·05). Their energy distribution from added sugar was significantly higher (P= 0·0002), and their energy distribution from protein was significantly lower (P= 0·03) than those in the children who continued in the study. More detailed dropout analysis has been described previously( Reference Damsgaard, Dalskov and Petersen 7 ).
Discussion
In the present cluster-randomised, cross-over, school-based intervention study with Danish children aged 8–11 years, the overall diet was nutritionally improved during the period when the children were offered free school lunch and snacks based on the principles of the NND compared with their habitual diet during a school day. Other effects of the NND on health and function outcomes and economic considerations will be reported elsewhere.
Since the intervention replaced lunch packs traditionally based on cold sandwiches with hot meals, it is not surprising that the intake of bread decreased during the intervention period and the intake of potatoes increased. The increased fish and vegetable intake was in agreement with the principles of the NND( Reference Mithril, Dragsted and Meyer 35 ), but this was not the case for the higher intake of cheese during the NND period than in the control period. This could be a consequence of using cheese as a flavouring, for example with potatoes and vegetables, and as a supplement to soups. Moreover, skyr (an Icelandic cultured low-fat, high-protein dairy product) was used in several sauces and dressings and was categorised as cheese (similar to curd cheese). The increased fish intake was mirrored in an increased intake of vitamin D and iodine, and the increased potato intake was mirrored in an increased intake of K. Fruit is an important part of the NND, and fruit (mainly apples, pears and dried berries) was offered to the children every day at school, either as part of the lunch or as an afternoon take-away snack. It was therefore unexpected that the reported fruit intake during the NND period was not greater than that in the control period, and it must be assumed that the fruit was either not eaten or not registered, or that fruit was already a part of the packed lunch brought from home during the control period. Fruit intake has been a focus point in Danish schools for several years in the form of, for example, ‘fruit breaks’( Reference Hoppe, Iversen and Niemann 44 ), and the fruit intake among Danish children is in the high end compared with other European countries( Reference Yngve, Wolf and Poortvliet 45 ). Some other intervention studies have focused on fruit and vegetables, but only improved the fruit intake, not the vegetable intake( Reference Evans, Christian and Cleghorn 30 ), so although the fruit intake was not improved in the present study, it was gratifying that the intake of vegetables increased. The intake of fats decreased and the fat quality improved during the NND period compared with the control period, and this result was in accordance with the principles of the NND, which aim to fulfil the official nutrition recommendations( 34 ). No differences were seen in the overall energy intake between the NND and control periods; however, the aim of the OPUS School Meal Study was not weight loss. The energy intake from fat was also reduced and the energy intake from protein increased during the NND intervention period. The total energy intake in the children taking part (7·4–7·5 MJ/d) was lower than the data from a similar age group in the DANSDA 2003–8 (8·4 MJ/d)( Reference Pedersen, Fagt and Groth 3 ), but higher than that found in the OPUS pilot study (7·2 MJ/d), when flu was prevalent during the dietary assessment period( Reference Biltoft-Jensen, Matthiessen and Rasmussen 39 ). However, the energy distributions of the dietary intakes during both the NND and control periods were similar to both the National Survey and the pilot study( Reference Pedersen, Fagt and Groth 3 , Reference Biltoft-Jensen, Matthiessen and Rasmussen 39 ). It was found that the intervention had no impact on the total intake of added sugar (and carbohydrate). It can be speculated that any changes in the dietary intake during school hours might have been compensated for outside school hours and thus be responsible for this lack of difference( Reference Donnelly, Jacobsen and Whatley 18 ). Further analyses are needed to evaluate whether and how consumption of NND school meals may have an impact on food choices outside of school hours.
The differences in the intakes of some nutrients and food groups between the NND intervention period and the control period were small, and it can be questioned whether a 3–8 % increase in the intake of some micronutrients has relevant nutritional beneficial effects for apparently healthy Danish children. However, the overall quality of the diet was improved (e.g. more fish and vegetables and less saturated fat). A reduced risk of CVD has been suggested among adults with an increased intake of fruit and vegetables, or an increased intake of fish, or a reduced intake of saturated fat( Reference Hartley, Igbinedion and Holmes 46 – Reference Musa-Veloso, Binn and Kocenas 48 ). The long-term implications and improvements in health are difficult to predict, but consumptions of traditional Nordic foods have been associated with reduced mortality in adults, and randomised trials in high-risk individuals have shown improvements in the risk markers of CVD( Reference Adamsson, Reumark and Fredriksson 49 , Reference de Mello, Schwab and Kolehmainen 50 ). Although some of the changes are small, they are all in the direction of a diet and nutritional improvement. Moreover, the positive effects shown are the result of just one lunch meal and two snack meals eaten only on weekdays over 3 months, and the effects are therefore ‘diluted’ by food eaten outside school. This school meal intervention based on the principles of the NND( Reference Mithril, Dragsted and Meyer 35 ) introduced many new foods and flavours to the children. Additionally, eating foods from one's own geographical region may have environmental implications by reducing the burden of transport and production( Reference Mithril, Dragsted and Meyer 35 ).
The differences found between the 3rd and 4th grade children may be explained by the fact that children in the 3rd grade are often supervised by teachers during most activities during the day, while this is not the case for many of the 4th graders. During the OPUS School Meal Study, observations by the researchers present at the schools strongly suggested that the 3rd graders followed the guidelines of the teachers and the encouragements of the chefs and other kitchen staff to taste the food, whereas the 4th graders were often less guided by the teachers and typically in a hurry to get outside to play after the lunch break. Moreover, the 3rd graders may have received more parental aid with the dietary assessment in the WebDASC than the 4th graders. Sex differences may be explained by a combination of a slightly higher body weight (700 g) and a relatively higher proportion of lean body mass in boys.
The NND school meals were free and inevitably cheaper than the packed lunches brought from home. The present study was thus an artificial situation designed for research purposes, where the focus was on testing the effect of the NND on multiple outcomes. If a school meal programme is rolled out in Denmark, meals will not be free. However, the price could be differentiated depending on the income of the parents, as seen at a school meal project in Copenhagen( Reference Sylow 51 ). Whether this price principle could be employed over the entire country is uncertain. The economic aspects of a school meal programme are crucial for its success in real life, and the costs of NND school meals will be addressed separately. However, schools provide an excellent setting for public health nutritional interventions, because they give the potential to reach all children regardless of ethnic and socio-economic background.
To our knowledge, no randomised controlled trial has assessed the impact of introducing a full-meal concept prepared by chefs and covering lunch and snacks during the school day, including the measurement of children's dietary and nutrient intake using a Web-based dietary assessment tool especially developed for children. However, good intentions with high-quality food prepared by professional chefs based on new recipes and ingredients and the use of a child-friendly tool to assess the intake will not lead to any improvements in the diet, health and development of the children if the foods are not consumed by the children( Reference Gatenby 52 ). Several factors are known to influence the intake of food, including adequate time to eat the food, a feeling of ownership of the food, the presentation of the food, food being recognisable to the children and a pleasant eating environment( Reference Story, Neumark-Sztainer and French 53 ). In the OPUS School Meal Study, several actions were taken to meet these challenges. The lunch break was extended during the NND period from the normal 15 to 20–25 min. Small groups of children took part in the cooking every day; they presented the foods to their classmates and helped with the serving of the food, in order to create a feeling of ownership of the food. Moreover, the children were encouraged to taste all the food served and to have a reasonable plate distribution between meat/fish, vegetables and starchy foods. The weekly menu of the season was repeated every 3 weeks, which increased the likelihood of the food being recognisable to the children. Finally, the food was served at set tables in the classroom or in a common eating area depending on the facilities of the schools.
The general strengths and limitations of the study have been described elsewhere( Reference Damsgaard, Dalskov and Petersen 7 ). The novel interactive Web-based dietary assessment tool developed for children was a help for the families who took part, because they found it relatively easy to use( Reference Biltoft-Jensen, Trolle and Christensen 37 ). However, one limitation was that some of the families had no access to their own computer. During the lunch breaks, a lot of effort was put into motivating the children to try new foods and dishes. However, one limitation was not having adult ‘food ambassadors’ encouraging the children to eat the food at every school in the same way. The pilot study was conducted during the winter season, and the recipes used in the pilot study therefore included winter-season recipes. However, the main OPUS School Meal Study was conducted over three seasons (autumn, winter and spring), and one possible limitation of the study was that the autumn- and spring-season recipes had not been tested on a large scale beforehand. The eating environment during the NND period was not the same as that of the control period, favouring the NND meals (longer lunch break and nicer eating environment). Finally, since NND meals were very different from packed lunch, 3 months might not have been enough time to familiarise the children to the NND. Under- and over-reporting of energy intake can affect dietary surveys( Reference Glynn, Emmett and Rogers 54 ). In the present study, the effect of the NND with regard to reducing intakes of monounsaturated fat, trans-fatty acids and fats became non-significant after adjusting for the reporting status (OR, UR and AR), which could indicate differential reporting of fat intake for the three types of reporters. The children who dropped out of the present study did not differ from those who continued in the study with regard to their average total energy intake, but they did have a higher energy distribution from added sugar and a lower energy distribution from protein. This emphasises the importance of schools as a setting to reach all children regardless of their nutritional background in order to help the children who are most in need( Reference Bauer, Neumark-Sztainer and Hannan 55 ).
In conclusion, the present study showed that the overall dietary intake at the food and nutrient levels was improved among children aged 8–11 years when their habitual packed school lunches were replaced by school meals following the principles of the NND.
Acknowledgements
The authors thank all the children and their parents/guardians for their participation in the study. The authors thank research dietitian Karin Hess Ygil for checking and calculating the nutrients in all recipes and meals, and data manager Karsten Kørup for making the dietary intake calculations.
The present study was supported by a grant from the Nordea Foundation (grant no. 02-2010-0389). The funder had no role in the design, analysis or writing of this article.
The authors' contributions are as follows: A. B.-J., C. T. D., A. A., K. F. M. and I. T. designed the study; R. A., A. B.-J. and I. T. formulated the research questions; R. A. and M. E. collected the dietary intake data; S.-M. D., C. T. D. and A. V. T. contributed to the collection of the other data; E. W. A. undertook the statistical analyses in cooperation with R. A., A. B.-J. and I. T.; T. C. undertook the calculations of the dietary intake data in cooperation with R. A. and M. E.; R. A. wrote the manuscript. All authors read and approved the final content of the manuscript.
A. A. is a consultant or member of the advisory board for a number companies, including BioCare Copenhagen, Denmark; Global Dairy Platform, USA; Jenny Craig, USA; McCain Foods Limited, USA; McDonald's, USA; Pathway Genomics Corporation, USA; and S-Biotek, Denmark. The rest of the authors have no conflicts of interest to declare.


