INTRODUCTION
West Nile virus (WNV) has become one of the most widely distributed arboviruses, being isolated throughout the world, with the exception of Antarctica [Reference Kramer, Styer and Ebel1]. The virus is normally maintained and spread through a bird–mosquito cycle, and is usually introduced in unaffected areas through migratory movements [Reference Kramer, Styer and Ebel1, Reference Hubálek and Halouzka2]. The virus has an exceptionally wide range of hosts and possible vectors, and therefore it is considered an ecological generalist compared to other arboviruses [Reference Artsob3]. Humans and equines are susceptible to infection, but they are considered dead-end hosts and do not contribute to the transmission cycle [Reference Kramer, Styer and Ebel1]. A self-limiting febrile illness occurs in about 20–30% of infected humans, although in 1/150 infections WNV may develop into a neuroinvasive disease with acute meningitis and/or encephalitis [Reference Mackenzie, Gubler and Petersen4]. Severe illness with neurological disorders has been observed in about 10% of infected equines [Reference Petersen and Roehrig5]; while the lethality rate in this species may vary due to different lineages and strains of WNV [Reference Lanciotti6–Reference Venter and Swanepoel8]. Due to the potential severe implications for both human and animal health, the implementation of effective and appropriate WNV surveillance programmes in areas at risk of infection has become a subject of major public health concern.
WNV reappeared in Italy in summer 2008, after about 10 years of absence, when the disease was diagnosed in 273 equine premises in the north-eastern Italian regions of Veneto, Emilia Romagna and Lombardy [Reference Calistri9]; nine human infections were also detected in the same area [Reference Gobbi10–Reference Rossini12]. Following these first reports, starting in 2009, a structured national surveillance programme was implemented in the affected regions, consisting of strengthened active and passive surveillance on equines, wild birds and mosquitoes. A surveillance plan targeting West Nile neuroinvasive disease (WNND) in humans was introduced in 2010.
Since its reappearance, WNV spread widely to several Italian regions, affecting wild birds, equines and humans [Reference Busani13–Reference Monaco15]. Moreover, an increased number of WNV infections in humans were observed between 2011 and 2012, especially in the north-eastern Italian regions. This situation prompted a more focused surveillance plan for detection of WNV reactivation in the recurrently affected Italian regions.
Here we used a space–time approach to investigate the most affected areas in north-east Italy in 2010–2012, to detect if and where hotspots of WNV presence in humans, equines and mosquitoes were recurring. The resulting zones should represent the core area to actively search for early detection of WNV reactivation. Moreover, since active surveillance in equines is not considered highly cost-effective once WNV has become endemic [Reference Chevalier, Lecollinet and Durand16], the relationship between viral circulation in mosquitoes and the occurrence of WNV in humans was also investigated. The final aim of our analyses was to support the adjustment of the surveillance plan, in order to identify early the reactivation of WNV in the affected areas. This could be included in an early warning system to enhance the control of WNV, limit the disease spread to the human host and reduce costs.
MATERIALS AND METHODS
Data sources
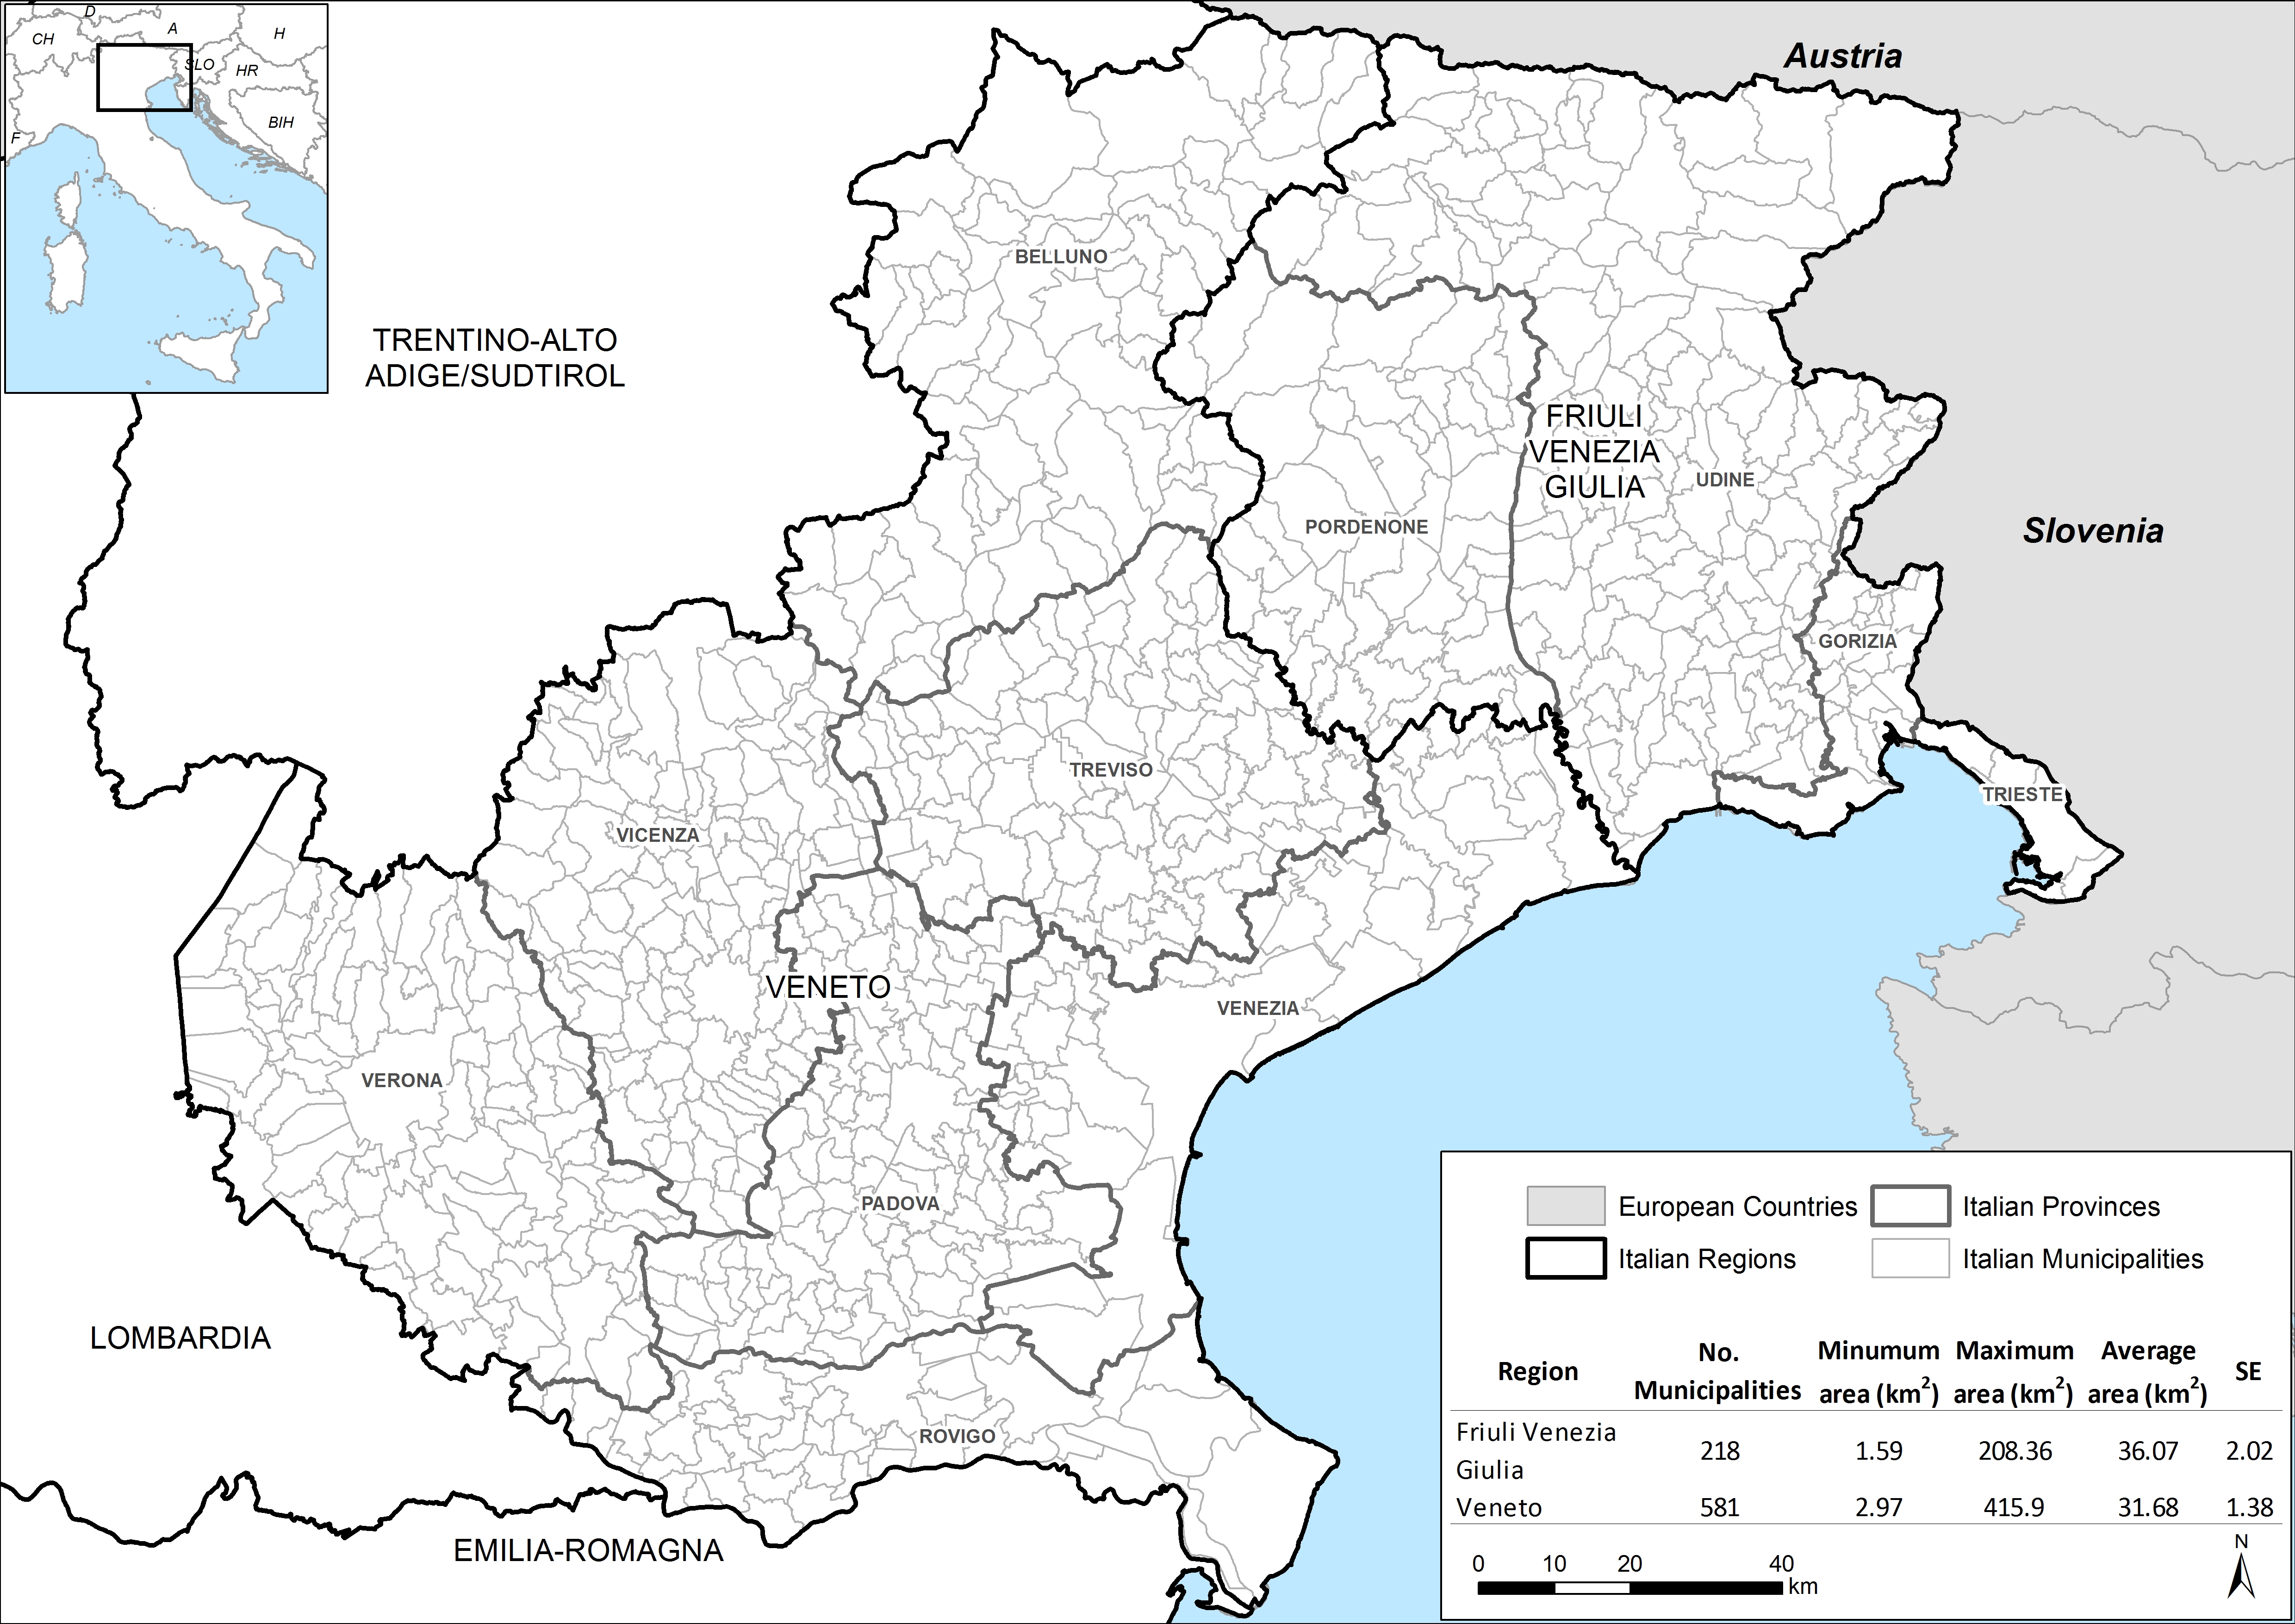
Information collected through the WNV surveillance plan, conducted in the regions of Veneto and Friuli Venezia Giulia (FVG) (Supplementary Fig. S1) was exploited in the analyses. The study period was limited to 2010–2012, as WNV was not found in mosquitoes previously.
Starting in 2009, the framework of the surveillance plan provided for the definition of two distinct areas: an area with WNV circulation (AWC), encompassing the municipalities where the virus was identified in the previous year; and an external surveillance area (SA), which included municipalities within 20 km of the AWC [Reference Busani13]. The SA was divided into area units (AUs) of about 1200–1600 km2, and WNV was actively searched for in 28 sentinel equines per AU by serological testing for anti-WNV IgG antibodies. Only residential equines, which were not tested in the previous year and were not vaccinated, were considered eligible as sentinel animals. Passive surveillance was still implemented in both the SA and the AWC, by testing all of the animals showing symptoms indicative of WNV infection. In 2011–2012, a new surveillance plan was implemented by the regional veterinary authorities in Veneto and FVG regions, north-eastern Italy [Reference Mulatti17]. Anti-WNV IgM antibodies were searched for in equine sera samples collected in the framework of national surveillance plans against other infectious diseases of equines (i.e. equine infectious anaemia). All of the premises in Veneto and FVG were subjected to surveillance; in each farm, only equines that were not moved during the last 3 months were eligible for sampling [Reference Mulatti17]. Equines were tested using a commercial IgM-capture ELISA; animals testing positive by ELISA were confirmed with virus neutralization (VN) and plaque reduction neutralization (PRN) tests [Reference Mulatti17].
Data derived from both active and passive surveillance were considered in the analyses. For each of the surveyed equine premises, the collected information included: univocal identification code, geographical location, and date and outcome of the serological tests or of appearance of WNV-related symptoms. Space–time analyses were performed at the farm level, and each equine premises was considered as positive for WNV if at least one animal tested positive for IgM antibodies for WNV at a given date.
Entomological surveillance activities consisted of one overnight sample using CDC CO2 traps every 15 days from the first week of May until two consecutive negative mosquito captures (usually occurring between the end of October and first week of November), which was assumed to indicate the end of the mosquito season. A variable number of capture sites located in the two regions were surveyed in 2010–2012. In 2010 data for 43 capture sites from Veneto only were available, as traps were not placed in FVG. In 2011 the surveillance was extended to FVG consistently increasing the number of traps up to a total of 62. The density of traps was again decreased to 39 in 2012, and concentrated in the area were WNV was most frequently observed in the previous year. Mosquitoes were counted, identified and pooled by species, date and site of collection (up to a maximum of 50 individuals per pool). Pools were examined by a One-Step SYBR Green-based reverse transcriptase real-time PCR (Qiagen, Germany) specific for flaviviruses [Reference Ravagnan18]. Positive results were confirmed by sequencing the conserved region of the non-structural NS5 gene. The mosquito dataset analysed included: date of trap positioning; number of captured mosquitoes; number of female Culex pipiens, which are considered to be the primary WNV vector in Italy [Reference Romi19]; and number of pools per capture testing positive for the presence of WNV lineages 1 or 2.
Information on the presence of WNV in humans was obtained from the public health authorities of the Veneto and FVG regions. Data collected included: municipality of residence (or the likely municipality of exposure, when available); date symptoms manifested or date of diagnosis and type of WNV infection, i.e. WNND, West Nile fever (WNF); or WNV in blood donors. As the geographical information was related to the municipality level (i.e. LAU 2), the centroids of the municipalities were used as a proxy of the geographical coordinates for observed WNV human cases. Since only information on the occurrence of WNV in humans was available, we created a set of pseudo-negative observations 3–10 times greater than the number of positive humans. The pseudo-negatives were randomly generated by sampling with replacement the municipalities’ centroids within a definite radius, arbitrarily set at 35 km, from the observation. For each year of reference, the observation dates were randomly generated considering a temporal range starting from the beginning of the month in which the first WNV case in humans was observed to the end of the month when the last WNV human case occurred. The typologies of WNV infection were also randomly assigned to the pseudo-negatives. A Monte Carlo procedure was used in further analyses with 1000 reiterations, each time re-sampling the WNV pseudo-negative human population to assess whether the results of the analysis were significant or not.
Spatial analysis
Hotspots in the distribution of WNV-positive equines, mosquito traps and humans were investigated through the focused space–time scan statistic [Reference Kulldorff20]. A Bernoulli probability model was used to define the aggregation of WNV cases around focal points. The Bernoulli model allows consideration of two classes of observation: i.e. cases (WNV occurrence) and controls (WNV-negative equine premises and mosquito pools, and human pseudo-negatives) [Reference Kulldorff20]. The locations of trapping sites where at least one mosquito pool tested positive for the presence of WNV during the annual entomological surveillance were chosen as focal points in the analyses. In such a way, we aimed to identify significant space–time aggregations of WNV-positive equine premises, mosquito captures and human cases around sites where the presence of the virus was confirmed.
The model was allowed to run separately for each year and host type, in order to assess whether there were differences in the clustering level and in the location of the significant aggregations. The spatial scanning window was set to include up to 25% of the total population of equine premises tested each year, while for humans and mosquitoes the maximum population for inclusion in the spatial window was set to 50%, the default value for the software used. In all of the analyses the temporal scanning window was set to include up to 50% of the reference period for each year (i.e. 1 January–31 December). The statistical significance of the clusters was established using Monte Carlo hypothesis testing [Reference Dwass21], assuming that WNV cases were a random sample (both in space and in time) of the total tested population.
The scan statistic models were run on each of the 1000 simulated datasets containing WNV infections in humans and pseudo-negatives, obtaining the more likely clusters of observations for each of the iterations. The results were further processed to obtain a measure of overall local clustering of human cases per year. The mean centroids and radiuses of the overall hotspots were obtained by averaging the Cartesian coordinates and radiuses of the significant primary clusters detected in each iteration.
Statistical analysis
The data on the presence of WNV in humans were also used for further analyses, to detect any significant correlation between WNV circulation in mosquitoes and the occurrence of WNV infections in humans. WNV infections and pseudo-negatives generated for each year were merged into a single dataset, to cover the whole period of reference (2010–2012). A measure analogous to the vector index (VI), already used in early warning systems in the USA [Reference Jones22–Reference Kwan24], was developed by considering the virus circulation in mosquitoes within a defined radius from each single observation in humans, and within a certain time period before the observations in humans:
 $${\rm VI}_{idt} = \sum\limits_j {\bar N_{\,jt} \hat P_{\,jt} I_d (d_{ij} )}, $$
where i is the observation (either a positive or a pseudo-negative); d is a distance threshold; t is the period of reference; $\bar N_{jt} $
is the average mosquito density at a single capture site j in the period of reference t prior to observation i;
$\bar N_{jt} $
is the average mosquito density at a single capture site j in the period of reference t prior to observation i; $\hat P$
jt
is the estimated mosquito infection rate at a single capture site j in the period of reference t prior to observation i; and I
d
(d
ij
) is a variable taking a value of 1 when the capture site j is within distance d from observation I, and 0 otherwise. Therefore, we aimed to measure the virus activity in mosquitoes within both increasing radiuses and temporal period prior to the occurrence of WNV infection in humans. We considered distance thresholds (d) varying between 5000 and 35 000 m (with a step of 5000 m), and mosquito captures obtained within 7, 15, 30 and 45 days prior to the observations in humans. A set of 29 different logistic mixed models were created by considering a null-hypothesis model, which included only a temporal variable (date of finding) as predictor, and alternatively the various values of VI
idt
taken individually as independent variables. The models were compared with each other through Akaike's Information Criterion weights (wAICc), which can be considered as expressing the probability that a model is the most likely [Reference Burnham and Anderson25]. A total of 1000 iterations were performed, each time randomly selecting pseudo-negatives. The mean wAICc observed for each model in the iterations was calculated as the overall measure of the quality of the models. The values obtained were then summed to obtain wAICc measures for models as they were performed, considering time periods or distance thresholds separately.
$\hat P$
jt
is the estimated mosquito infection rate at a single capture site j in the period of reference t prior to observation i; and I
d
(d
ij
) is a variable taking a value of 1 when the capture site j is within distance d from observation I, and 0 otherwise. Therefore, we aimed to measure the virus activity in mosquitoes within both increasing radiuses and temporal period prior to the occurrence of WNV infection in humans. We considered distance thresholds (d) varying between 5000 and 35 000 m (with a step of 5000 m), and mosquito captures obtained within 7, 15, 30 and 45 days prior to the observations in humans. A set of 29 different logistic mixed models were created by considering a null-hypothesis model, which included only a temporal variable (date of finding) as predictor, and alternatively the various values of VI
idt
taken individually as independent variables. The models were compared with each other through Akaike's Information Criterion weights (wAICc), which can be considered as expressing the probability that a model is the most likely [Reference Burnham and Anderson25]. A total of 1000 iterations were performed, each time randomly selecting pseudo-negatives. The mean wAICc observed for each model in the iterations was calculated as the overall measure of the quality of the models. The values obtained were then summed to obtain wAICc measures for models as they were performed, considering time periods or distance thresholds separately.
RESULTS
Presence of WNV in Veneto and FVG
Results of the surveillance activities conducted on equines in the study period are illustrated in Table 1. In 2010 the serological surveillance plan in sentinel equines did not detect any infected farms; four syndromic equines were identified through passive surveillance, three were in the AWC and one in the SA (Fig. 1 a). Data from 2011 to 2012 were far more numerous as animals were tested throughout the whole territory of Veneto and FVG. A total of 32 positive equine premises were found in Veneto (12/32, 37·5%) and FVG (20/32, 62·5%) in 2011, of these 11 (34·4%) were located in the AWC (Fig. 2 a). The number of probable infections in equines detected in 2012 in Veneto and FVG was ten (55·6% of the total cases) and eight (44·4%), respectively; 16 (88·8%) of the total cases were located in the AWC (Fig. 3 a).

Fig. 1 [colour online]. Geographical location of the significant clusters of WNV cases in (a) equines, (b) mosquitoes, (c) humans, and (d) overlapping of the different clusters in 2010.

Fig. 2 [colour online]. Geographical location of the significant clusters of WNV cases in (a) equines, (b) mosquitoes, (c) humans, and (d) overlapping of the different clusters in 2011.

Fig. 3 [colour online]. Geographical location of the significant clusters of WNV cases in (a) equines, (b) mosquitoes, (c) humans, and (d) overlapping of the different clusters in 2012.
Table 1. Number of tested and positive equine premises during the 2010–2012 surveillance activities which are included in the analyses

CI, Confidence interval.
* Only data for the Veneto region were available.
† Only syndromic equines were detected in 2010.
Table 2 reports the outcome of WNV surveillance on mosquitoes. In 2010 WNV was identified in mosquitoes for the first time in Veneto. Ten pools collected at four different capture sites tested positive for the presence of the virus, three were located in the south-western part of Veneto, while one was in the eastern areas near the border with FVG (Fig. 1 b). In 2011 the number of positive pools detected decreased to five, collected at five different capture sites (two in Veneto, three in FVG) (Fig. 2 b). Two of the positive pools led to the identification of WNV lineage 2 [Reference Mulatti17], representing one of the first occasions this lineage had been detected in Italy [Reference Savini14]. Thirteen mosquito pools tested positive in 2012, and the pooled mosquitoes were collected from six mosquito traps (five in Veneto, one in FVG) (Fig. 3 b). One of the pools, collected in the south-western part of Veneto, tested positive for WNV lineage 2 [Reference Capelli26].
Table 2. Results of the 2010–2012 WNV entomological surveillance

* Only data for the Veneto region were available.
Cases in humans have been identified in Veneto since 2008, although their occurrence has increased since 2010. In particular a total of 28 human cases of WNND were identified in 2012 in Italy, of which 25 (89·3%) were detected in Veneto (21/28, 75%) and FVG (4/28, 14·3%). Additional active circulation of WNV was observed in Veneto, in 17 WNF human cases and in seven blood donors (Table 3).
Table 3. Number of WNV infections in humans in 2010–2012

* Including 17 cases of West Nile fever and seven detected in blood donors.
Identification of space–time hotspots for WNV occurrence in equines, humans and mosquitoes
Space–time analysis performed on data related to WNV infections in equine premises in 2010 allowed identification of a single significant cluster (P = 0·013), located in the eastern part of the Veneto region (Fig. 1 a). Regarding the entomological surveillance data, out of the ten total positive mosquito pools observed in 2010, four derived from trapping activities performed at a single capture site. The single significant hotspot for WNV-positive mosquito pools was represented by this series of positive findings at a unique site (P < 0·001); therefore, this resulted in the spatial window having radius of zero (Fig. 1 b). Out of the total 1000 iterations for the space–time scan statistic on human data, only 507 (50·7%) led to the detection of single significant clusters, all of which had the same spatial and temporal characteristics (Fig. 1 c). The focal point for the spatial windows identified in the three analyses resulted from the same mosquito trap (Fig. 1 d), and the temporal windows partially overlapped. The characteristics of the clusters detected for the 2010 data are reported in Table 4.
Table 4. Significant clusters of WNV infections in equines and humans, and of WNV-positive mosquito pools in 2010

* The values reported for humans represent the average characteristics of the significant clusters detected in the iterations.
Space–time analyses on data collected for 2011 were performed in two steps, by alternately considering mosquito traps where WNV lineages 1 or 2 were identified as the focal point. The analyses performed on data from the regional surveillance plan in 2011 on equines led to the detection of two significant space–time clusters (Table 5). The primary significant cluster (P < 0·001) was located on the border between Veneto and FVG and was focused around a trap which tested positive for the presence of WNV lineage 1 (Fig. 2 a). The second cluster was located eastwards in FVG near to the border with Slovenia, and its focal point was a trap positive for WNV lineage 2 (Fig. 2 a). Similarly, two clusters were detected for WNV-positive mosquito pools, one each for WNV lineage 1 (P = 0·0057) and lineage 2 (P = 0·014) (Table 5, Fig. 2 b). A total of 824 (82·4%) of the iterations of the analyses on the WNV human positives and pseudo-negatives detected significant clusters for 2011. The average spatial window was located slightly westwards with respect to the primary cluster of WNV-positive equine and mosquito pool hotspots, although widely overlapping with these (Table 5, Fig. 2 c, d). The focused hotspots of positive mosquito pools and equines resulted from sharing the same focal point, i.e. the trap located on the border between Veneto and FVG (Fig. 2 d).
Table 5. Significant clusters of WNV infections in equines and humans, and of WNV-positive mosquito pools in 2011

* The values reported for humans represent the average characteristics of the significant clusters detected in the iterations.
The significant focused equine hotspot detected for 2012 had its focal point in a trap located in the south-eastern part of Veneto (P < 0·001) (Table 6, Fig. 3 a). Moreover, the positive mosquito pools aggregated in a single significant focused cluster (Table 6), with the same focal point as the hotspots of WNV-infected equines (Fig. 3 b). All of positive mosquito pools deriving from the clustered traps tested positive for the presence of WNV lineage 1. The single trap not included in the cluster was located in the south-western part of Veneto, where WNV lineage 2 was identified. All of the simulations with WNV infections in humans led to the identification of significant clusters (Fig. 3 c). The equine and mosquito clusters were almost identical in spatial extent and largely overlapping in their temporal scale; both were broadly overlapping regarding the spatial and temporal extent of the overall measure of positive human aggregation (Fig. 3 d).
Table 6. Significant clusters of WNV infections in equines and humans, and of WNV-positive mosquito pools in 2012

* The values reported for humans represent the average characteristics of the significant clusters detected in the iterations.
Relationship between WNV activity in mosquitoes and occurrence of WNV human cases
The mean wAICc obtained for each category of model in the 1000 iterations is graphically reported in Figure 4. The model with the highest overall statistical support was obtained when considering a measure of virus circulation observed within 15 days before the occurrence of WNV in humans, in the mosquito population located within 30 km of the human WNV cases (wAICc = 0·282). Nevertheless, the wAICc was extremely low and was similar to that observed for the model within 30 days and 30 km (wAICc = 0·232); therefore, the overall statistical support was not enough to define a single best model that could allow making sound inferences on the dependence between WNV human cases and the identification of positive mosquito pools in the considered time-frame and area. Nevertheless, when considering the distance thresholds within which VI idt was calculated, the statistical support of models built considering the mosquito population within 30 km from a ‘human observation’ considerably increased (wAICc = 0·525) (Fig. 5 a), although it was not sufficiently high to infer any reliable prediction. The cumulative wAICc accounting for different time periods showed that models with the VI idt calculated within 15 and 30 days produced similar results (wAICc = 0·518 and 0·452, respectively, for 15 and 30 days) (Fig. 5 b). This indicates the great difficulty in discerning the most likely model that describes the correlation between the circulation of WNV in mosquitoes and in humans.

Fig. 4. Average Akaike's Information Criterion weights (wAICc) for the mixed-effects models to define the relationship between the circulation of WNV in mosquitoes and WNV occurrence in humans.

Fig. 5. Cumulative Akaike's Information Criterion weights (wAICc) for the mixed-effects models. (a) models grouped by time period; (b) models grouped by distance thresholds.
DISCUSSION
Recent studies and reviews suggest several possible approaches for optimizing surveillance activities of WNV and vector-borne diseases in general [Reference Kalluri27, Reference Moore28]; most of these methods rely on satellite imagery and recording of climatic variables to assess whether the risk of disease reactivation and circulation is increasing in an area or not. However, these approaches also require a thorough knowledge of the ecology of both the aetiological agents and the vectors, which can be difficult to obtain for WNV in several countries, including Italy. In fact, knowledge of the dynamics of the WNV vector populations in Italy is not expansive, neither are studies on the interactions between virus and mosquitoes and how WNV responds to climatic variations in a temperate environment. Therefore, until a more exhaustive knowledge becomes available, any fine-tuning of WNV surveillance plans has to rely on other methods.
The increased occurrence of human WNV cases in 2010–2012 prompted us to focus on the better detection of WNV reactivation in areas where the virus is known to be present. This could be a first step towards the drafting of an early warning plan, allowing quick implementation of measures to limit the risk of WNV spread to humans, through both direct intervention and communication to the population exposed to the risk. Our study focused on the 2010–2012 period, when WNV presence was observed in equines, mosquitoes and humans concurrently, in order to identify areas where virus occurrences were clustered in the three hosts. The areas exposed to the greater risk of virus reactivation were assumed to be where the hotspots of WNV cases in humans, equines and mosquitoes were overlapping, as this indicates that the virus is likely to have been simultaneously circulating in the three hosts. The space–time analyses of the 2011 surveillance data on equine premises allowed the detection of two clusters, focused around a trap positive for WNV lineage 1 and a capture site where WNV lineage 2 was identified. The results lead to interesting speculation on the diffusion of the different lineages in the area, although the lack of further details on WNV lineage for equines does not allow making of reliable inferences on the two different clusters.
The level of overlap in the temporal windows between the space–time clusters observed in the three hosts each year led us to hypothesize a similar possible source of infection for humans and equines. In fact, the differences between windows are compatible with the development of disease in humans and the appearance of IgM antibodies in equines [Reference Ostlund, Andresen and Andresen29–Reference Petersen, Brault and Nasci31].
The large temporal window ranges for human clusters in 2012 (Table 6) is probably related to the inclusion of different types of WNV human infections. In fact, WNND and WNF manifest with different symptoms and gravity, therefore leading to differences in the notification of the disease; furthermore, WNV-positive blood donors are found incidentally during routine screening in blood donor programmes and therefore may not be easily traced back to the time and place of infection.
Overall, the area most consistently associated with the presence of WNV cases in hosts and vectors coincided with a relatively limited zone located between the Veneto and FVG regions. Regarding most of the lowlands in Veneto and FVG, this area is characterized by the presence of fields and other agricultural lands both permanently irrigated and non-irrigated [32], which could represent an optimal habitat and breeding sites for C. pipiens [Reference Vinogradova and Shaikevich33, Reference Clements34]. Recent studies focusing on WNV vectors' ecological niche in Italy indicated that the north-eastern regions are suitable for C. pipiens, although the species is present in many Italian regions [Reference Mughini-Grass35]. The clustering of WNV infections in humans and equines, and the increasing occurrence of the virus in mosquito pools in the study area, suggests that there could be factors influencing the behaviour of WNV and its interactions with its vector species, other than the ecological drivers of mosquito populations [Reference Mulatti36]. Further analyses are therefore needed to investigate which ecological factors make north-eastern Italian regions particularly suitable for the spread of WNV. One of the possible reasons for the frequent occurrence of WNV infections in the area may be related to the regions being located on migratory paths, which may allow the cyclic introduction of new WNV strains, and their spread to the local reservoir host population due to the presence of large populations of suitable vectors [Reference Owen37, Reference Durand38].
Our further analyses, aiming to identify the relationships between the circulation of WNV in mosquitoes and the occurrence of WNV human cases, did not allow reliable inferences to be made on which temporal and spatial scales the presence of virus in mosquitoes may be considered as a predictor of increased risk of spreading to humans. However, our results showed that a relationship between the VI and human WNV cases exists, and could be exploited in future surveillance plans. Nevertheless, the entomological surveillance in 2010–2012 was based on bi-weekly captures performed at traps that were about 13 km distant on average. A more dense presence of traps and a higher frequency of mosquito captures could lead to a better identification of the relationship between circulation of the virus in mosquitoes and human cases. At present, the area identified through overlapping of the spatial window of WNV hotspots has been selected for improving entomological surveillance activities, by positioning mosquito traps at a higher density and collecting vectors with greater frequency. This is expected to provide more detailed information on where WNV circulates in mosquito populations, and when the virus circulation reactivates. Nevertheless detailed information on human occurrence is paramount. In fact, the perceived incidence is largely underestimated [Reference Petersen, Brault and Nasci31], due to the limited symptoms usually related to WNV in humans. At present, monitoring plans in humans have been activated, targeting unusually high occurrences of atypical febrile episodes in summer, including the large-scale screening of blood donors [Reference Gobbi39]. However, these plans could be improved, e.g. through information and awareness campaigns, providing knowledge to better understand the dynamics of WNV.
SUPPLEMENTARY MATERIAL
For supplementary material accompanying this paper visit http://dx.doi.org/10.1017/S0950268814000442.
ACKNOWLEDGEMENTS
The research was funded by the Regional Prevention Plan entitled ‘Surveillance of vector-borne zoonoses and evaluation of the risk of disease spread in Veneto Region’ (Regional Committee resolution no. 1519/2012), and by the Collaboration Agreement between IZSVe and the autonomous region of Friuli Venezia Giulia on ‘Epidemiological surveillance plans in veterinary public health’. The authors thank Francesca Russo (Direzione Prevenzione, Servizio promozione e sviluppo Igiene e Sanità Pubblica, Veneto region) and Manlio Palei (Direzione Centrale Salute, Integrazione Sociosanitaria e Politiche Sociali – Servizio Sicurezza Alimentare, Igiene della Nutrizione e Sanità Pubblica Veterinaria; Friuli Venezia Giulia region) for providing detailed data on WNV circulation in humans in Veneto and FVG, respectively. The authors also thank Laura Gagliazzo and Tommaso Patregnani (Istituto Zooprofilattico Sperimentale delle Venezie) for help in managing and extracting the data analysed in this study.
DECLARATION OF INTEREST
None.