


Over past decades the prevalence of overweight and obesity in children and adolescents in the Netherlands has increased( Reference Schonbeck, Talma and van Dommelen 1 ). The school environment can be an important setting for the prevention of overweight and obesity in children and adolescents because the food environment at schools can directly influence their dietary and physical activity behaviour( Reference Brown and Summerbell 2 ). In addition, attention for nutrition and physical activity in the school curriculum may also contribute to the prevention of overweight in this age group.
During the 2006/2007 school year a national survey on school environment, school policy and actions regarding the prevention of overweight at Dutch secondary schools was performed( Reference Scholtens, Middelbeek and Rutz 3 ). This showed that less healthy foods and drinks were widely available, that about half of the schools considered themselves to be (co)responsible for the prevention of overweight and that a majority of schools took one or more actions aimed at the prevention of overweight.
In recent years, preventing obesity among children has been a policy priority in the Netherlands, both at the national and local level( Reference Renders, Halberstadt and Frenkel 4 ). Obesity policies do not include obligatory regulations or legislation, but mainly consist of self-regulation and projects and campaigns e.g. by national and local health-promoting institutes. It is of interest to investigate whether the initiatives and policy measures in recent years have led to improvements in the school environment. The above-mentioned national survey has been repeated in 2010/2011, yielding this opportunity. An extensive overview of the changes in the school environment between 2006/2007 and 2010/2011 has been published elsewhere( Reference Mikolajczak, van den Berg and Bemelmans 5 , Reference van den Berg, Mikolajczak and Bemelmans 6 ). In brief, this showed that there were positive developments with respect to the food supply at schools and an increase in the availability of physical activity facilities. In addition, more schools indicated that they participate in projects to prevent overweight. A lower percentage of schools indicated that they expect to pay more attention to overweight prevention in the future, but none of the schools indicated that they expected to pay less attention to overweight prevention in the future.
One of the aims of the Dutch government is to realize healthy school canteens in all schools by 2015. An important programme in this field is the ‘Healthy School Canteen Program’. This national programme, coordinated by the Netherlands Nutrition Centre, encourages secondary schools to set up their canteen in a way that promotes healthy eating( Reference Mensink, Schwinghammer and Smeets 7 ). The pilot phase of the programme started in 2002; in the 2006/2007 survey 11 % of schools indicated to have used the programme in recent years( Reference Mikolajczak, van den Berg and Bemelmans 5 ). The programme is aimed at improvements in the selection of foods offered by the school canteen. In addition, it encourages schools to embed education on healthy nutrition in the school curriculum and to develop a policy on healthy nutrition.
In the present study, we focus on the differences in the food supply and actions taken to prevent overweight between schools that did or did not participate in the Healthy School Canteen Program using data from the 2010/2011 survey. In the period under investigation, the Healthy School Canteen Program consisted of the availability of supporting materials through the Netherlands Nutrition Centre website, a competition to motivate schools to enrol in the programme and assistance in applying the programme upon request (all available without payment).
The first aim of the present study is to identify potential determinants of participation in the Healthy School Canteen Program for schools. The second aim is to compare food supply, actions taken to improve the food and physical activity environment, and the attention paid to nutrition, physical activity and overweight inside and outside the regular curriculum, between participating and non-participating schools. The third aim is to identify what reasons schools have to increase attention for nutrition in the school curriculum.
Methods
Study design
The study was performed within the scope of a national survey on the current nutritional and physical environment at Dutch secondary schools. In the Netherlands students usually start secondary school at 12 years of age. Depending on the level, the secondary school period lasts for 4, 5 or 6 years.
A postal questionnaire was sent to all secondary schools in the Netherlands (n 1145) in January 2011. A second mailing was performed in March 2011 to schools that had not responded so far. In this second mailing a non-response card was enclosed. The mailings were addressed to the school principal.
The survey methodology is described in more detail elsewhere( Reference Scholtens, Middelbeek and Rutz 3 , Reference Mikolajczak, van den Berg and Bemelmans 5 ). For the present study, no ethical approval was necessary according to the Dutch Central Committee on Research involving Human Subjects (http://www.ccmo.nl) because the questionnaires were not directed at children, no direct health-related questions had to be answered and no medical investigations were included.
Study population
The total response to the full questionnaire was 33 % (375 of 1145). In addition, 10 % of schools (n 115) returned a non-response card. Data of four schools were excluded from the analyses, because they did not offer secondary education or only special or individual education. Data of forty-six schools were excluded because they did not have a canteen or only a canteen where no food is offered. Thus, data of 325 schools were included in the analyses.
Questionnaire and non-response card
The questionnaire was addressed primarily at the school principal, but he/she was requested to consult other persons, e.g. teachers or canteen managers, if deemed necessary to answer one or more questions. At 39 % of responding schools, the questionnaire was completed by one person, mostly the principal or a deputy principal. At 61 % of schools other staff was consulted (up to six persons), mostly teachers (biology, personal care and/or physical exercise teachers) and canteen/facility managers.
The questionnaire consisted of 102 questions divided in six parts on general characteristics, the school environment (including questions on the canteen and vending machines), health education (including questions on the curriculum), participation in projects, school policy and closing questions, e.g. on the professional function of the person(s) that filled out the questionnaire. The non-response card asked for the reason schools had for not completing the questionnaire (with three potential reasons or other/unknown; see below) and contained seven questions of the full questionnaire. The main reason for non-response was that schools are confronted with many requests for participation in a study (55 %), 33 % of schools indicated as the reason for non-response that the questionnaire takes too much time to complete, 3 % that they were not interested in the subject and 10 % indicated no reason/other reasons.
Participation in the Healthy School Canteen Program
Participation in the programme was queried in two different questions (one on participation in national projects and one on actions taken). One question regarded the participation in five specific national projects (including the Healthy School Canteen Program) in the past 4 years (and respondents could note participation in ‘other projects’). In addition, participation in the programme was included as one of twenty-four possible specific actions to promote healthy eating behaviour that were queried (see below). The latter question did not refer to a specific time frame. All schools that indicated on either one of these items that they (had) participated in the programme were classified as participant. Fifty-seven schools indicated participation in the programme in both questions, thirty-five schools only in the question about national projects and thirteen schools only in the question on actions taken.
Potential determinants of participation in the Healthy School Canteen Program
Potential correlates of participation in the Healthy School Canteen Program that were investigated were school level and size, management of the canteen (internally by the school or by a caterer) and perceptions on overweight (see Table 1). In addition, we investigated whether participating and non-participating schools reported different barriers for participating in national projects (including the Healthy School Canteen Program) and/or reported different needs regarding projects (in general). The question on barriers included six potential barriers (lack of time; lack of knowledge/skills of teachers; lack of financial resources; lack of support from other organisations; lack of suitable materials; lack of appropriate facilities) and/or respondents could note one other barrier. The question on needs included eight answering categories (more information regarding project quality; support with project implementation; less intensive projects; projects that require less effort from teachers; projects that are better geared to the students’ environment; projects that are better attuned to the regular curriculum; an up-to-date overview offered (e.g. website); a instructions manual such as the ‘Healthy School Manual’) and/or respondents could note one other need.
Table 1 Potential determinants of participation in the Healthy School Canteen Program and barriers and needs regarding participation in projects *
* Barriers and needs regarding projects on nutrition, overweight and/or physical activity in general.
†Vocational education = schools offering ‘preparatory vocational education’, higher education = ‘senior general education’ and/or ‘university preparatory education’, mixed = offering both types of education.
‡Variables with lower n due to missing values.
§Seven specific barriers were inquired and ‘other’.
∥Eight specific needs were inquired and ‘other’.
Food supply
For the canteen the availability of eleven specific types of ‘healthy’ and eleven types of ‘less healthy’ foods was investigated through pre-coded questions. Respondents could mark whether a particular food item was sold at their school. For the drinks vending machines this was done for four types of ‘healthy’ and four types of ‘less healthy’ drinks.
In addition, the availability of vending machines for candy and for fresh products (e.g. sandwiches, fruit, milk and salad) and of water coolers was investigated, but the content of these machines was not queried.
Since foods can be sold through the canteen and through vending machines, for some foods we composed a combined exposure measure, indicating whether or not they were available at school through any selling point (sugar-sweetened soft drinks, light soft drinks, (butter)milk and spring water). For candy bars, sweets and crisps, exposure via the canteen and/or vending machines were combined, assuming that a vending machine for candy would at least contain one type of choice for any of these items.
Actions for the prevention of overweight
We assessed three actions specific for the canteen (see Table 3) and twenty-four general actions to promote healthy eating behaviour, eight general actions to stimulate physical activity and four general actions regarding overweight. In addition, we investigated whether schools paid attention to nutrition, physical activity and/or overweight outside the regular curriculum in the past 4 years and whether they had a policy on healthy nutrition.
Changes in the curriculum
Biology and ‘personal care’ were regarded as the lessons within the regular curriculum that could involve attention for nutrition and/or overweight. Schools were asked to report for a typical second grade (13–14-year-old students) whether more, less or equal attention was paid to these topics in the past 4 years. If respondents indicated a change in attention the next (open) question was ‘Could you indicate the main reason for this shift in attention?’ Because – in the case of change – the vast majority reported an increased attention for these topics, we only analysed the reported reasons for increased attention. These were categorised by two researchers, independently of each other, as one of the following categories: (i) participation in project(s) or policy/interest of the school; (ii) eating behaviour/lifestyle of the students; (iii) overweight, e.g. because many of our students are overweight/because of rise in overweight, or respondents simply just answered ‘overweight’; (iv) issue of societal importance; (v) media attention; (vi) educational, e.g. new book/educational method; (vii) health of the students; (viii) and interest of students, teachers or parents.
Analyses
Differences between schools that did or did not participate in the Healthy School Canteen Program were compared using the χ 2 test or Wilcoxon–Mann–Whitney test. We evaluated whether it was necessary to adjust the analyses for school level and school size, but because these variables were not associated with participation, analyses were performed without this adjustment.
Comparisons were considered significant where P < 0·05. All analyses were conducted using the SAS statistical software package version 9·3.
Results
Potential determinants of participation in the Healthy School Canteen Program
In total, 32 % (105/325) of the schools participated in the Healthy School Canteen Program (Table 1). There was no significant difference in school level and size or management of the canteen (internally or by a caterer) between participants and non-participants. Neither were there differences in perceptions concerning overweight between respondents of participating and non-participating schools. There were no significant differences in needs regarding projects, but participants more often reported barriers for participation in (national) projects.
Food supply
In total, vending machines for candy, (soft) drinks and fresh products were present at 80 %, 90 % and 11 % of schools, respectively, and at 31 % of schools water coolers were present (Table 2). Vending machines for soft drinks and fresh products were present at a larger proportion of participating schools than non-participating schools.
Table 2 Food supply at schools that did or did not participate in the Healthy School Canteen Program
*Variables with lower n due to missing values.
†For these variables, the difference was tested using the Wilcoxon–Mann–Whitney test.
The respondents’ evaluation of the food supply in the canteen was somewhat more positive at participating schools than at non-participating schools. Schools that participated in the Healthy School Canteen Program offered significantly (P < 0·001) more of eleven inventoried healthy foods in the canteen than non-participants; median (range) for participants = 4 (3–6) and for non-participants = 3 (1–5). However, there was no significant difference in the number of less healthy products offered.
The twenty-two inventoried products were offered by 3–79 % of the schools (Fig. 1(a) and (b)). Regarding the healthy foods, seven out of eleven inventoried products were offered significantly more often by participants than by non-participants: sandwiches, (butter)milk, fresh fruit, light soft drinks, yoghurt, fresh fruit juice and salad. For the less healthy foods no significant differences were found.
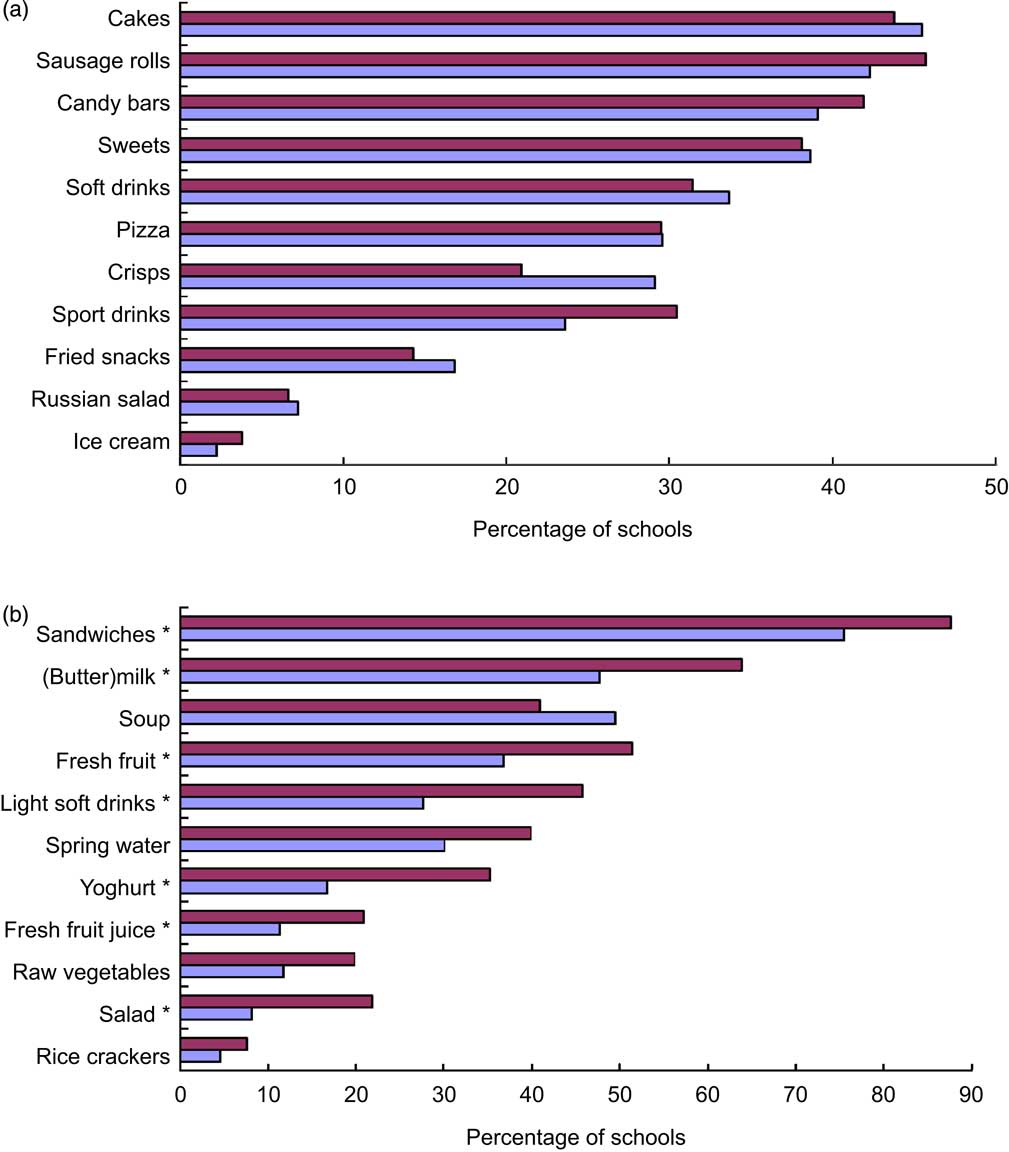
Fig. 1 (colour online) Availability of (a) ‘less healthy’ foods and (b) ‘healthy’ foods in canteens of Dutch secondary schools participating (![]() ; n 105) or not participating (
; n 105) or not participating (![]() ; n 220) in the Healthy School Canteen Program. *Significant difference (P < 0·05) between participating and non-participating schools
; n 220) in the Healthy School Canteen Program. *Significant difference (P < 0·05) between participating and non-participating schools
The results of the combined exposure via the canteen and/or vending machines were in agreement with those for the canteen(s) (Table 2).
Actions for the prevention of overweight
Participating schools more often took actions to improve the dietary behaviour of students than non-participating schools (Table 3). Most frequent actions in the canteen were promotions and special prices for healthy products (67 % of participating schools and 36 % of non-participating schools, P < 0·001 for difference), the use of an information system to indicate healthy and less healthy foods (36 % v. 17 %, P < 0·001), that the canteen offers a wide variety of healthy foods (50 % v. 38 %, P = 0·04) and that it is forbidden to sell certain unhealthy foods (73 % v. 53 %, P < 0·001). More general actions that were reported by more than 50 % of the schools were that the school attempts to offer a good balance in food and beverages and that it is forbidden to eat in the classroom.
Table 3 Actions taken for the prevention of overweight at schools that did or did not participate in the Healthy School Canteen Program
*Excluding 108 schools where this is not applicable because there is only a counter in the canteen and five schools due to missing values.
†Variables with lower n due to missing values.
‡Actions that were reported by 10 % of schools are listed; in total thirteen actions to stimulate consumption of healthy products and eleven actions to discourage consumption of unhealthy products, eight actions on physical activity and four actions on overweight were queried.
§Four other national projects were queried.
Participating schools more often had a written policy or oral agreements on nutrition than non-participating schools, and more often reported attention for nutrition or overweight outside the regular curriculum than non-participating schools. Participating schools also reported more often that they participated in other national, regional/local or own projects on nutrition, overweight or physical activity, and participating schools more often reported to have a ‘Healthy School Committee’ than non-participating schools.
Changes in the curriculum
In total 47 % of schools reported increased attention for nutrition in the regular curriculum in the past 4 years; 38 % during the biology classes and 32 % during the personal care classes. In addition, 35 % of the schools reported increased attention for overweight and 30 % for physical activity. Increased attention for all three topics was more frequently reported by schools participating in the Healthy School Canteen Program than by non-participating schools (Table 3).
Because the reported reasons for increased attention for nutrition were similar for participating and non-participating schools, results are presented for all schools that increased attention combined (n 154; Fig. 2). Schools reported up to three reasons for the increased attention in the curriculum (median = 1 reason). Only ten schools did not report a reason for the increased attention in the curriculum. The most frequently reported reasons for the increased attention for nutrition in the curriculum were media attention, the eating behaviour/lifestyle of students and ‘overweight’ in general.
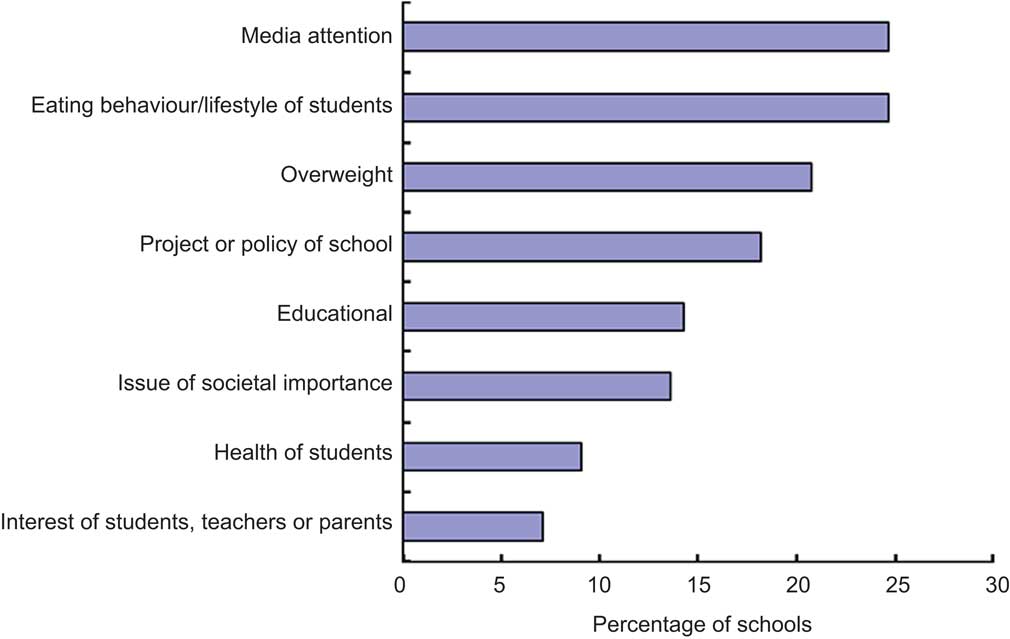
Fig. 2 (colour online) Reported reasons for increased attention for nutrition in the regular curriculum, for all schools that reported increased attention for nutrition (n 154), in the Healthy School Canteen Program. Schools reported up to three reasons for increased attention; ten schools did not report a reason
Discussion
In total, 32 % of the secondary schools with a canteen participated in the Healthy School Canteen Program. Participating schools seemed to offer more healthy products in the canteen than non-participating schools. However, at all schools less healthy products were also widely available. Participating schools more often reported that they took action to promote healthy dietary behaviour among students. It seems that the latter was not realised at the expense of measures aimed at physical activity or general measures to prevent overweight. On the contrary, participating schools more often reported that they took part in other projects on nutrition, physical activity and/or overweight. Continued media attention for the topic of overweight may contribute to the willingness of schools to take preventive measures.
None of the investigated potential determinants of participation (school level and size, management of the canteen and perceptions on overweight) was associated with participation in the Healthy School Canteen Program. In a previous study in the Netherlands, there appeared to be a relationship with the management of the canteen (by the school itself or by an external party)( Reference Mensink, Schwinghammer and Smeets 7 ). A higher proportion of schools with a canteen managed by the school itself indicated to have ‘an almost completely healthy offering’ in the canteen than of schools with an external caterer. However, we did not find a higher proportion of schools participating in the Healthy School Canteen Program among schools with an internally managed canteen compared with an externally managed canteen.
Respondents of participating schools more often reported barriers for participation in (national) projects than those of non-participating schools, especially lack of time and lack of financial means. This counterintuitive finding may be explained by the fact that participants had more opportunity to experience these barriers in practice.
These results should be interpreted in light of some limitations of our study. All data were obtained through self-report of the schools. Selective response may be an issue. Schools that are active in the field of nutrition/obesity may be more inclined to fill out an extensive questionnaire on these topics than schools that are less active. Thus, the percentage of schools participating in the programme (32 % of schools with a canteen and 29 % in the total sample) may be an overestimation. To evaluate the issue of selective response we compared schools that returned the full questionnaire with schools that returned only the non-response card. Although this comparison involved only a few questions and was limited by the response rate for the non-response card, this indeed indicated that there was selection bias. Respondents that returned the full questionnaire more often indicated that they noticed an increase in the percentage of students with overweight and reported more actions aimed at overweight and/or to discourage consumption of unhealthy foods than schools that only filled out the non-response card (results not shown). However, there was no difference in the percentage of schools with a ‘Healthy School Committee’.
In addition, the categorisation of schools as participants or non-participants may be subject to recall bias. In the questionnaire, participation in the programme was queried in two different questions (one on participation in national projects in the past 4 years and one on (current) actions taken). The agreement between these items was 85 %. The discrepancy between these items may be explained by the different time frame for the two questions, or because different people answered these questions (at 61 % of schools the questionnaire was completed by more than one person). In addition, recall of participation in the programme may also be linked to programme intensity (i.e. schools with a higher engagement in the programme being more likely to report participation).
Also food supply and actions taken by the schools were self-reported. This may be subject to recall bias and/or social desirability bias. We did not evaluate the exact content of the activities inside and outside the regular curriculum. Thus we could not assess whether the actions taken are sufficient to expect an impact on students’ behaviour.
Because of the observational and cross-sectional nature of our study, we do not know to what extent the differences between schools are due to participation in the Healthy School Canteen Program; i.e. we do not know whether the differences in food supply and actions taken already existed prior to participation in the programme and/or whether they are due to other factors. For a sub-sample of schools we also had data from the 2006/2007 survey( Reference Mikolajczak, van den Berg and Bemelmans 5 , Reference van den Berg, Mikolajczak and Bemelmans 6 ). We used these data to investigate whether differences in food supply existed prior to participation in the programme (results not shown). Schools that started participation in the programme between 2006/2007 and 2010/2011 (n 38) significantly more often offered three of the eleven healthy foods in 2010/2011 than schools that still did not participate (n 98): light soft drinks (50 % v. 27 %), salad (21 % v. 4 %) and yoghurt (32 % v. 14 %); whereas there were no significant differences in the availability of the eleven healthy and less healthy foods in 2006/2007. This makes it more plausible that the differences observed between participating and non-participating schools can be attributed to participation in the programme.
Participating schools also more often participated in other projects aimed at nutrition, physical activity or overweight in the past 4 years than non-participating schools, which may have contributed to the differences observed between participating and non-participating schools.
In the current study we investigated food supply and actions taken to improve dietary behaviour. Data on the actual dietary behaviour of students, and other measures such as the BMI of the students, were not available. Thus, we can only speculate on the effect of the differences observed between schools for the dietary behaviour and overweight among their students. Because school-based interventions are quite heterogeneous, it is difficult to generalise results across populations. In an international review study by Brown and Summerbell( Reference Brown and Summerbell 2 ), one of three included studies showed significant and positive differences between intervention and control groups for BMI.
In the Netherlands it is not common to provide full (hot) meals at school, and there is no national school meal programme. Most students bring a packed lunch (sandwiches) from home. In addition, at most schools students can buy some foods and drinks at a canteen (counter) and/or vending machines. Thus, the impact of the food supply at school on the dietary pattern of students may be less than in countries providing school meals. In a cross-sectional study among 1293 adolescents (aged 12–15 years) at secondary schools in the Netherlands, no association between the availability of soft drinks and snacks in the school canteen and consumption of these products was found( Reference van der Horst, Timperio and Crawford 8 ). Of several environmental factors studied, only the distance to the nearest store and the number of food stores were weakly inversely associated with soft drink consumption. For snack consumption no associations with environmental factors were found. However, individual cognitions such as the personal attitude and the modelling of friends appeared to be stronger correlates of intake than school-environmental factors( Reference van der Horst, Timperio and Crawford 8 ). One could argue that the increased attention for nutrition could influence such behavioural determinants. A few school interventions in the Netherlands reported modest but positive findings. For example, in a study at prevocational secondary schools, curriculum changes and environmental changes, including more physical exercise classes, were shown to contribute to positive changes in body composition and decreased consumption of sugar-containing beverages( Reference Singh, Chin and Brug 9 , Reference Singh, Chin and Brug 10 ). In another study in lower vocational schools, marginal positive effects on fruit intake of 12- to 14-year olds were found, and no effects on fruit juice, snack consumption and breakfast, as compared with control schools that had a regular curriculum( Reference Martens, Van Assema and Paulussen 11 ). In a study on vending machines, changes to the content and labelling and price reductions increased the students’ purchases of lower-energy foods( Reference Kocken, Eeuwijk and Van Kesteren 12 ). However, the sales of foods in the moderately unfavourable category were also higher at the experimental schools than at the control schools.
Whether the actions reported by the schools are sustainable depends on several factors, such as the motivations schools have for these actions. The most reported reasons to increase attention for nutrition in the curriculum were media attention and the (bad) eating habits of the students. It is noteworthy that no schools reported a potential effect on school performance, although this is often supposed to be a potentially important motivator for schools( Reference Ells, Hillier and Shucksmith 13 ). It is also more likely that actions become structural if a policy on healthy nutrition is developed. Participating schools more often had a policy on nutrition; however, even for these schools only 24 % had this stipulated in policy documents.
Continuing support, resources and (media) attention may also contribute to the willingness of schools to continue their efforts on the field of healthy nutrition and the prevention of overweight. Several policies and initiatives have started or continued in recent years that may contribute to a favourable climate in this respect. The goal of realising 100 % healthy school canteens by 2015 has been adopted within the ‘Dutch Covenant on Healthy Weight’. This agreement is signed by several actors from national and local government, industry and civil society organisations. An important initiative within this covenant is the ‘Manifest on Healthier Foods in Schools’, that was realised in 2011. In this manifest parties agree to work towards healthier food supply in schools with a goal of at least 75 % healthy foods according to the Dutch guidelines.
It is of interest to repeat the national survey on the school environment, policy and actions in a few years’ time in order to establish whether the differences between participating and non-participating schools are sustainable and how the school environment regarding overweight prevention develops in general. Preferably, more objective data on participation in the programme and food supply should be collected, as well as outcomes on the actual purchase/dietary behaviour and body composition of students.
Conclusion
In conclusion, participation in the Healthy School Canteen Program seems to make a positive contribution to the food supply at schools and to the efforts schools make for the prevention of overweight among students. Future research with an experimental design and including results on actual dietary and physical activity behaviour and anthropometric measures (e.g. BMI) of students is needed to confirm these results.
Acknowledgements
Sources of funding: The study was funded by the Dutch Ministry of Health, Welfare and Sports. The funder had no role in the design, analysis or writing of this article. Conflict of interest: The authors declare that they have no competing interests. Ethical approval: For this study, no ethical approval was necessary according to the Dutch Central Committee on Research involving Human Subjects (http://www.ccmo.nl) because the questionnaires were not directed at children, no direct health-related questions had to be answered and no medical investigations were included. Authors’ contributions: I.E.J.M. analysed the data and wrote the manuscript; J.M. and M.v.d.V.-v.H. collected data and performed preliminary data analyses; S.W.v.d.B. supported in the data analyses; J.M. and W.J.E.B. designed the study and compiled the questionnaire. All authors critically revised the manuscript and approved the final version.


