


Prolonged exercise induces physiological changes, especially in terms of muscle glycogen depletion( Reference Philp, Hargreaves and Baar 1 ) and the regulation of skeletal muscle protein synthesis( Reference Walker, Dickinson and Timmerman 2 , Reference Dreyer, Fujita and Cadenas 3 ). Studies of recovery after strenuous exercise have focused on the repletion of tissue carbohydrate and protein( Reference Walker, Dickinson and Timmerman 2 , Reference Zawadzki, Yaspelkis and Ivy 4 ).
Dietary carbohydrate is an effective source of tissue glycogen. Several studies( Reference Zawadzki, Yaspelkis and Ivy 4 , Reference Ivy, Goforth and Damon 5 ) have reported that consuming a combination of carbohydrates and proteins after exercise replenishes muscle glycogen more effectively than does consuming carbohydrates alone. Recent studies( Reference Armstrong, Bonavaud and Toole 6 – Reference Doi, Yamaoka and Nakayama 8 ) have demonstrated that amino acids, in particular branched-chain amino acids (BCAA), especially leucine, stimulate glycogen synthesis in skeletal muscle.
During exercise, muscle protein synthesis is inhibited. However, within the first hour following exercise, muscle protein synthesis is enhanced and the increase can persist for 24 to 48 h( Reference Walker, Dickinson and Timmerman 2 , Reference Dreyer, Fujita and Cadenas 3 ). In addition, previous studies have demonstrated that ingestion of a meal containing protein immediately following exercise stimulates protein synthesis in skeletal muscle( Reference Walker, Dickinson and Timmerman 2 ). In particular, leucine alone stimulates muscle protein synthesis to the same extent as complete protein or a complete mixture of amino acids( Reference Anthony, Anthony and Layman 9 , Reference Churchward-Venne, Burd and Mitchell 10 ). This effect is due to a dose-dependent activation of several factors involved in the initiation of mRNA translation, and is mediated primarily through the mammalian target of rapamycin (mTOR) signalling pathway( Reference Anthony, Anthony and Kimball 11 , Reference Anthony, Yoshizawa and Anthony 12 ). These studies have indicated that the effect of dietary protein on muscle protein synthesis is due to its leucine content( Reference Norton, Layman and Bunpo 13 ).
We have shown that not only the BCAA content but also the molecular forms of dietary protein are an effective factor after exercise( Reference Morifuji, Kanda and Koga 14 , Reference Kanda, Nakayama and Fukasawa 15 ). In this regard, enzymatically hydrolysed whey protein (whey protein hydrolysate (WPH)) is of particular interest. We have previously demonstrated that BCAA-containing peptides in WPH increase the rate of glucose uptake in vitro ( Reference Morifuji, Koga and Kawanaka 16 ). Ingestion of carbohydrate plus WPH increases glycogen content in the rat skeletal muscle in a 2 h period after exercise more than intact whey protein or BCAA( Reference Morifuji, Kanda and Koga 14 ). Furthermore, we have shown that ingestion of WPH causes a greater increase in muscle protein synthesis and phosphorylation levels of mTOR( Reference Kanda, Nakayama and Fukasawa 15 ). These results indicate that WPH is superior to amino acids in stimulating muscle glycogen synthesis and muscle protein synthesis.
Recently, Rowlands et al. ( Reference Rowlands, Thomson and Timmons 17 ) showed that post-exercise ingestion of whey protein differentially alters the portion of the transcriptome that is involved in tissue structure and remodelling, including production of the extracellular matrix, cytoskeleton and contractile proteins. However, there is only limited information on the differential effects of protein hydrolysates v. amino acids on post-exercise gene expression in skeletal muscle. Thus, the possibility exists that WPH has novel effects on gene expression. To test this hypothesis, we investigated the global effect of WPH on gene expression in skeletal muscle in comparison with an identical amino acid mixture (AAM).
Materials and methods
Animals
The animals used in the present study were the same as those used in our previous study( Reference Kanda, Nakayama and Fukasawa 15 ). Briefly, male Sprague–Dawley rats (5 weeks old) with a body weight of approximately 150 g (CLEA Japan, Inc.) were used. Rats were maintained at 23 ± 2°C, with lights on from 08.00 to 20.00 hours and off from 20.00 to 08.00 hours. Rats had free access to food (protein 23·6 %, fat 5·3 %, carbohydrate 54·4 %, ash 6·1 %, fibre 2·9 %, moisture 7·7 %, MF; Oriental Yeast Company Limited) and water. The present study was approved by the Animal Committee of Food Science Research Laboratory, Meiji Company Limited, and followed their guidelines for the care and use of animals.
Experimental protocol
A previously described experimental protocol was used( Reference Kanda, Nakayama and Fukasawa 15 ). Briefly, after 2 or 3 d of acclimatisation, rats were pre-trained to undergo swimming exercise for 3 d. On 1 d before the experiment, they were fed 5 g of a restricted diet (MF; Oriental Yeast Company Limited) to control food intake according to previous studies( Reference Morifuji, Kanda and Koga 14 , Reference Sonou, Higuchi and Terada 18 ). On the day of the experiment, rats swam for 2 h, with four rats swimming simultaneously in a barrel filled with water to a depth of 50 cm, allowing an average surface area of 400 cm2 for each animal. Rats started to swim between 10.00 and 12.00 hours. The water temperature was maintained at a constant of 35°C. Immediately following exercise, rats were given one of two isoenergetic test solutions by oral administration (n 8 per group). These solutions contained 44 kJ in a four-test dose that represented about 15 % of daily energy needs as determined previously, and included either a mixed meal containing carbohydrate and an AAM or a mixed meal containing carbohydrate and WPH (Meiji Company Limited). WPH used in the present study was a WPH generated by a protease from Bacillus sp. The WPH contained 21·6 mg/g of the following BCAA-containing bioactive peptides: Ile-Val; Leu-Val; Val-Leu; Ile-Ile; Ile-Leu; Leu-Ile; Leu-Leu( Reference Morifuji, Koga and Kawanaka 16 ). Each test solution was isoenergetic (1100 kJ/100 ml), and contained equal amounts of protein, with the protein content of these preparations being measured by the Kjeldahl method( Reference Kanda, Nakayama and Fukasawa 15 ). The average chain length of the peptides was calculated as the ratio of total N:amino N in the protein samples, which showed that WPH had an average peptide length of 3·64 residues. The composition of the AAM was equivalent to that of WPH, which was prepared by mixing pure crystalline l-amino acids and glycine (Wako Pure Chemical Industries)( Reference Kanda, Nakayama and Fukasawa 15 ).
Exactly 1 h after administration of the test solutions, rats were killed under diethyl ether anaesthesia, and the epitrochlearis and triceps muscles were excised. The epitrochlearis muscle was stored in RNAlater (Qiagen K.K.) at 4°C for 15 h and then at − 20°C until use. The triceps muscle was stored at − 80°C until further use.
Measurement of the fractional rates of protein synthesis
The experimental protocol was the same as described previously( Reference Kanda, Nakayama and Fukasawa 15 ). Briefly, 15 min before killing, a bolus dose (45 mg/kg body weight, 22·5 mg/ml) of 2H-labelled phenylalanine ([2H5]Phe; Cambridge Isotope Laboratories) was injected via the tail vein for the measurement of fractional rate of protein synthesis (FSR). At 15 min after the injection, the triceps muscle was excised and frozen rapidly. [2H5]Phe enrichment in plasma and hydrolysed muscle protein samples was determined using an LC/MS/MS system (TQD; Waters Corporation). FSR, defined as the percentage of tissue protein renewed each day, was calculated according to the formula:
 $$\begin{eqnarray} FSR = ( E _{b}\times 100)/( E _{a}\times t ), \end{eqnarray}$$
where t is the time interval between the injection and cooling of the tissue sample, expressed in d, and E b and E a are the enrichments of [2H5]Phe in the hydrolysed tissue protein and in muscle free amino acids, respectively.
Measurement of plasma insulin and amino acids
The experimental protocol was the same as described previously( Reference Kanda, Nakayama and Fukasawa 15 ). Briefly, plasma insulin was measured using a commercial ELISA kit (Mercodia AB). Plasma free amino acids were assessed by HPLC, with pre-column derivatisation by 6-aminoquinolyl-N-hydroxysuccinimidyl carbamate( Reference Morifuji, Ishizaka and Baba 19 ).
DNA microarray experiments
From each experimental group, four rats were selected according to the average FSR and subjected to DNA microarray analysis (Table 1). RNA was extracted from each epitrochlearis muscle using the Qiagen RNeasy Fibrous Tissue Mini Kit (Qiagen). The appropriateness of the quality and quantity of RNA samples was confirmed by the measurement of optical densities at 260 and 280 nm as well as by the observation of gel electrophoresis patterns obtained using a BioAnalyzer (Agilent Technologies). DNA microarray analysis was carried out as described previously( Reference Suyama, Okada and Ishijima 20 ). In brief, biotinylated antisense RNA was obtained from 100 ng of purified total RNA using a GeneChip 3′ IVT Express Kit (Affymetrix). The antisense RNA was purified, fragmented and then hybridised to an Affymetrix Rat Genome 230.2.0 Array containing probe sets for over 30 000 rat genes. Following hybridisation at 45°C for 16 h, the arrays were washed and labelled with phycoerythrin. Fluorescence signals were scanned using the Affymetrix GeneChip System. Affymetrix GeneChip Command Console software was used to convert the array images to the intensity of each probe (CEL files). All the microarray data are MIAME compliant and have been deposited in a MIAME compliant database, the National Center for Biotechnology Information (NCBI) Gene Expression Omnibus (http://www.ncbi.nlm.nih.gov/geo/,GEO_Series_accession_no.GSE49486), as detailed on the MGED Society website (http://www.mged.org/Workgroups/MIAME/miame.html).
Table 1 Fractional rate of protein synthesis (FSR) and plasma parameters (Mean values with their standard errors)
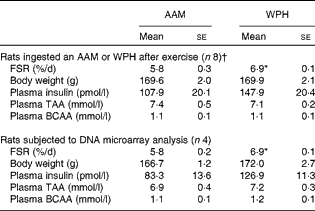
AAM, amino acid mixture; WPH, whey protein hydrolysate; TAA, total amino acids; BCAA, branched-chain amino acids.
* Mean value was significantly different from that of the AAM group (P< 0·05; Student's t test).
† These data are cited from our previous study( Reference Kanda, Nakayama and Fukasawa 15 ).
DNA microarray data analysis
CEL files were quantified with the distribution free weighted (DFW) method( Reference Chen, McGee and Liu 21 ) using statistical language R (http://www.r-project)( 22 ) and Bioconductor (http://www.bioconductor.org/)( Reference Gentleman, Carey and Bates 23 ). Principal component analysis( Reference Kachigan 24 ) was performed using the prcomp() function in R. To identify differentially expressed genes (DEG), the rank products method( Reference Breitling, Armengaud and Amtmann 25 ) was applied to DFW-quantified data, with the number of permutations set at 500. Probe sets with a false discovery rate < 0·05 were regarded as having different expression levels between the two groups (i.e. they were differently expressed). The annotation file for the Rat Genome 230.2.0 Array was downloaded from the Affymetrix web site (29 October 2012, Rat230_2.na33.annot.csv).
Gene-annotation enrichment analysis of DEG was performed using the Database for Annotation, Visualisation and Integrated Discovery (DAVID; http://david.abcc.ncifcrf.gov/)( Reference Huang da, Sherman and Lempicki 26 ) and Quick Gene Ontology (GO) (http://www.ebi.ac.uk/QuickGO/)( Reference Binns, Dimmer and Huntley 27 ).
EASE (Expression Analysis Systematic Explorer) scores, which are modified Fisher's exact test P values( Reference Hosack, Dennis and Sherman 28 ), were used to extract statistically over-represented GO terms from DEG. GO terms with P values < 0·01 were regarded as significantly enriched.
Analysis of gene networks
Gene networks from DEG were generated using Ingenuity Pathways Analysis (IPA; Ingenuity Systems, http://www.ingenuity.com). A gene network can be represented as a graph in which gene products are represented as nodes, and the biological relationship between two nodes is represented as an edge (line). All edges are supported by at least one reference from the literature, from a textbook or from canonical information stored in the Ingenuity Pathways Knowledge Base. The intensity of the node colour indicates the degree of up-regulation (red) or down-regulation (green). Nodes are displayed using various shapes that represent the functional class of the gene product. DEG have been overlaid onto these constructed networks to further understand specific interactions among genes of interest.
Prediction of upstream regulators and transcription factors from differentially expressed genes
Upstream regulators and transcription factors of DEG were predicted using IPA and TFactS (http://www.tfacts.org)( Reference Essaghir, Toffalini and Knoops 29 , Reference Notas, Alexaki and Kampa 30 ), respectively. IPA uses a right-tailed Fisher's exact test to calculate a P value, determining the probability that each upstream regulator assigned to the dataset occurred by chance. TFactS compares submitted gene lists with annotated target genes in the catalogue to detect regulated transcription factors.
Western blotting
Triceps muscle supernatants were subjected to Western blotting as described previously( Reference Morifuji, Kanda and Koga 31 ). Phosphorylation of extracellular signal-regulated kinase 1/2 (ERK1/2) at Thr202/Tyr204 was detected using rabbit anti-phospho-ERK1/2 (Thr202/Tyr204) (Cell Signaling Technology), and is expressed as a ratio to total ERK1/2 expression, determined using an anti-ERK1/2 antibody (Cell Signaling Technology). Hypoxia-inducible factor-1α (HIF-1α) was detected using a rabbit anti-HIF-1α antibody (Santa Cruz Biotechnology), and is expressed as the ratio of β-actin expression, determined using an anti-β-actin antibody (Cell Signaling Technology).
Statistical analysis
FSR and plasma parameters are expressed as means with their standard errors. Comparison of the data was carried out using Student's t test. Differences between the groups were considered to be statistically significant at P< 0·05.
Results
DNA microarray analysis of gene expression
DFW-quantified microarray data were subjected to principal component analysis. Each experimental group formed a distinct cluster (see online supplementary Fig. S1), which indicated that WPH induced changes in the gene expression profile in the rat epitrochlearis muscle compared with the AAM.
To identify DEG in response to the ingestion of WPH, the rank products method was applied to the DFW-quantified data. The rank products method combined with a DFW pre-processing algorithm has been shown to be one of the best ways to accurately detect DEG( Reference Kadota, Nakai and Shimizu 32 ). Applying a significance value of < 0·05 for the false discovery rate, we identified 161 up-regulated probe sets (134 genes) and seventy down-regulated probe sets (fifty-five genes) in the WPH group compared with the AAM group. The full list of DEG is shown in online supplementary Tables S2 and S3.
Gene Ontology analysis
DEG were classified into functional categories according to GO. GO terms that were significantly enriched within the two sets of DEG (up- and down-regulated genes) are summarised in Figs. 1(a) and 2(a), respectively. Because of the hierarchical structure of GO, the more specific categories appear deeper in the hierarchy. Therefore, categories at the lower end of the hierarchy represent the most important characteristics of DEG.
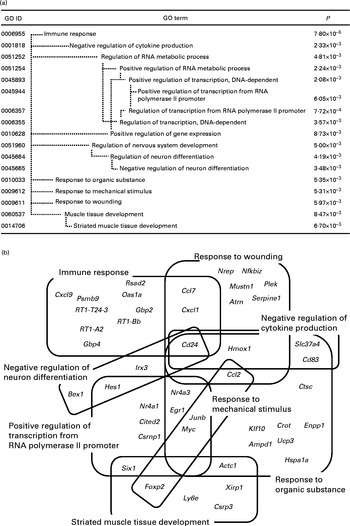
Fig. 1 Significantly enriched Gene Ontology (GO) terms (P< 0·01) found in the top 161 up-regulated genes in the whey protein hydrolysate (WPH) group (a). Venn and Euler diagrams represent the association of up-regulated genes with multiple GO terms caused by WPH (b). For full names of gene symbols, see online supplementary Table S1.
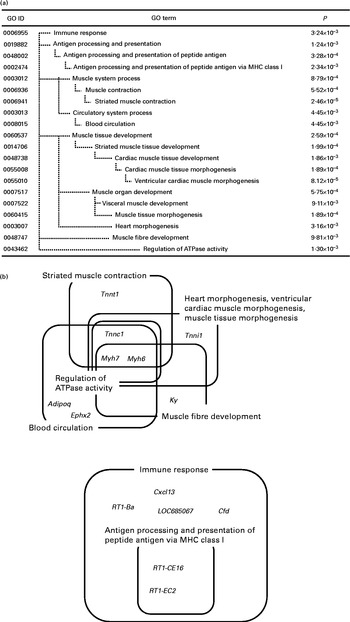
Fig. 2 Significantly enriched Gene Ontology (GO) terms (P< 0·01) found in the top seventy down-regulated genes in the whey protein hydrolysate (WPH) group (a). Venn and Euler diagrams represent the association of down-regulated genes with multiple GO terms caused by WPH (b). For full names of gene symbols, see online supplementary Table S2. MHC, major histocompatibility complex.
As shown in Fig. 1(a), the most specific (i.e. appearing in the deepest hierarchy) over-represented categories in the up-regulated genes were ‘immune response’, ‘negative regulation of cytokine production’, ‘positive regulation of transcription from RNA polymerase II promoter’, ‘negative regulation of neuron differentiation’, ‘response to organic substance’, ‘response to mechanical stimulus’, ‘response to wounding’ and ‘striated muscle tissue development’. A single gene is usually annotated with multiple GO terms. Therefore, these GO terms could include common DEG(s) each other. Using DAVID, we identified forty-five genes within these eight GO terms. To show the complex interdependencies of these GO terms sharing DEG, these genes and GO terms are summarised by Venn diagrams (Fig. 1(b)). It was shown that many GO terms included and shared genes involved in muscle repair. ‘Immune response’, ‘negative regulation of cytokine production’, ‘negative regulation of neuron differentiation’, ‘response to organic substance’ and ‘response to wounding’ included cluster of differentiation 24 (Cd24)( Reference Higuchi, Kawai and Kawajiri 33 ). ‘Immune response’ and ‘response to wounding’ included chemokine (C–C motif) ligand 7 (Ccl7) and chemokine (C–X–C motif) ligand 1 (Cxcl1)( Reference Lu, Huang and Ransohoff 34 , Reference Roseguini, Arce-Esquivel and Newcomer 35 ). ‘Response to organic substance’, ‘response to mechanical stimulus’ and ‘response to wounding’ included chemokine (C–C motif) ligand 2 (Ccl2)( Reference Lu, Huang and Ransohoff 34 ).
‘Positive regulation of transcription from RNA polymerase II promoter’ included some key elements in skeletal muscle development such as nuclear receptor subfamily 4, group A, member 3 (Nr4a3), early growth response 1 (Egr1), Jun B proto-oncogene (Junb), nuclear receptor subfamily 4, group A, member 1 (Nr4a1), Cbp/p300-interacting transactivator, with Glu/Asp-rich carboxy-terminal domain, 2 (Cited2), and SIX homeobox 1 (Six1). We have shown that WPH activates mTOR signalling( Reference Kanda, Nakayama and Fukasawa 15 ). In addition to translation initiation, mTOR regulates the function of transcription factors and gene expression( Reference Sengupta, Peterson and Sabatini 36 ). Therefore, these results are consistent with those of our previous study. Thus, we focused on these transcription-related genes for subsequent investigation.
In the down-regulated gene category, the most specific over-represented categories included ‘immune response’, ‘antigen processing and presentation of peptide antigen’, ‘striated muscle contraction’, ‘blood circulation’, ‘ventricular cardiac muscle morphogenesis’, ‘muscle tissue morphogenesis’, ‘heart morphogenesis’, ‘muscle fibre development’ and ‘regulation of ATPase activity’. We identified fourteen genes in nine GO terms enriched in the gene set down-regulated by WPH. These genes and GO terms are summarised by Venn diagrams (Fig. 2(b)).
Fig. 2(b) shows that these GO terms fell into two clusters: ‘regulation of ATPase activity’ and ‘immune response’. In particular, myosin, heavy chain 6 (Myh6) and myosin, heavy chain 7 (Myh7) are core elements that commonly appeared in the categories ‘striated muscle contraction’, ‘blood circulation’, ‘ventricular cardiac muscle morphogenesis’, ‘muscle tissue morphogenesis’, ‘heart morphogenesis’, ‘muscle fibre development’ and ‘regulation of ATPase activity’. Additionally, troponin C type 1 (Tnnc1) and troponin I type 1 (Tnni1) commonly appeared in the categories ‘ventricular cardiac muscle morphogenesis’, ‘muscle tissue morphogenesis’ and ‘heart morphogenesis’. All of these genes are involved in muscle contraction. Thus, we further investigated the network of muscle contraction-related genes.
Gene networks
DEG were mapped on gene networks comprising known molecular interaction, regulation and co-expression from the literature using IPA software. These networks in Figs. 3 and 4 visualised the relative magnitude and direction of gene expression changes specific to the present study.

Fig. 3 Analysis of an Ingenuity Pathways Analysis-generated gene network. The top functions of this network are cell cycle, cellular development and lipid metabolism. The intensity of the node colour indicates the degree of up-regulation (red) or down-regulation (green). Nodes are displayed using various shapes (![]() , enzyme;
, enzyme; ![]() , kinase;
, kinase; ![]() , ligand-dependent nuclear receptor;
, ligand-dependent nuclear receptor; ![]() , transcription regulator;
, transcription regulator; ![]() , transporter;
, transporter; ![]() , complex/group; ○, other) that represent the functional class of the gene product. Relationships:
, complex/group; ○, other) that represent the functional class of the gene product. Relationships: ![]() , direct interaction;
, direct interaction; ![]() , indirect interaction. For full names of gene symbols, see online supplementary Tables S1 and S2.
, indirect interaction. For full names of gene symbols, see online supplementary Tables S1 and S2.

Fig. 4 Analysis of an Ingenuity Pathways Analysis-generated gene network. The top functions of this network are organ morphology, skeletal and muscular system development and function, and CVD. The intensity of the node colour indicates the degree of up-regulation (red) or down-regulation (green). Nodes are displayed using various shapes that represent the functional class of the gene product. For a description of network shapes, see the legend of Fig. 3. For full names of gene symbols, see online supplementary Tables S1 and S2.
Fig. 3 shows the network associated with cellular development. This network includes key transcription factors in DEG such as Nr4a3, Nr4a1 and Egr1. Similarly, Fig. 4 shows the network associated with skeletal and muscular system development. Although Myh7, Tnnc1, Tnni1 and troponin T type 1 (Tnnt1) were down-regulated, interestingly, myosin, heavy chain 3 (Myh3), which is also involved in muscle contraction, was up-regulated.
Upstream regulators and transcription factors
To investigate the regulation of DEG, upstream regulators and transcription factors were predicted using IPA and TFactS, respectively. First, using IPA, we found that ERK1/2 regulated nine DEG (Table 2). Of the ERK1/2 target genes, Nr4a3, Egr1, ankyrin repeat domain 2 (stretch responsive muscle) (Ankrd2), Ccl7, Junb, myelocytomatosis oncogene (Myc) and serpin peptidase inhibitor, clade E (nexin, plasminogen activator inhibitor type 1), member 1 (Serpine1) were up-regulated. Nr4a3 and Junb are involved in the maintenance of muscle mass( Reference Pearen, Ryall and Maxwell 37 , Reference Raffaello, Milan and Masiero 38 ). Egr1 is a potential mediator of mitochondrial biogenesis( Reference Irrcher and Hood 39 ). Ankrd2 is involved in the expression of genes such as titin (Ttn), cysteine- and glycine-rich protein 3 (Csrp3), and myogenic differentiation 1 (Myod1)( Reference Barash, Bang and Mathew 40 ). The Myc protein network modulates the transcription of genes associated with glucose and energy metabolism( Reference Gohil and Brooks 41 ). Serpine1 regulates fibrinolysis and proteolysis( Reference Lijnen 42 ). In contrast, adiponectin, C1Q and collagen domain containing (Adipoq) and cyclin-dependent kinase inhibitor 1A (Cdkn1a) were down-regulated. Adipoq selectively inhibits the ERK1/2 pathway( Reference Motobayashi, Izawa-Ishizawa and Ishizawa 43 ). Cdkn1a has been considered as an effector of anti-apoptotic processes( Reference Ishido, Kami and Masuhara 44 ).
Table 2 Extracellular signal-regulated kinase 1/2 (ERK1/2) and hypoxia-inducible factor-1α (HIF-1α) target genes that showed altered expression due to the administration of whey protein hydrolysate compared with amino acids
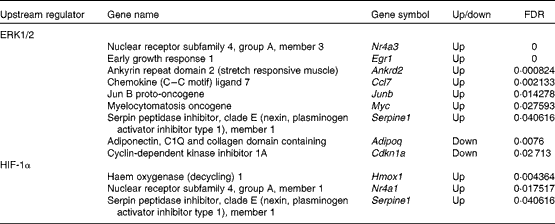
FDR, false discovery rate.
Second, using TFactS, we found that HIF-1α regulated three DEG (Table 2). All of the HIF-1α target genes (Nr4a1, Serpine1 and haem oxygenase (decycling) 1 (Hmox1)) were up-regulated. Nr4a1 is thought to be involved in the utilisation of glucose and fatty acids( Reference Kawasaki, Hokari and Sasaki 45 ). Hmox1 is normally expressed at very low levels, but increased greatly after exhaustive exercise( Reference Pilegaard, Ordway and Saltin 46 ).
Western blotting
Finally, we analysed the phosphorylation of ERK1/2 and protein levels of HIF-1α to determine whether WPH activated these proteins. ERK1/2 is activated by phosphorylation( Reference Goodyear, Chang and Sherwood 47 , Reference Drummond, Dreyer and Fry 48 ), whereas protein levels of HIF-1α are rapidly up-regulated by specific stimuli (e.g. hypoxia) and induce the expression of target genes( Reference Martorell, Gentile and Rius 49 ). The WPH group had greater phosphorylation of ERK1/2 compared with the AAM group (Fig. 5(a)). The WPH group also demonstrated a significant increase in the protein levels of HIF-1α compared with the AAM group (Fig. 5(b)).
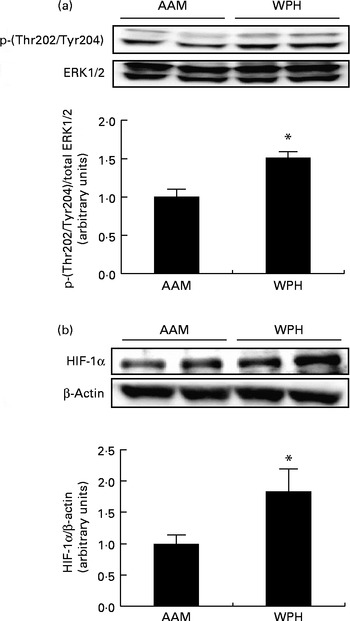
Fig. 5 Phosphorylated extracellular signal-regulated kinase 1/2 (ERK1/2) (a) and hypoxia-inducible factor-1α (HIF-1α) (b) levels in the skeletal muscle of rats administered a diet containing whey protein hydrolysate (WPH) or an amino acid mixture (AAM), measured 1 h after swimming exercise. Phosphorylated ERK1/2 was normalised to total ERK1/2, and HIF-1α was normalised to β-actin. Values are means (n 8), with their standard errors represented by vertical bars. * Mean value was significantly different from that of the AAM group (P< 0·05; Student's t test).
Discussion
We have previously found that the WPH group showed significantly higher muscle protein synthesis after exercise compared with the AAM group( Reference Kanda, Nakayama and Fukasawa 15 ). To investigate the novel effects of WPH on global gene expression, DNA microarray analysis was employed, with the AAM as the control. Principal component analysis of the DNA microarray data revealed that there were marked differences in the gene expression profiles of skeletal muscle between the two groups.
We found eight specific GO terms that were significantly enriched in the set of up-regulated genes (Fig. 1(b)). These GO terms included some key elements such as Cd24, Ccl2, Ccl7 and Cxcl1 involved in post-exercise muscle repair( Reference Higuchi, Kawai and Kawajiri 33 – Reference Roseguini, Arce-Esquivel and Newcomer 35 ). These results indicate that WPH induces more rapid muscle recovery after exercise than does the AAM. Furthermore, we found that among the GO terms appearing in the deepest hierarchy, ‘positive regulation of transcription from RNA polymerase II promoter’ included important transcription factors in skeletal muscle. Therefore, we focused on this GO term. To clarify the interaction of genes included in this GO term, we investigated the gene network. The network associated with cellular development showed that some transcription factors (Nr4a3, Nr4a1 and Egr1) interacted with Akt, which is a key enzyme in glucose metabolism and muscle protein synthesis( Reference Peyrollier, Hajduch and Blair 7 , Reference Drummond, Dreyer and Fry 48 ). We have previously shown that ingestion of WPH induces a greater increase in muscle glycogen levels via activation of Akt compared with ingestion of glucose alone after exercise( Reference Morifuji, Kanda and Koga 14 ). This result indicates that activation of Akt induced by WPH is involved in the up-regulation of the genes Nr4a3, Nr4a1 and Egr1. These genes are metabolism-related genes( Reference Irrcher and Hood 39 , Reference Kawasaki, Hokari and Sasaki 45 ). In the present study, the gene network analysis revealed that these genes interacted with some glucoregulatory enzymes, such as hexokinase( Reference Shulman, Bloch and Rothman 50 ), pyruvate kinase( Reference Yamada and Noguchi 51 ) and phosphofructokinase( Reference Mayes 52 ). Thus, these up-regulated genes were possibly involved in the increase in muscle glycogen content caused by WPH.
We found nine GO terms enriched in the gene set down-regulated by WPH, and these GO terms fell into two clusters. Of these two clusters, one included some genes encoding skeletal muscle fibres, such as Myh7, Tnni1, Tnnc1 and Tnnt1. Investigating the gene network of these muscle fibre-related genes, we found that Myh3 encoding skeletal muscle fibre protein was up-regulated (Fig. 4). Rodent skeletal muscle is composed of four distinct fibre types. Type I, IIa, IIx and IIb fibres differ with respect to contractile function, the number of mitochondria and metabolism( Reference de Wilde, Hulshof and Boekschoten 53 , Reference Booth and Thomason 54 ). The slow type I fibres can sustain prolonged low power work, contain more mitochondria and exhibit higher rates of fat oxidative metabolism. The fast type IIx and IIb fibres are adapted to brief and intense contractions and contain fewer mitochondria and generate energy mainly through glycolysis. The type IIa fibres are oxidoglycolytic and exhibit an intermediate contractile function. Interestingly, all of the down-regulated genes (Myh7, Tnni1, Tnnc1 and Tnnt1) encoded type I fibres( Reference de Wilde, Hulshof and Boekschoten 53 ). In contrast, Myh3 was expressed during the embryonic period( Reference Eller, Stedman and Sylvester 55 ). We also found that WPH up-regulated a key transcription factor, Six1. Six1 can reprogram adult muscle from the slow-twitch phenotype into the fast-twitch phenotype( Reference Grifone, Laclef and Spitz 56 ). In the present study, we used the epitrochlearis muscle for DNA microarray analysis and the triceps muscle for analysing the FSR and protein levels of ERK1/2 and HIF-1α. Both the epitrochlearis and triceps were recruited during swimming exercise in rats( Reference Terada and Tabata 57 ). In addition, both the epitrochlearis and triceps are highly glycolytic muscles with approximately 90 % type II fibres( Reference Rodnick, Henriksen and James 58 , Reference Fuentes, Cobos and Segade 59 ). Thus, both have similar functions and fibre compositions. Taken together, it is concluded that WPH can enhance adaptation to exercise by increasing type II fibres in the epitrochlearis and triceps to a greater extent than can the AAM.
The present microarray data also showed that two key factors, ERK1/2 and HIF-1α, regulated nine genes and three genes in DEG, respectively. In addition, we showed that WPH caused greater phosphorylation of ERK1/2 and increased protein levels of HIF-1α compared with the AAM. These results indicate that ingestion of WPH might regulate gene expression via activation of ERK1/2 and HIF-1α. The possible pathway of the regulation of these genes by ERK1/2 and/or HIF-1α is shown in Fig. 6. The ERK1/2 signalling pathway is important, as it is involved in the regulation of translation initiation and elongation following muscle contraction( Reference Goodyear, Chang and Sherwood 47 ). Although the cross-talk of the ERK1/2 and mTOR signalling pathways has been identified, it is believed that the effect of nutrients on muscle protein turnover is mainly due to the activation of the mTOR signalling pathway( Reference Drummond, Dreyer and Fry 48 ). In our previous study, we have shown that WPH strongly stimulated mTOR signalling compared with the AAM. According to Karlsson et al. ( Reference Karlsson, Nilsson and Nilsson 60 ), BCAA activate translation initiation that is dependent on mTOR signalling, but not on ERK1/2 signalling in humans. However, the present results indicated that WPH activated ERK1/2 signalling as well as mTOR signalling. Recently, Motobayashi et al. ( Reference Motobayashi, Izawa-Ishizawa and Ishizawa 43 ) showed that adiponectin inhibits insulin-like growth factor-1-induced cell migration by the suppression of ERK1/2 activation. Therefore, the results of the present study suggest that WPH keeps the activated state of ERK1/2 signalling by the down-regulation of Adipoq expression. In contrast, HIF-1α mediates the transcriptional response to hypoxia( Reference Semenza 61 ). It is notable that HIF-1α expression and function are regulated by mTOR signalling( Reference Semenza 61 ). Although it remains unclear whether specific nutrients activate HIF-1α, it is possible that WPH activates HIF-1α via activation of mTOR signalling. The findings of the present study provide new insights into the effects of nutrients on mTOR and ERK1/2 signalling.

Fig. 6 Possible pathway of the regulation of gene expression by whey protein hydrolysate (WPH) via activation of extracellular signal-regulated kinase 1/2 (ERK1/2) and hypoxia-inducible factor-1α (HIF-1α). MEK1/2, mitogen-activated protein kinase 1/2; PI3K, phosphatidylinositol 3-kinase; mTOR, mammalian target of rapamycin. For full names of gene symbols, see Table 2.
The three up-regulated genes Nr4a3 ( Reference Pearen, Ryall and Maxwell 37 ), Junb ( Reference Raffaello, Milan and Masiero 38 ) and Ankrd2 ( Reference Kemp, Sadusky and Saltisi 62 , Reference Tsukamoto, Hijiya and Yano 63 ) related to muscle hypertrophy are regulated by HIF-1α and/or ERK1/2. Therefore, we hypothesise that there is a relationship between the series of gene expression changes and the greater increase in muscle protein synthesis caused by the ingestion of WPH. Moreover, two genes related to muscle repair, Ccl7 and Hmox1, are also regulated by ERK1/2 or HIF-1α. Injured muscle tissue requires Ccl2 expression for repair. It is possible that Ccl7 also plays an important role in the response to acute skeletal muscle injury, especially in the absence of Ccl2 ( Reference Lu, Huang and Ransohoff 34 ). Although the physiological role of Hmox1 in muscle has not been established, Pilegaard et al. ( Reference Pilegaard, Ordway and Saltin 46 ) suggested that Hmox1 is induced in response to exercise to help minimise intracellular damage by free radicals, similar to the protective role of Hmox1 in other tissues. These results indicated that WPH induces more rapid muscle recovery via activation of ERK1/2 and HIF-1α.
The amino acid compositions of the two solutions (WPH and AAM) used in the present study were equivalent and plasma amino acid levels did not differ between the two groups, although the effects of the two diets on gene expression varied. Therefore, it is possible that active components, e.g. bioactive peptide, contained in WPH had an effect on gene expression. Previously, we noted that plasma levels of BCAA-containing bioactive peptides were elevated markedly after ingestion of WPH( Reference Kanda, Nakayama and Fukasawa 15 , Reference Morifuji, Ishizaka and Baba 19 ). Additional studies are therefore required to determine whether these dipeptides themselves caused the effect of WPH on gene expression.
In conclusion, in the present study of post-exercise rat skeletal muscle, we identified 189 genes whose expression was altered by the ingestion of WPH compared with that observed following ingestion of the AAM. Furthermore, we found two key upstream proteins, ERK1/2 and HIF-1α, that are predicted to regulate gene expression after ingestion of WPH. To our knowledge, the present study is the first to show that, compared with an AAM, ingestion of WPH induces changes in the gene expression profile via activation of ERK1/2 and HIF-1α. The present study only covered a 1 h range after ingestion; changes in the gene expression profile need to be studied over time to uncover the mechanisms underlying the superior repair effects caused by WPH compared with the AAM.
Supplementary material
To view supplementary material for this article, please visit http://dx.doi.org/10.1017/S0007114514000233
Acknowledgements
The present study received no funding.
The authors' contributions are as follows: A. K. designed the research; A. K., T. F., Y. N., K. A., K. K. and S. I. conducted the research; A. K., T. I., F. S., K. N., Y. N. and K. A. analysed the data; A. K. wrote the paper, and had primary responsibility for the final content. All authors read and approved the final manuscript.
The authors have no conflicts of interest to declare.


