


Test-negative designs (TNDs) are widely used in influenza vaccine effectiveness (VE) studies [Reference Orenstein1–Reference De Serres, Wu and Ambrose3]. In this design, samples are collected from patients with influenza-like illnesses, and VE is estimated by comparing the vaccination status of influenza test-positive cases with that of influenza test-negative cases.
Although the validity of TNDs has been investigated theoretically [Reference Orenstein1, Reference Jackson and Nelson2, Reference Foppa4] and empirically [Reference De Serres, Wu and Ambrose3], little is known about the effect of non-influenza respiratory virus (NIRV)-positive samples in controls on VE estimates. Ecological studies and simulation studies suggest that influenza infection may induce short-term non-specific immunity and reduce the risk of subsequent NIRV infections, a phenomenon known as virus interference [Reference Kelly5, Reference Cowling and Nishiura6]. If this hypothesis is true, individuals who are vaccinated against influenza and are less likely to be naturally infected with influenza are potentially at a higher risk of NIRV infections; therefore, influenza VE estimates using influenza test-negative controls, including NIRV-positive samples, may overestimate the true VE [Reference Cowling and Nishiura6].
A few studies have examined this association, but their findings were inconsistent [Reference Cowling7–Reference Sundaram9]. A randomized controlled trial (RCT) in Hong Kong showed an increased risk of NIRV diseases in influenza vaccine recipients [Reference Cowling7], and based on their data, the point estimate of VE in the TND using NIRV-positive controls was substantially higher than that using pan-respiratory virus-negative controls. In contrast, a TND study using six influenza seasonal datasets from the USA demonstrated that VE estimates did not differ when using influenza test-negative controls, NIRV-positive controls, or pan-respiratory virus-negative controls [Reference Sundaram9]. To understand these contradictory findings, we simulated VEs using a simple model and explored the potential effects of virus interference on the VE estimates in the TND.
We used a static model similar to that used in previous studies [Reference Kelly5, Reference Skowronski10]. In our model, we assumed that (1) the study period was a single typical influenza season in a temperate region, lasting for about 12 weeks, (2) each individual was at risk for influenza only at the beginning of the study period and at risk for NIRV infection throughout the study period, (3) the probability of developing influenza disease in an influenza-infected individual was constant regardless of his/her vaccination status (i.e. VE against influenza disease = VE against influenza infection), and (4) the probability of developing NIRV disease in an NIRV-infected individual was constant regardless of his/her previous influenza infection status. To focus the simulation on the effect of non-specific immunity induced by influenza infection (i.e. virus interference), we assumed that all other factors that may bias these estimates (e.g. socioeconomic factors, underlying conditions, and healthcare-seeking behaviours) were equally distributed among vaccinated and non-vaccinated individuals.
Five parameters were included in our simulation:
-
ve_true = true vaccine effectiveness against influenza infection.
-
ar_flu = infection attack rate (IAR) of influenza in individuals not vaccinated or not effectively vaccinated.
-
ar_nonflu = IAR of NIRV in individuals not protected by influenza-induced non-specific immunity.
-
α = preventive effect of influenza infection-induced non-specific immunity against NIRV infection.
 $$\hskip -3pt \beta = \displaystyle{\matrix{{\rm expected}\,{\rm duration}\,{\rm of}\,{\rm influenza \hbox{-} induced} \cr {\rm non \hbox{-} specific}\,{\rm immunity} } \over {{\rm total}\,{\rm duration}\,{\rm of} \,{\rm influenza}\,{\rm season}}}.$$
The preventive effect of influenza infection-induced non-specific immunity (α) was defined as the degree of reduction in the risk of subsequent NIRV infection; α = 0 indicated that influenza infection does not prevent subsequent NIRV infection, and α = 1 indicated that influenza infection completely prevents subsequent NIRV infection. The parameter β was introduced to model the duration of non-specific immunity, and β = 0·25 denoted that non-specific immunity lasted for 25% of the total duration of the influenza season.
In our population, the numbers of vaccinated and non-vaccinated individuals were P v and P nv, respectively (Supplementary online Fig. S1). Thus, the numbers of influenza infections in vaccinated individuals (I v) and non-vaccinated individuals (I nv) were calculated as follows:
 $$\eqalign{ & \hskip-2pt I_{\rm v} = P_{\rm v} *(1 - ve\_true)*ar\_flu, \cr & \hskip-2pt I_{{\rm nv}} = P_{{\rm nv}}*ar\_flu.} $$
Influenza-infected individuals experience non-specific immunity with intensity α during an average proportion β of the season. Thus, the numbers of NIRV infections in vaccinated individuals (N v) and non-vaccinated individuals (N nv) were calculated as follows:
 $$ \hskip -2pt \eqalign{ & N_{\rm v} =\, (P_{\rm v} -I_{\rm v} )*ar\_nonflu + I_{\rm v} *(1-\beta )*ar\_nonflu \cr & \hskip 26pt+ I_{\rm v} *(1-\alpha )*\beta *ar\_nonflu, \cr &N_{{\rm nv}} = \, (P_{{\rm nv}} -I_{{\rm nv}} )*ar\_nonflu + I_{{\rm nv}} *(1-\beta )*ar\_nonflu \cr & \hskip 26pt+ I_{{\rm nv}} *(1-\alpha )*\beta *ar\_nonflu.} $$
Then, the VE estimate in the TND (ve_est) was calculated as follows:
 $$\hskip -2pt \left. \eqalign{ve\_est = & 1 - \displaystyle{{I_{\rm v} /I_{{\rm nv}}} \over {N_{\rm v} /N_{{\rm nv}}}}, \cr = & \displaystyle{{ve\_true} \over {1 - (1 - ve\_true)*\alpha *\beta *\,ar\_flu}}} \right\}$$
(see Supplementary online equations for derivation)
Thus, ve_est is a function of ar_flu, ve_true, α, and β, and is always greater or equal to ve_true. ar_nonflu does not have an effect on ve_est in our model.
Based on previous studies, we assumed the IAR of influenza (ar_flu) to be 20% for the usual season and 50–80% for a pandemic [Reference Cox and Subbarao11, Reference Wu12]. As influenza VE substantially varies by age group, season, and setting, we set ve_true as 10%, 50%, and 90% [Reference Osterholm13]. To explore the effect of the duration of non-specific immunity, we performed the simulation with three different β values, i.e. 0·25, 0·5, and 0·75 (3, 6, and 9 weeks, respectively).
The bias in the influenza VE estimate was measured as the absolute bias (100∗|ve_est – ve_true|) and the relative bias (100∗|ve_est – ve_true|/ve_true). Analytical expressions for both types of bias are provided in the Supplementary online material.
The estimated VEs for different scenarios are shown in Figure 1. As predicted by equation (1), all estimated VEs overestimated the true values. Specifically, the absolute bias increased with the IAR of influenza (ar_flu) and with the intensity (α) and duration (β) of non-specific immunity. In contrast, the absolute bias peaked at intermediate values of ve_true (see Supplementary equations). Nevertheless, for the scenarios considered in Figure 1, the absolute bias was no more than 10 percentage points when ar_flu was <50%. In contrast, the relative bias can be shown to increase with α, β, and ar_flu and decrease with ve_true (see Supplementary equations). However, as shown in Figure 2, the relative bias was >20% only when ar_flu was >50%, the true VE was low to moderate, and the non-specific immunity was both >6 weeks and relatively intense (α>0·5).
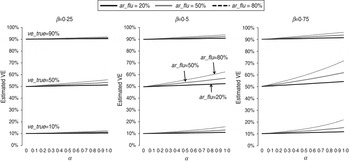
Fig. 1. Estimated influenza vaccine effectiveness (VE) in test-negative designs in different scenarios. ve_true = true VE against influenza infection; ar_flu = infection attack rate (IAR) of influenza in individuals not vaccinated or not effectively vaccinated; α = preventive effect of influenza infection-induced non-specific immunity against NIRV infection; β = ratio of the duration of influenza-induced non-specific immunity to the duration of the influenza season.
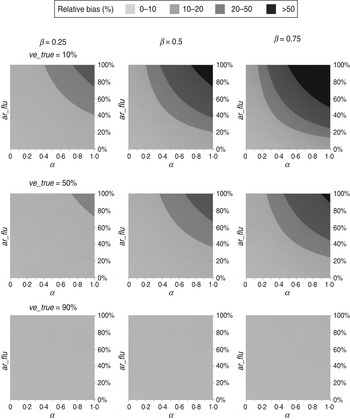
Fig. 2. Relative biases of influenza vaccine effectiveness estimates in test-negative designs in different scenarios. (For abbreviations used see Fig 1.)
According to our simulation findings, the potential effect of influenza infection-induced non-specific immunity on the VE estimates in the TND is marginal as long as the influenza IAR remains at the level present in usual seasons (<20%). In an actual setting, expecting that influenza-induced non-specific immunity completely prevents subsequent NIRV infections is unreasonable. In addition, non-specific immunity may last several weeks but not several months [Reference Kelly5, Reference Cowling and Nishiura6]. Thus, it is much less likely that α≈1 and β>0·5. The TND provides reliable VE estimates in usual influenza seasons regardless of virus interference.
However, the degree of bias may still become substantial under specific conditions, particularly when the IAR is very high (>50%), the true VE is low to moderate, and α>0·5 and β>0·5. Although such an intense non-specific immunity is still biologically unlikely, this situation may arise in real populations, such as in children during an influenza pandemic [Reference Wu12]. In addition to a pandemic, IARs and VEs are known to differ by population and study setting [Reference Osterholm13]; thus, the biases may also vary by age group and season. Combining and averaging data from multiple seasons may mask this variation.
The above findings suggest an explanation for the contradictory results of recent VE studies. Indeed, the bias was observed in a Hong Kong RCT study [Reference Cowling7] because it targeted children aged 6–15 years during the 2009 pandemic when the IAR was very high; however, the effectiveness of the seasonal influenza vaccine on the 2009 pandemic strain remains controversial [Reference Skowronski10, Reference Yin14]. In contrast, this bias was not observed in a USA TND study that targeted children aged <5 years and adults aged ⩾50 years [Reference Sundaram9], most likely because the study averaged the data from six seasons and overlooked the inter-seasonal variation. Only a few TND studies have investigated the bias in VE estimates using different controls (i.e. influenza test-negative controls, NIRV-positive controls, and pan-respiratory virus-negative controls) [Reference Kelly8, Reference Sundaram9]. Age group-specific and season-specific bias estimates are needed in future TNDs.
Our study is limited because we used a static model and did not take into account the timing of infections. Moreover, we considered that NIRV infections do not have an effect on subsequent influenza infections, although virus interference may be bi-directional [Reference Anestad15, Reference Linde16]. However, as long as influenza vaccination does not preclude NIRV infection, NIRV-induced non-specific immunity reduces the influenza IAR (ar_flu) both in vaccinated and non-vaccinated individuals, and thus, does not induce any additional bias in the VE estimates. More precisely, by reducing the overall influenza IAR, NIRV-induced non-specific immunity reduces the bias in VE estimates. In summary, although the introduction of NIRV-induced non-specific immunity in our model would not change our qualitative conclusions, we believe that our estimates are conservative.
In conclusion, the effect of influenza infection-induced non-specific immunity on VE estimates in the TND is only marginal in usual influenza seasons and most of the time in pandemics; the effect only becomes substantial when the IAR increases to pandemic levels, the true VE is low to moderate, and non-specific immunity almost completely protects from NIRV infections and lasts at least half the influenza season. Our findings also suggest that the absence of differences in VE estimates using NIRV-positive controls or pan-virus-negative controls in the TND should not be taken as evidence against virus interference. Further studies, such as cohort studies with intensive monitoring, are required to investigate the effect of influenza infection on subsequent NIRV infection.
SUPPLEMENTARY MATERIAL
For supplementary material accompanying this paper visit http://dx.doi.org/10.1017/S0950268814000107.
ACKNOWLEDGEMENTS
This work was supported by the ‘Improvement of Research Environment for Young Researchers’ programme, organized by the Japanese Ministry of Education, Culture, Sports, Science and Technology, and by the Medical Research Council UK [A.C., MR/J01432X/1].
DECLARATION OF INTEREST
None.


