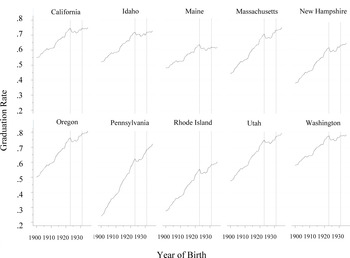
World War II interrupted the schooling of many young women and men. Prior to the outbreak of the war, educational attainment in the United States increased steadily from at least the turn of the century. In 1910 fewer than 10 percent of 17-year-olds graduated from high school, by 1940 that number was more than 50 percent and increased still further to 70 percent by 1990. Immediately following U.S. entry into the war, high school graduation rates decreased sharply, falling back to their levels in the early 1930s, as depicted in Figure 1A.
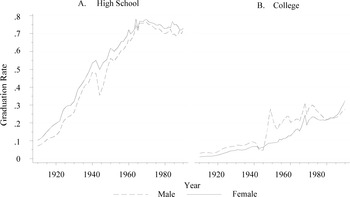
FIGURE 1 HIGH SCHOOL AND COLLEGE GRADUATION RATES, 1910–1990
The increase in male college completion rates following World War II, shown in Figure 1B, and the role of the 1944 Servicemen's Readjustment Act (popularly known as the GI Bill) has received considerable attention from economists. Less attention has been paid to the sharp decrease in high school completion rates for women and the potential adverse effects on education, work, and family formation. In short, the triumphant image of “Rosie the Riveter” may not capture the full costs associated with wartime work, particularly in light of evidence that employment gains for women during the 1940s were temporary (Schweitzer Reference Schweitzer1980; Anderson Reference Anderson1981; Campbell Reference Campbell1984; Milkman Reference Milkman1987; Goldin Reference Goldin1991; Kossoudji and Dresser Reference Kossoudji and Dresser1992).
In this article, I examine the effect of manpower mobilization during World War II on the educational attainment of the high school-age cohort of women in the early 1940s. The hypothesis is that women in this cohort were attracted by the new employment opportunities in sectors typically dominated by men and, as a result, left high school before graduating. Many of the jobs that women performed during the war did not require a high school degree (e.g., in manufacturing), however, some of these women were forced to leave these jobs at the war's end and others left voluntarily. Thus, the experience gained during the war came at the expense of education that would have increased wages in clerical, sales, and professional sectors, where female employment increasingly concentrated in the postwar period (Goldin 1990). Despite the ability to tradeoff schooling for work and higher wages during wartime,Footnote 2 after the war women in this cohort were left with less education and limited prospects in sectors in which they had recently acquired experience.
Previous research has focused on the educational gains of men due to the GI Bill or the cost of mobilization in Europe.Footnote 3 However, the mechanisms for the war to alter the educational attainment of European and American youth were very different. In Europe, the destruction of schools, the military service of fathers, and a higher probability of military service among school-age children limited opportunities to obtain more education directly. In contrast, in the United States, the war's effect was through pressure on civilian labor markets, the ramp-up in industrial production, and increased military manpower requirements.Footnote 4 Despite the formal urging of policymakers, many high school-age youth dropped out to enlist in the military or take advantage of labor market opportunities. Since women did not have access to the GI Bill, except the relative few that served formally (e.g., in the WAC or WAVES), and many male youth would later gain access to the GI Bill through service in Korea, I focus on quantifying the effect of World War II manpower mobilization on young women's educational attainment.
To do this, I exploit the large reduction in male labor supply due to voluntary enlistments and inductions under the 1940 Selective Service Act. In contrast to previous studies that use only the cross-state variation in manpower mobilization (e.g., Acemoglu, Autor, and Lyle Reference Acemoglu, Autor and Lyle2004; Fernandez, Fogli, and Olivetti Reference Fernandez, Fogli and Olivetti2004), I collect annual counts of enlistments and inductions for each state between 1940 and 1945, which I use to calculate exposure to mobilization for World War II by state of birth and year of birth. Thus, I am able to compare the educational attainment of female cohorts born in states with differential manpower mobilization as well as cohorts within states with differences in exposure to mobilization over time.
Consistent with the decrease in high school graduation during the war, I find that female cohorts more exposed to mobilization had lower educational attainment in 1960. This effect is concentrated among the share of women completing grades 11 and 12, which is in line with the large rise in the labor force participation of women in these age groups during the war. In addition, I find that compared to their counterparts in cohorts unaffected by mobilization, these women were less likely to be employed and had lower earnings in 1960. I also find that greater exposure to mobilization is associated with decreased age at first marriage and increased fertility. The decrease in employment and wages is not surprising given the lower educational attainment of women in these cohorts, but suggests some revision to work by Daron Acemoglu, David H. Autor, and David Lyle that instead emphasizes the role of increased labor market competition. Furthermore, the change in family formation suggests a link between the labor market outcomes of these women and the onset of the postwar baby boom.
In the final section of the article, I turn to whether the effects of exposure to manpower mobilization were permanent. Traditional life-cycle models of human capital accumulation predict that the greatest portion of human capital is obtained early in life (Ben-Porath Reference Ben-Porath1967). However, alternative models show why individuals may reenter school later in life, for example, after changing jobs, changes in the value of leisure over the life-cycle, or relaxed credit constraints (Weiss Reference Weiss1971; Ryder, Stafford, and Stephan Reference Ryder, Stafford and Stephan1976; Wallace and Ihnen Reference Wallace and Ihnen1975). For the postwar period, Nancy J. Davis and Larry L. Bumpass (Reference Davis and Bumpass1976) find that many women returned to school later in life. Within this group, additional schooling was concentrated among those near the completion of a degree (either high school or college). In light of these results, I repeat my analysis for education, labor market outcomes, and fertility, in 1970 and find that differences due to mobilization disappear. This suggests an important role for education obtained after 1960, which helped these women overcome the adverse effects of World War II. I also provide evidence that women of high school age during World War II did in fact return to school after the war's end. These findings are consistent with theoretical and empirical work that emphasize the role of learning about the returns to work and schooling (Altonji Reference Altonji1993), particularly in the context of the rise of women's labor force participation in the second half of the twentieth century (Fernandez Reference Fernandez2013). This is the case particularly between 1960 and 1980, which Claudia D. Goldin (Reference Goldin, Carter, Sigmund Gartner, Haines, Olmstead, Sutch and Wright2006) identifies as a key period of changing expectations about the prospects for work due to a variety of factors, among them rising education levels.
HISTORICAL BACKGROUND
Advances in Education Prior to 1940
From 1910 to 1940 high school graduation rates in the United States increased almost continuously. This increase in educational attainment was rapid and followed the improvement in the elementary school infrastructure in the nineteenth century as well as being a response to high returns to skill from the antebellum period onward. As a result, by 1940 the median 18-year-old was a high school graduate although significant regional differences persisted into the second half of the twentieth century (Margo Reference Margo2000; Goldin and Katz Reference Goldin and Katz2008).
The large differences in high school graduation rates between regions had myriad causes: from restricted access due to racial discrimination throughout the South to limited investment in secondary school infrastructure because a large industrial base maintained demand for relatively low-skilled labor. Goldin and Lawrence Katz (Reference Goldin and Katz2008) argue that regions with high income levels, say (but not exclusively) from agriculture, and a manufacturing sector that was not too large or too high-wage encouraged high rates of high school completion.
Prior to the outbreak of World War II, the first slowdown occurred during World War I and was concentrated among men, but mobilization of the eligible male population was much lower than during World War II and did not noticeably affect female graduation rates. The second slowdown followed briefly from the onset of the Great Depression, but graduation rates recovered quickly and continued to increase over the remainder of the 1930s. Nevertheless, on the eve of U.S. entry into World War II, America was still learning to graduate from high school. As a result, uncertain expectations about the future value of education—the return to a high school completion relative to ninth grade decreased during the 1940s (Goldin and Katz Reference Goldin and Katz2008, p. 85)—together with a small change in the opportunity cost of schooling could lower the incentive to obtain more education.
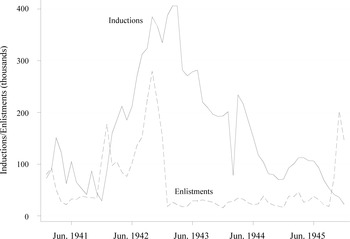
FIGURE 2 MONTHLY INDUCTION AND ENLISTMENTS INTO THE ARMED SERVICES, 1941–1945
World War II Manpower Mobilization
The Selective Service Act was enacted on September 16, 1940, and initiated the largest mobilization of manpower for war in U.S. history. The draft was held in six registrations beginning in October 1940 and led to more than half of the male population aged 18 to 45 in 1940 serving in World War II. However, the national mobilization rate hides considerable variation at the state level: the lowest and highest overall mobilization rates range from about 40 to 55 percent. In addition, as shown in Figure 2, there was substantial variation in the rollout of mobilization over time, with significant enlistments prior to 1942, inductions peaking nationally in late 1943, and large additions to the armed forces up through 1944.
The differences in the mobilization rate across states and over time reflect differences in the demographic and economic characteristics that draft boards considered in granting deferments as well as changes in manpower demands over the war years. Upon registration, men filled out a questionnaire including name, age, race, marital status, place of birth, state of residence, and employment status. This information was used to classify men into four broad categories: (i) available for training and service, (ii) temporary deferment because of occupation, (iii) deferment because of dependency, and (iv) deferment for miscellaneous reasons (U.S. Selective Service System 1945).Footnote 5 In general, these criteria changed over the war years in the direction of providing fewer official avenues for men to avoid service.
To meet manpower requirements, the military issued requisitions to the Director of Selective Service, which were then translated into monthly calls for inductions. Calls were calculated by taking a state's share of the national quota multiplied by the military's requisitions for a given month. State quotas were set using the number of men available for military service adjusted for deferments granted and the number already serving. Calls were subject to some administrative adjustments to reflect changes in regulations, for example, governing occupational deferments. However, these adjustments were relatively minor (U.S. Selective Service System 1948).
The draft together with the increased demand for industrial production led a large number of women to enter paid work during World War II; female labor force participation increased from 27.8 percent in 1940 to 33.8 percent in 1945. However, at the end of the war, the female labor force participation rate decreased sharply and by 1950 still had not surpassed its wartime peak. Goldin (Reference Goldin1991) provides evidence based on retrospective surveys that many of the women employed after the war were already working in December 1941 and less than half those that entered during the war remained in 1950.
The war's short-run effect on employment was not confined to white women; black men also experienced employment gains due to industrial manpower requirements and anti-discrimination legislation (Collins Reference Collins2001). In addition, high school-age and college-age males and females increased participation in paid work. For example, the labor force participation rate of females aged 14 to 19 rose from 19.9 percent in 1940 to 41.8 percent in 1944 (Goldin Reference Goldin1991, p. 742). The increase in the labor force participation of young females was partly due to an increase in part-time work. However, over two-thirds of high school-age females in the labor force in 1944 were not attending school at all (U.S. Bureau of Labor Statistics 1945, p. 8). This increase in full-time work among school-age youth is consistent with the precipitous decline in high school graduation rates in the first half of the 1940s.
The sharp drop in enrollment between 1940 and 1943—totaling around one million students—did not go unnoticed. In some areas, school administrators responded to the decreased enrollment with formal work-study programs that allowed students to attend school for part of the day and work the other part. The extent of the problem was highlighted in a statement issued by the superintendent of schools in New York City:
“The number of vacation work permits issued to high school students has increased tenfold since the outbreak of the war. The number of permanent work permits has tripled. There is serious danger that many of the holders of these permits will be tempted by high wages to continue in their jobs rather than return to school” (quoted in Kandel Reference Kandel1948, p. 86).
Partially in anticipation of the strain war mobilization would place on local resources, the federal government provided funding to build or maintain schools in cities receiving the largest allocation of war contracts. In addition, the U.S. Office of Education, Children's Bureau, War Manpower Commission, the Office of War Information, along with parents, school administrators, and employers worked together through local “Go-to-School Drives” to encourage students to stay in school, either full-time or part-time (Kandel Reference Kandel1948).
The substantial decline in rates of high school completion suggests that the efforts by parents and school officials were unsuccessful. However, the continued expansion of the U.S. education system in the early postwar period suggests that women had the opportunity to return to school following the end of the war. The goal of the empirical analysis is to determine how mobilization affected the education, work, and family formation of high school-age women during World War II and then to assess to what extent the effects were permanent.
DATA AND EMPIRICAL DESIGN
I combine two data sources to examine how manpower mobilization affected the educational attainment of the high school-age cohort of native-born white women during World War II. First, I use the Integrated Public Use Microdata samples of the 1960 and 1970 Censuses (Ruggles et al. Reference Ruggles, Alexander, Genadek, Schroeder, Goeken and Sobek2010) to calculate average educational attainment by year of birth and state of birth. In each census year, I restrict the sample to native white women born between 1900 and 1935 to ensure comparisons are between cohorts with similar access to schooling over time. In addition, I drop all individuals born in Alaska and Hawaii, which did not officially join the United States until 1959, as well as Washington, DC. The solid line in Panel A of Figure 3 shows the mean high school graduation rate for each cohort and the dashed lines indicate variation (i.e., mean plus/minus one standard deviation) across states for a given birth year.

FIGURE 3 HIGH SCHOOL GRADUATION AND MOBILIZATION EXPOSURE, 1900–1935
I also collected data on manpower mobilization from the Quotas, Calls, and Inductions volumes of the Special Monographs of the Selective Service, which provide information on the number of inductions and enlistments annually and total registrants in each state between 1940 and 1945. I use the enlistment and induction counts to construct a measure of manpower mobilization by summing the number of inductions and enlistments that a cohort in a given state is exposed to during high school age and dividing by a state's total registrants. To be precise, the mobilization rate for a cohort born in state s in year c is equal to the total inductions and enlistments during the years the cohort was between the ages of 14 and 18,
 \begin{equation}
mobilization_{sc} = \frac{{\sum\nolimits_{t = 14}^{18} {\left({{\rm industions}_{s,c,t} + {\rm enlistment}_{s,c + t} } \right)} }}{{{\rm resistrants}_s }}
\end{equation}
\begin{equation}
mobilization_{sc} = \frac{{\sum\nolimits_{t = 14}^{18} {\left({{\rm industions}_{s,c,t} + {\rm enlistment}_{s,c + t} } \right)} }}{{{\rm resistrants}_s }}
\end{equation}
Panel B of Figure 3 shows the mean and standard deviation of mobilization sc for each year of birth c from 1923 to 1931; for the remaining birth years, mobilization sc is equal to zero. The Appendix provides additional details on sources and variable construction.
There are three notable features in Figure 3. First, there is considerable cross-state variation in both educational attainment and mobilization, as indicated by the standard deviation in each birth year. Second, there are substantial differences in exposure for the cohorts born between 1923 and 1931: the mean of mobilization sc is 0.08 for the cohort born in 1923, increases to 0.46 for those born in 1927, and falls back to 0.05 for the 1931 cohort. Third, the pace of growth of the high school graduation rate slowed substantially after 1923 as cohorts were increasingly exposed to manpower mobilization for World War II.
The estimation approach incorporates both the cross-state and cross-cohort variation in manpower mobilization. Specifically, I consider regressions of the form
 \begin{equation}
Y_{sc} = \beta mobilization_{sc} + \varphi _s + \varphi _c + f\left(c \right) + \in _{sc}
\end{equation}
\begin{equation}
Y_{sc} = \beta mobilization_{sc} + \varphi _s + \varphi _c + f\left(c \right) + \in _{sc}
\end{equation}
where Ysc is mean years of schooling for women born in state s and year c. Constructed as the sum of inductions and enlistments (normalized by total registrants), the mobilization sc variable is interpreted here as the reduction in labor supply due to the withdrawal of men from the labor force following the 1940 Selective Service Act. One concern is that unemployment was still high following the Great Depression —estimates range between 9.5 and 14.6 percent in 1940 (Margo Reference Margo1993, p. 43)—and many men enlisting or inducted did not come directly from paid work. Still, the large variation in mobilization sc captures considerable differences in able-bodied men available to work in each state s as well as differences in the magnitude of mobilization across the c cohorts.
TABLE 1 SUMMARY STATISTICS AND DETERMINANTS OF MOBILIZATION

Notes:
The overall mobilization rate is the number of inductions and enlistments divided by total registrants between November 1940 and December 1945. Each characteristic is the share of males aged 18 to 44. Columns 1 and 2 show the mean and standard deviation (in brackets) of each characteristic stratified by whether the state is a “high” (≥ 0.47) or “low” (< 0.47) mobilization state. In column 3, robust standard errors are reported in parentheses.
Source:
State-level characteristics are from the 1940 IPUMS census sample (Ruggles et al. Reference Ruggles, Alexander, Genadek, Schroeder, Goeken and Sobek2010). The mobilization rate is from the Special Monographs of the Selective Service (U.S. Selective Service System 1948).
The remaining variables control for changes in labor demand or other factors that affected women's labor supply decisions, are potentially correlated with manpower mobilization and educational attainment, and therefore bias the estimate of β. Specifically, state fixed effects, φ s , capture time-invariant characteristics that draft boards used to grant deferments or reject registrants for military service and were directly related to changes in labor demand. For example, industry, marital and parental status, and race, were all factors explicitly considered by draft boards and potentially correlated with average cohort educational attainment in a particular state.
To illustrate the relationship between state characteristics and mobilization, the first two columns of Table 1 present summary statistics for state characteristics in 1940 stratified by the overall mobilization rate (i.e., high vs. low) between 1940 and 1945. Column 3 of Table 1 presents the results of the overall mobilization rate regressed on state demographic and economic characteristics. The most important predictors of the mobilization rate are the share in farming and the share in defense-related industries.Footnote 6 This is expected given the initial emphasis the Selective Service placed on balancing military manpower requirements with the need for high levels of industrial output and maintaining food supplies. The share that are fathers, married, and black do not show up as significant.
Returning to equation 1, cohort-fixed effects control for changes in labor demand and supply that similarly affected all individuals in the same cohort. For example, technological advances that raised or lowered the demand for particular skills or national business cycle conditions at the time a cohort entered the labor force. Finally, a state-specific time trend, fs(c), controls for the fact that educational attainment tended to increase over time but at different rates across states. The trend terms also adjust for cohort-specific labor demand shocks during the war years that were correlated with mobilization sc . In the results presented below, fs(c) is approximated with a second-order polynomial in year of birth (i.e., θs(c) and θs(c)2 ).
The identifying assumption is that manpower mobilization did not respond to deviations of female educational attainment from the state-specific trends. This would be violated if, for example, the Selective Service explicitly considered the rates at which recent female cohorts completed high school during the war years when determining inductions. The administrative history indicates that, in general, inductions were set mechanically through a formula based primarily on the pool of available men. Some discretion was exercised by local draft boards based on idiosyncratic factors. The time-invariant component of these factors is controlled for through state-fixed effects. Finally, standard errors are clustered on state of birth to allow for serial correlation across cohorts born in the same state.
MOBILIZATION AND EARLY-LIFE EDUCATION, WORK, AND FAMILY FORMATION
Results for Educational Attainment
The results from estimating equation 1 are presented in Table 2. The first column, based on cohorts born between 1915 and 1931, includes state- and cohort-fixed effects as well as a state-specific second-order polynomial in year of birth. The subsequent columns examine the robustness to alternative samples and control variables: column 2 adds additional cohorts born between 1900 and 1914; column 3 adds cohorts born until 1935; column 4 restricts the sample to cohorts born between 1923 and 1931 (i.e., cohorts for which is strictly positive). Column 5 drops the sixteen southern statesFootnote 7 and column 6 adds the state compulsory attendance and child labor laws applicable to each cohort at age 14 as control variables.Footnote 8 The estimates are stable across alternative samples (columns 2 through 5) and when control variables for compulsory attendance and child labor laws are included (column 6).
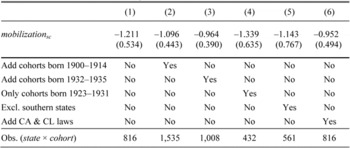
TABLE 2 EXPOSURE TO MOBILIZATION, FEMALE EDUCATIONAL ATTAINMENT IN 1960
Notes:
The dependent variable is mean cohort years of schooling in 1960. All specifications include state of birth and cohort-fixed effects as well as a state-specific second-order polynomial in year of birth. Column 2 adds additional cohorts born between 1900 and 1914. Column 3 adds cohorts born between 1932 and 1935. Column 4 restricts the sample to cohorts born between 1923 and 1931. Column 5 excludes the southern states and column 6 adds the state compulsory attendance and child labor laws in effect when each cohort was age 14 as control variables. In all columns, observations are weighted by the number of women in cohort × state cells. Standard errors (in parentheses) are clustered on state of birth.
Source:
Cohort data are constructed from the 1960 IPUMS census sample (Ruggles et al. Reference Ruggles, Alexander, Genadek, Schroeder, Goeken and Sobek2010). The mobilization rate is from the Special Monographs of the Selective Service (U.S. Selective Service System 1948). State compulsory attendance and child labor laws are from Acemoglu and Angrist (Reference Acemoglu and Angrist2000).
The coefficient estimates in Table 2 imply a substantial negative impact of manpower mobilization on educational attainment. The median of the mobilization exposure distribution (including cohorts with zero exposure) is 0.135. Therefore, the coefficient in column 1 implies that a cohort at the median exposure obtained 0.163 (= 0.135 × 1.211) fewer years of schooling compared to cohorts with no exposure to mobilization. This corresponds with one student dropping out two years early to work during wartime for every ten men joining the armed forces through inductions or enlistments.Footnote 9
The youth who left school to enter paid work were employed in a variety of sectors. Among women aged 14 to 19 in 1944 and not attending school the largest share (40.7 percent) were employed in manufacturing, followed by 19.9 percent in finance and service, and 16.8 percent in retail trade.Footnote 10 The result was substantially more young women in employment in 1944 than 1940, particularly in manufacturing. The pattern of wartime employment for men not attending school was more stable: male employment for those aged 14 to 19 was more evenly split between manufacturing (28.6 percent) and agriculture (45 percent), which differed less from the prewar pattern (U.S. Bureau of Labor Statistics 1945). Overall, changes in the employment patterns of young men and women between 1940 and 1944 suggest that much of the increase in manufacturing employment in the early 1940s was due to young women dropping out of school to enter work.
To see how the war affected the distribution of education, Table 3 presents the results for the effect of mobilization on the share of a cohort completing at least a given grade level. Specifically, each column contains the coefficient on from a regression where the outcome is the share in a cohort completing at least years of schooling. The results indicate that mobilization primarily lowered the share completing 11 and 12 years of schooling. For lower and higher grades, the estimates are economically small and not statistically significant.
TABLE 3 EXPOSURE TO MOBILIZATION, COMPLETED YEARS OF SCHOOLING IN 1960

Notes:
Estimates are from a modified version of equation 1 in the text. Each column is from a separate regression in which the dependent variable is the share in a cohort completing at least g years of schooling by 1960. All specifications include state of birth and cohort-fixed effects as well as a state-specific second-order polynomial in year of birth. In all columns, observations are weighted by the number of women in cohort × state cells. Standard errors (in parentheses) are clustered on state of birth.
Sources:
See Table 2 sources for details.
To see the effect of mobilization on high school graduation rates in particular states, Figure 4 plots the fitted values from a version of equation 1 for the ten states with the highest overall mobilization rate. The cohorts born after 1922 are exposed to manpower mobilization and have lower high school graduation rates than previous cohorts. This is consistent with the concentration of the increase in full-time work among young women more than 16 years old and, therefore, with mobilization primarily affecting high school, not college, completion (U.S. Bureau of Labor Statistics 1945, p. 9).
Goldin (Reference Goldin1998) notes the decrease in the high school graduation rate of both females and males, and suggests a similar cause of the decline across gender. It was not only that young men joined the military and women did not, although this played some role. Rather, both young men and women were attracted into work by the change in labor market conditions. In the case of young women, many were able to obtain work in industries that in the absence of the war and large-scale mobilization would have been closed to female workers. At war's end, many of these women would indeed be forced to leave work in war industries, a repeat of women's post-World War I experience (Greenwald Reference Greenwald1980).
Interestingly, there are no similar effects of manpower mobilization on the educational attainment of African American women. This is most likely due to the lower rates of high school completion among blacks in this period. By 1940 access to education had advanced enough that many whites made the decision to obtain additional schooling on the margin of completing high school. In contrast, blacks completed high school at roughly half the rate of whites over this period and obtained, on average, between two and three fewer years of schooling (Goldin and Katz Reference Goldin and Katz2008, p. 23). Thus, when mobilization for World War II increased labor market opportunities for young women, many white women elected to drop out, while many black women had already reached their highest level of schooling.

FIGURE 4 VISUAL EFFECT OF MOBILIZATION EXPOSURE FOR TEN STATES
Results for Labor Market Outcomes and Family Formation
Several authors have highlighted the extent of women's postwar employment problems. For example, Karen Anderson (Reference Anderson1981, pp. 162–64) concludes that many women intended or hoped to keep working after the war was over. At the same time, a 1944 survey of Washington State manufacturers suggested that postwar layoffs would be concentrated among women. This conclusion is consistent with evidence presented by the Bureau of Labor Statistics (1944) that many women anticipated staying in the labor force and the findings of Sherrie A. Kossoudji and Laura J. Dresser (Reference Kossoudji and Dresser1992) that women accounted for a disproportionate share of layoffs at Ford Motor Company. In addition, Kossoudji and Dresser found that the women likely to have the fewest outside employment opportunities were particularly exposed to postwar layoffs.
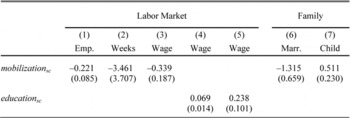
TABLE 4 EXPOSURE TO MOBILIZATION, WORK, AND FAMILY OUTCOMES IN 1960
Notes:
The outcome in column 1 is the share employment in a given cohort. In column 2, the outcome is cohort average weeks worked in the previous year conditional on employment. In columns 3 through 5, the outcome is the (log) average weekly wage conditional on working at least 40 weeks in the previous year. In columns 6 and 7, the outcomes are cohort average age at first marriage and number of children ever born in 1960, respectively. All specifications include state of birth and cohort-fixed effects as well as a state-specific second-order polynomial in year of birth. In all columns, observations are weighted by the number of women used to calculate the dependent variable. Standard errors (in parentheses) are clustered on state of birth.
Source:
See Table 2 sources for details.
Ultimately, there is little direct evidence on the postwar labor market prospects and family decisions of the young women that left high school early to enter wartime work.Footnote 11 For evidence on the effect of mobilization on labor market outcomes in 1960, the first three columns of Table 4 presents estimates from a version of equation 1 in which the dependent variable is one of three cohort labor market outcomes in 1960: employed share, average weeks worked in the previous year conditional on employment, and (log) average weekly wage conditional on employment. The cohorts most affected by mobilization had a smaller share employed in 1960 (column 1), did not work fewer weeks (column 2), and earned less (column 3). This is consistent with these less educated female cohorts experiencing lower rates of employment and earning lower wages due to higher exposure to mobilization for World War II.
In order to examine this channel, columns 4 and 5 report the results from OLS and IV regressions of the log weekly wage on average years of schooling, where the mobilization variable is used as an instrument in column 5. Interestingly, the IV estimate is larger than the OLS estimate. The size of the difference may be partially due to the correlation between unobserved factors affecting cohort earnings and the mobilization variable. However, following David Card (Reference Card2001), this may also reflect the fact that mobilization primarily altered the schooling decisions of those with relatively high returns. The potential biases suggest caution when interpreting these results. Still, this finding is consistent with the results reported later that differences in educational attainment and labor market outcomes disappeared between 1960 and 1970 as these women, recognizing the gains from more education, returned to school.
In addition, while Acemoglu, Autor, and Lyle (Reference Acemoglu, Autor and Lyle2004) emphasize the causal link between increased labor market competition and lower female wages in the postwar period, my findings suggest an alternative interpretation. In particular, lower postwar earnings, at least among younger women, were partially due to the direct of effect of less education among labor market participants as a result of their greater exposure to the mobilization. Goldin and Claudia Olivetti (Reference Goldin and Olivetti2013) also note that educational attainment mattered for the type of wartime work obtained by women and their postwar employment prospects. Among women 25 to 44 in 1951, 80 percent of those with a high school degree or more worked in white-collar jobs in 1944, while 75 percent of those with less than a high school degree worked in blue-collar occupations during the war. These patterns persisted, with a trend toward work in service occupations replacing work in manufacturing.
The last two columns of Table 4 presents the results from estimating equation 1 using the average age at first marriage and the average number of children ever born in 1960 as the dependent variable. Column 6 shows that greater exposure to mobilization is correlated with a lower age at first marriage and column 7 shows that greater exposure is associated with higher fertility. These estimates may not capture the causal effect of mobilization on family formation and fertility, since higher rates of mobilization may be correlated with additional public services (e.g., child care) and housing construction that occurred during the war and remained in place once the war was over. Still, these and other services, which targeted high mobilization areas in order to relieve the worst effects of large-scale mobilization, provided the infrastructure that facilitated earlier entry into marriage and higher fertility. The findings for family formation and fertility are in line with a large literature that emphasizes the contribution of changes in labor market competition to the postwar baby boom (Butz and Ward Reference Butz and Ward1979; Doepke, Hazan, and Maoz Reference Doepke, Hazan and Maoz2012). In the immediate aftermath of the war, women faced competition from men returning home from the war. In addition, female cohorts that reached childbearing age after the end of the war also had to compete with women that were able to retain their wartime jobs. As a result, women who came of age in the 1940s and 1950s decreased their supply of labor to the market, moved more rapidly into marriage, and increased their fertility. This effect may also reflect changes within the household as rising husbands’ earnings, due to education obtained through the GI Bill and improved economic conditions, facilitated greater specialization in market and nonmarket work. Importantly, to the extent that education played a role in these labor market, marital, and family decisions, my findings highlight the impact of World War II mobilization on the lives of these young “Rosies.”
THE LONG-RUN IMPACT OF MANPOWER MOBILIZATION
The previous section documents a pattern of lower educational attainment, employment, and earnings as well as altered family formation decisions for the high school-age cohort of white females during World War II. My argument is that these effects were driven by differences in the exposure to manpower mobilization by state of birth and year of birth. Goldin and Katz (Reference Goldin and Katz2008, p. 84) provide estimates of the returns to high school completion (relative to nine years of schooling) for males between 1914 and 2005, which are reproduced in Figure 5. If male and female returns to schooling move together, the fall in the return to high school completion between 1939 and 1949, suggests one reason why the schooling gap between the war and nonwar female cohorts was not eliminated by reinvestment in education immediately after the end of war: the gains from high school completion were relatively low. After 1960, however, the return to high school completion began a steady increase that continued until 1995 and may have incentivized a return to school among some women. In addition, improved access to reliable contraception throughout the 1960s allowed married women to limit later-life fertility (Bailey Reference Bailey2010).
Table 5 presents estimates of equation 1 using the 1970 Census to calculate education and labor market outcomes: column 1 shows the results for cohort high school graduation rate, column 2 the results for cohort mean years of schooling, and columns 3 through 5 for employment, weeks worked, and earnings, respectively.Footnote 12 In the first column, the coefficient on mobilization shows that the gap in high school graduation rates across cohorts is reduced to a third of its 1960 level and the gap in years of schooling is cut in half; neither estimate is statistically different from zero. The subsequent columns confirm that the differences in labor market outcomes and the number of children ever born also disappear.Footnote 13 This suggests that catch-up in educational attainment among the female cohorts most exposed to manpower mobilization translated into better labor market outcomes, with no difference in completed fertility by 1970.
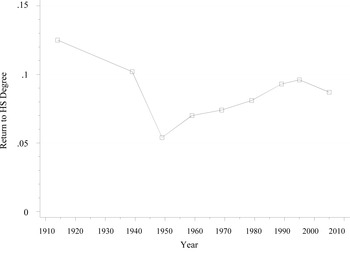
FIGURE 5 RETURNS TO HIGH SCHOOL COMPLETION, 1914–2005
This is consistent with a broad pattern of women returning to school later in life (Westoff and Ryder Reference Westoff and Ryder1970; Davis and Bumpass Reference Davis and Bumpass1976). For evidence that women did return to school after dropping out during World War II, Table 6 tabulates information from the decennial censuses and the 1970 National Fertility Survey. In particular, I report the share of the high school-age cohort of white women during World War II that reported attending school in 1950 and 1960, and the share completing their last year of schooling after 1960. Comparing column 1 of the first two rows in Table 6, the share of the war cohort still attending school is higher in 1950 than in 1960. The subsequent columns, which tabulate the share attending school by birth year, show that school attendance in 1950 was most common among the youngest in the war cohort. Still, more than 2 percent of women born between 1926 and 1931 reported attending school in both 1950 and 1960.
TABLE 5 EXPOSURE TO MOBILIZATION, EDUCATION, WORK, AND FAMILY OUTCOMES IN 1970

Notes:
The outcomes in the first two columns are cohort high school graduation rate and mean years of schooling, respectively. In columns 3 through 5, outcomes are cohort share employed, cohort weeks worked conditional on employment, and (log) average weekly wage conditional on working at least 40 weeks in the previous year. In column 6, the outcome is number of children ever born in 1970. All specifications include state of birth and cohort-fixed effects as well as a state-specific second-order polynomial in year of birth. In all columns, observations are weighted by the number of women used to calculate the dependent variable. Standard errors (in parentheses) are clustered on state of birth.
Source:
Cohort data are constructed from the 1970 IPUMS census sample (Ruggles et al. Reference Ruggles, Alexander, Genadek, Schroeder, Goeken and Sobek2010). The mobilization rate is from the Special Monographs of the Selective Service (U.S. Selective Service System 1948).
TABLE 6 LATER-LIFE SCHOOL ATTENDANCE OF SCHOOL-AGE COHORT DURING WORLD WAR II

Notes:
The first two rows show the share of the high school age cohort during World War II that reported attending school in 1950 and 1960 Censuses. The first column shows the share for all birth years. The next three columns show school attendance share also stratified by birth years. The last two rows report the share of women born between 1926 and 1930 that reported attending school after 1960 and the share intending more school after 1970 from the 1970 National Fertility Survey.
Source:
For the first two rows, the school attendance data are constructed from the 1950 and 1960 IPUMS census sample (Ruggles et al. Reference Ruggles, Alexander, Genadek, Schroeder, Goeken and Sobek2010). For the second two rows, answers are tabulated from the 1970 National Fertility Study (Westoff and Ryder Reference Westoff and Ryder1970).
The third row of Table 6 is calculated from a question in the 1970 National Fertility Survey (“In what year did you last attend high school or college?”) and indicates that 15.8 percent of women who were high school-age during World War II reported completing their highest level of schooling after 1960. The last row shows the share that answered “yes” to the question: “Do you intend to return to school in the future?” For women in the war cohort, 10.6 percent indicated a desire to obtain more schooling after 1970. This evidence, although it does not directly link women's wartime experience to the extent and timing of postwar school attendance, suggests that a large number of women who could have left school during World War II, did return to school later in life.
CONCLUSION
A striking feature of America's human capital century is the sharp drop in high school graduation rates among both men and women during World War II and the subsequent increase in male college completion rates following the GI Bill. While much attention has been paid to the effect of the GI Bill on the college completion of veterans, there is little work that quantifies the extent of the decline in the educational attainment of women, whether the decline was permanent, and the broader impact on female labor market outcomes and family formation decisions.
In this article, I show that the disruption caused by World War II was large and had real consequences in terms of education, work, and family formation. Specifically, I document lower levels of educational attainment among women exposed to manpower mobilization for World War II during their normal years of high school attendance. The impact of the war was large in 1960—at the median exposure rate the effect was equivalent to one woman dropping out of school two years early for every ten new men inducted (or enlisted) into the military—and was accompanied by lower employment and earnings. These findings comport with the dramatic increase in female employment, particularly among those of high school-age, during the war and their subsequent exit from the relatively lucrative jobs in manufacturing at the war's end. In addition to lower rates of labor force participation and earnings, women with greater exposure to mobilization were quicker to start families in the immediate postwar period.
I then show that cross-cohort schooling converged and that the gap from exposure to mobilization was gone by 1970. This is consistent with work by Davis and Bumpass (Reference Davis and Bumpass1976), who find that many women in the postwar period returned to school after marriage. Using the 1950 and 1960 decennial censuses and 1970 National Fertility Survey, I present evidence specific to the war cohort of women that is consistent with many of these women returning to school later in life. This finding also fits the broad pattern of steadily rising returns to schooling and the “quiet revolution” taking place as women learned about the returns to work over the second half of the twentieth century.
Data Appendix
The main data sources used in the empirical analysis are the IPUMS samples of the decennial censuses from 1960 and 1970 (Ruggles et al. Reference Ruggles, Alexander, Genadek, Schroeder, Goeken and Sobek2010) and the Special Monographs of the Selective Service. The census samples are used to construct education and labor market outcomes for cohorts defined by state of birth and year of birth. I drop all individuals not born in the United States as well as individuals born in Alaska, Hawaii, and Washington, DC. I further restrict the census samples to white females born between 1915 and 1931, and not living in group quarters. In some cases, as robustness checks, I also use white females born 1900 to 1914 or those born 1932 to 1935.
The education outcomes are constructed from the IPUMS variable higraded. I first calculate completed years of schooling for each individual using higraded and then use years of schooling to compute cohort averages. Labor market outcomes are constructed from the variables empstat, wkswork2, and incwage. Employment is defined as empstat equal to 1. The variable wkswork2 is intervalled, so I use the midpoint of each interval to calculate a continuous measure of weeks worked. The weeks worked measure is constructed conditional on empstat equal to 1. The weekly wage rate is calculated by dividing incwage by the constructed weeks worked variable, conditional on at least 40 weeks worked. Finally, age at first marriage is calculated from agemarr, conditional on marst indicating a woman was married, and the number of children ever born is calculated using chborn.
APPENDIX TABLE 1 DATE RANGES USED TO CONSTRUCT MOBILIZATION EXPOSURE VARIABLE

The measure of exposure to mobilization is calculated from the total number of registrants, monthly induction counts, and periodic enlistment data, and then by state tabulated in the Quotas, Calls, and Inductions volumes of the Selective Service monographs. All data are tabulated in Volume II of Quotas, Calls, and Inductions. The number of registrants is from the first, second, third, fifth, and sixth registrations, which included all registrants below the age of 45 through December 31, 1945 (p. 1). Inductions are the number of inductions in each month between November 1940 and December 1945 (pp. 43–63). Enlistment data are the number of enlistments as of December 1941 until September 1945 (pp. 126–34).
For each year the Selective Service was in place, I sum the number of inductions and enlistments in that year. Appendix Table 1 shows the date ranges for inductions and enlistments used to calculate the mobilization exposure variable in each year. Two features of Appendix Table 1 are noteworthy. First, inductions in November and December of 1940 are included in the exposure variable for 1941. Monthly induction data were only available starting in July 1941. Before July, inductions were tabulated as the sum between November 1940 and June 1941. Second, exposure in 1943 and 1944 is not based on the calendar year because enlistment data were only available as of September 1, 1943, whereas in the other years enlistment data was available as of December 1. This measurement issue is not problematic since inductions accounted for the vast majority of new additions to the military after 1942 (U.S. Selective Service System 1948, pp. 32–33).