


The role of vitamin D in skeletal growth and development is established. An increasing body of observational studies provides evidence on a possible link between inadequate vitamin D status and chronic conditions such as CVD, diabetes and asthma( Reference Holick 1 , Reference Thacher and Clarke 2 ). This may be particularly important in adolescence, since this is a critical period for growth and development characterised by increasing requirements for minerals and vitamins as well as a period of intense social and behavioural changes. There have been a number of studies on the predictors of vitamin D deficiency in adults and young children( Reference Tolppanen, Fraser and Fraser 3 – Reference Elizondo-Montemayor, Ugalde-Casas and Serrano-González 8 ) but information on vitamin D status and its predictors in adolescents is limited( Reference Weng, Shults and Leonard 5 , Reference Dong, Pollock and Stallmann-Jorgensen 6 , Reference González-Gross, Valtuena and Breidenassel 9 , Reference Valtueña, Breidenassel and Folle 10 ).
Of particular interest is the association of adiposity with vitamin D. There seems to be some uncertainty in the literature regarding this issue. A number of studies have shown a strong negative linear association between BMI and vitamin D level, mainly in children( Reference Dong, Pollock and Stallmann-Jorgensen 6 , Reference Lenders, Feldman and Von Scheven 11 , Reference Rajakumar, de las Heras and Chen 12 ), while in other studies no such association was identified( Reference Tolppanen, Fraser and Fraser 3 , Reference Weng, Shults and Leonard 5 , Reference González-Gross, Valtuena and Breidenassel 9 ). Many of these studies have restricted their investigation to the obese( Reference Lenders, Feldman and Von Scheven 11 , Reference Garanty-Bogacka, Syrenicz and Goral 13 ) and unfortunately some did not adjust for known confounding factors such as gender, sun exposure and physical activity( Reference Poopedi, Norris and Pettifor 4 , Reference González-Gross, Valtuena and Breidenassel 9 ).
BMI is a widely used measure of adiposity; nevertheless, body fat percentage (BF%), as estimated by the bio-impedance technique, is a better measure of adipose tissue per se and avoids the confounding caused by bone and muscle mass( Reference Prentice and Jebb 14 ). BF% correlates well with BMI in children aged 6–9 years but exhibits a reduced degree of correlation with BMI in adolescents, in boys and at the extremes of BMI( Reference Widhalm, Schönegger and Huemer 15 ). To date, only a handful of studies have investigated the nature of the association of both adiposity indices (BMI and BF%) with vitamin D in healthy adolescents across the whole spectrum of adiposity, with some however not adjusting for the effect of potential confounders( Reference Weng, Shults and Leonard 5 , Reference Dong, Pollock and Stallmann-Jorgensen 6 , Reference González-Gross, Valtuena and Breidenassel 9 ).
The present study aimed to: (i) assess serum vitamin D levels and status in adolescents in Cyprus, located in the Eastern Mediterranean region at latitude of 35°N; (ii) indentify predictors of compromised vitamin D in this geographical setting; and (iii) more specifically, explore the nature of the association of vitamin D with BMI and BF%.
Methods
Study population
The participants in the present study were a sample of adolescents aged 16–18 years who did not report any wheezing or asthma ever (on the International Study of Asthma and Allergies in Childhood (ISAAC) questionnaire) in a previous large, school-based study on risk factors for asthma( Reference Yiallouros, Savva and Kolokotroni 16 ). A stratified random sampling approach was used in order to increase the probability of selection of children at the extremes of BMI change between childhood and adolescence, in line with the scope of a different study. For the purposes of the present study, we focused only on the non-asthmatic population because in the original study asthmatic adolescents were purposely over-represented as a result of the sampling method. The final sample here consisted of 671 non-asthmatic adolescents (response rate 72 %) who attended the hospital nearest to their residence in three districts of the island of Cyprus (Nicosia, Limassol and Larnaca) between November 2007 and May 2008. They fasted for 12 h before the appointment and underwent blood sampling, anthropometric measurements and questionnaire assessments of physical activity levels, dietary intake of vitamin D and sun exposure. Parental education was also recorded and the highest level of educational attainment between the two parents was used as a proxy for socio-economic status. The study was approved by the Cyprus National Bioethics Committee, and consent was obtained in writing from the parents or guardians as well as the children themselves upon arrival at each centre.
Measurement of serum 25-hydroxyvitamin D
Blood specimens were centrifuged at the collection site and serum aliquots were stored at −80 °C and subsequently transferred in dry ice to the Research Laboratory of the University of Athens Medical School at Attikon Hospital. Serum levels of 25-hydroxyvitamin D were measured using the enzyme immune assay kit of Immunodiagnostics Systems Ltd, UK. The intra- and inter-assay CV were <12 %.
Anthropometric measurements
We measured weight, BF% and BMI with the use of a portable device (TBF-300 Body Composition Analyser; Tanita Corporation of America, Inc., Arlington Heights, IL, USA) while height was assessed using a portable stadiometer (Seca 208; Vogel & Halke GmbH & Co., Hamburg, Germany) to the nearest centimetre. Measurements were taken in the morning with the participant dressed in light clothing, without shoes. If two measurements differed by more than 0·5 kg for weight or 1 cm for height, a third measurement was taken.
Assessment of physical activity
Physical activity was evaluated with the short version of the International Physical Activity Questionnaire (IPAQ), which assesses three types of activity: walking, moderate-intensity activities and vigorous-intensity activities( Reference Hagströmer, Bergman and De Bourdeaudhuij 17 ). Data collected with IPAQ were processed according to the guidelines classifying each participant's physical activity as low, moderate or high( 18 ).
Sun exposure and skin type
Sun exposure was assessed as self-reported time spent daily in the sun during weekends and holidays for the past 3 years during the winter or summer months, recorded as hours per day in increments of 1 h/d to a maximum of 4 h/d( Reference Jones, Blizzard and Riley 7 , Reference Dwyer, Blizzard and Gies 19 ). In addition, the participants’ habitual use of sun protection (use of sun block creams, clothing, hats) when out in the sun in the summer was recorded as never/rarely, occasionally, most of the time and always/almost always. Finally, trained research assistants classified the participants’ skin type as dark, olive, olive/medium, medium/fair and fair.
Dietary intake of vitamin D
We assessed dietary food intake with the use of a food frequency recall questionnaire (FFQ) adapted to the Greek cuisine( Reference Chatzi, Melaki and Sarri 20 ). The questionnaire recorded the frequency of consumption of foods over the preceding 3 months (per day, week and month) and included food items from twenty-one food categories including cereals, dairy products, meat, fruit and vegetables and dietary supplements. Foods that are a good source of vitamin D such as oily fish and eggs were included in the FFQ. Dietary intake of vitamin D was calculated based on the questionnaire data and using local food composition tables.
Statistical analysis
Vitamin D status was classified as severe deficiency (serum 25-hydroxyvitamin D <12 ng/ml), deficiency (12–20 ng/ml), insufficiency (20–30 ng/ml) and sufficiency (≥30 ng/ml)( Reference González-Gross, Valtuena and Breidenassel 9 ). The association of mean vitamin D levels and vitamin D deficiency status with potential predictors was investigated in linear and logistic regression models, respectively. Multivariable regression models were used to explore the association between vitamin D and BMI and BF%, while adjusting for seasonality and potential confounders. Specifically, β coefficients of differences in mean vitamin D levels and odds ratios of vitamin D deficiency and insufficiency status were calculated across categories of gender-standardised Z-scores of BMI and BF%, adjusting for seasonality (model 1) and further adjusting for skin type, sun exposure in winter, use of sun protection, physical activity and dietary intake of vitamin D (model 2). In contrast to BMI, there are no generally used percentile charts for BF%; thus, for both measures of adiposity, we calculated gender-standardised Z-scores and contrasted five categories using the middle category as the reference, i.e. ≤−1, −1 to −0·5, −0·5 to 0·5, 0·5 to 1 and ≥1. In all analyses normalised sampling weights based on inverse probability of selection from the original population were used. Statistical analysis was performed using the statistical software package PASW 18.
Results
Population characteristics
Table 1 presents the participant characteristics along with the unadjusted associations of vitamin D levels and vitamin D deficiency status with potential predictors. Among participants, 42·8 % were male and on average they were 17·0 (sd 0·6) years old (range 15·7–18·4 years). The most frequent skin type was olive/medium (69·5 %) with medium/fair (24·9 %) ranking second. As expected, sun exposure was more frequent in the summer with as many as 30·6 % reporting being exposed to the sun for longer than 4 h/d during a weekend or holiday as opposed to only 6·0 % in the winter. Sun protection was reportedly used systematically by only a small proportion of the participants (16·6 %), while as many as 24·7 % reported using rarely or never. Median level of dietary vitamin D intake was as low as 4·1 μg/d (interquartile range 3·1–6·0 μg/d). Finally, more than half of the participants reported low levels of physical activity (52·9 %).
Table 1 Association of serum vitamin D (25-hydroxyvitamin D) levels and vitamin D deficiency with potential predictors among 671 adolescents aged 16–18 years, Cyprus, November 2007–May 2008
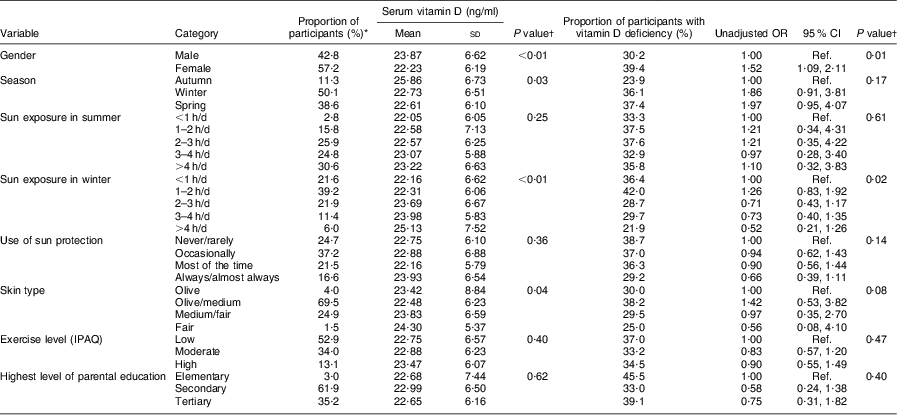
IPAQ, International Physical Activity Questionnaire; Ref., referent category.
*There were twenty-four missing values in the case of exercise and thirty-one in the case of education; for all other variables, missing values were between zero and three.
†With the exception of gender where P value for the difference is reported, in all other cases P value for the linear trend is reported.
Vitamin D status
Vitamin D values were normally distributed, with a mean value as low as 22·90 (sd 6·41) ng/ml (range 5·80–49·00 ng/ml). As shown in Fig. 1, the prevalence of vitamin D severe deficiency, deficiency and insufficiency was 4·0 %, 31·7 % and 51·2 %, respectively, whereas only about one in ten children had sufficient vitamin D levels (13·1 %). As expected for individuals living in the northern hemisphere, mean serum vitamin D level (see Fig. 2) was higher in November and decreased gradually over the winter months to reach the lowest level in February. With the exception of a slight dip in May (based on only thirty-six participants), mean vitamin D level started to increase gradually over the spring months, revealing a U-shaped pattern across the 7-month study period.
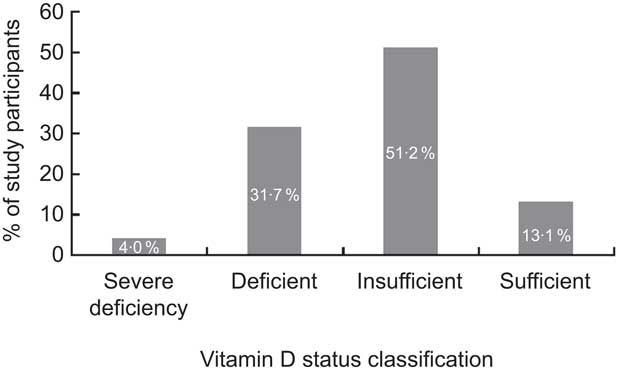
Fig. 1 Prevalence of inadequate vitamin D status (based on serum 25-hydroxyvitamin D levels: severe deficiency, <12 ng/ml; deficiency, 12–20 ng/ml; insufficiency, 20–30 ng/ml; sufficiency, ≥30 ng/ml) among 671 adolescents aged 16–18 years, Cyprus, November 2007–May 2008
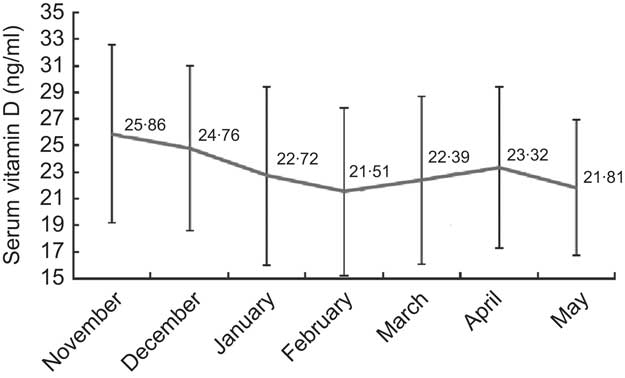
Fig. 2 Seasonal variation of serum vitamin D (25-hydroxyvitamin D) levels during the study period among 671 adolescents aged 16–18 years, Cyprus, November 2007–May 2008. Values are means with their standard deviations represented by vertical bars
Predictors for lower vitamin D levels and deficiency status
Mean vitamin D level was lower in girls than boys (22·23 v. 23·87 ng/ml; P < 0·01) and significantly higher in autumn compared with winter and spring seasons (25·86 v. 22·73 and 22·61 ng/ml, respectively; P = 0·03; see Table 1). Higher self-reported sun exposure in winter, but not in summer, was associated with increased vitamin D levels (P value for linear trend <0·01), while participants with darker skin type tended to have lower vitamin D levels than those with lighter skin (P value = 0·04). Use of sun protection, physical activity levels, parental education and dietary vitamin D intake were not significantly associated with levels of vitamin D. When expressed as vitamin D deficiency (i.e. the proportion of participants with vitamin D levels 12–20 ng/ml), a similar pattern was observed in terms of gender, season of blood sampling, sun exposure in winter and skin type (see Table 1). In this case, associations did not always reach statistical significance with the exception of gender, where the odds of vitamin D deficiency in females compared with males was OR = 1·52 (95 % CI 1·09, 2·11). The risk of vitamin D deficiency remained significantly raised in females compared with males even after adjusting for BMI (OR = 1·44; 95 % CI 1·02, 2·03; data not shown).
Association of vitamin D levels and deficiency status with BMI and body fat percentage
Vitamin D levels and vitamin D deficiency or insufficiency across gender-standardised BMI and BF% Z-score categories are shown in Table 2. The corresponding cut-off values for the gender-specific BMI and BF% Z-score categories are presented in Table 3. Mean vitamin D level among those with BMI and BF% Z-score ≥1 was 3·16 ng/ml (95 % CI −4·76, −1·56 ng/ml) and 2·65 ng/ml (95 % CI −4·29, −1·02 ng/ml) lower than that of the reference group (i.e. those with Z-score between −0·5 and 0·5), respectively. Adolescents in the low BMI and BF% Z-score categories also seemed to have lower mean vitamin D levels when compared with the reference category although estimates were not statistically significant. Estimates remained largely unchanged after adjusting for other covariates in multivariable models.
Table 2 Association of serum vitamin D (25-hydroxyvitamin D) levels, vitamin D deficiency and vitamin D insufficiency with BMI and body fat percentage (BF%) among 671 adolescents aged 16–18 years, Cyprus, November 2007–May 2008
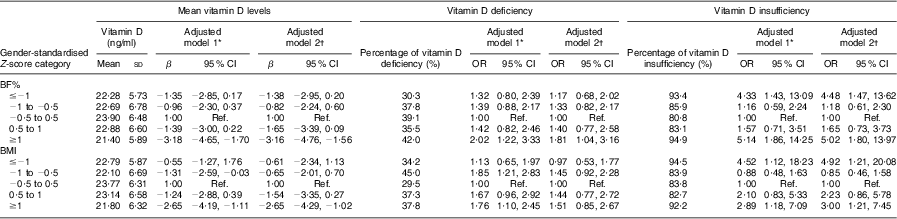
β, β coefficient; Ref., reference category.
*Adjusted model 1: seasonality (month and month2).
†Adjusted model 2: seasonality (month and month2), sun exposure in winter, use of sun protection, skin type, physical activity levels and dietary intake of vitamin D.
Table 3 Cut-off values for the corresponding BMI and body fat percentage (BF%) Z-score categories, stratified by gender, among 671 adolescents aged 16–18 years, Cyprus, November 2007–May 2008
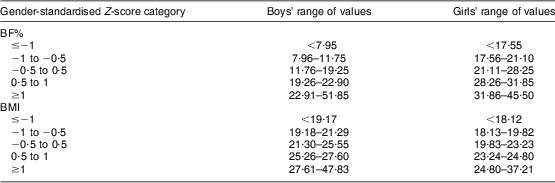
BMI cut-off values in kg/m2; BF% cut-off values in %.
In the case of vitamin D status, the season-adjusted odds for vitamin D deficiency among those with BF% Z-score ≥1 (as compared with the reference group) was OR = 2·02 (95 % CI 1·22, 3·33) and, although it attenuated slightly after adjusting for all confounders, it remained statistically significant (OR = 1·81; 95 % CI 1·04, 3·16). Likewise, adolescents with BMI Z-score ≥1 seemed to be 1·7 times more likely to be vitamin D deficient (OR = 1·76; CI 1·10, 2·45). Nevertheless, in the case of BMI, the association was no longer statistically significant in the adjusted model (OR = 1·51; CI 0·85, 2·67). As with mean vitamin D levels analysis, participants in the low BMI and BF% Z-score categories appeared to have compromised vitamin D levels albeit non-significant when compared with those in the reference group (Table 2). Similarly, results are not so striking for vitamin D deficiency. However, in terms of vitamin D insufficiency there was a clearer U-shaped pattern with both measures of adiposity and statistically significant increased odds of hypovitaminosis when moving towards both ends of the adiposity scale. Participants with BF% lower or higher than 1 sd v. their gender-specific average had at least four times higher odds of vitamin D insufficiency (OR = 4·48; 95 % CI 1·47, 13·62 and OR = 5·02; 95 % CI 1·80, 13·97, respectively). Similar findings were revealed in the case of BMI, where the odds of hypovitaminosis in the lowest and highest BMI categories was OR = 4·92 (95 % CI 1·21, 20·08) and OR = 3·00 (95 % CI 1·21, 7·45), respectively. It is worth noting that effect estimates of the association of BMI/BF% with vitamin D levels/status attenuated only slightly after adjusting for important confounders such as sun exposure in winter, dietary vitamin D intake, use of sun protection, seasonality, skin type and physical activity levels, but generally remained statistically significant. This is not surprising since, as can be seen in Table 4, the distribution of all the variables mentioned above, with the exception of dietary vitamin D intake, did not seem to differ significantly across the BMI/BF% categories. In contrast, median levels of vitamin D intake across the BMI/BF% categories seemed to mirror the observed pattern of association between serum levels of vitamin D and adiposity measures even though they cannot totally explain it.
Table 4 Association of BMI and body fat percentage (BF%) with participant characteristics that could act as confounders in the association of adiposity with vitamin D among 671 adolescents aged 16–18 years, Cyprus, November 2007–May 2008
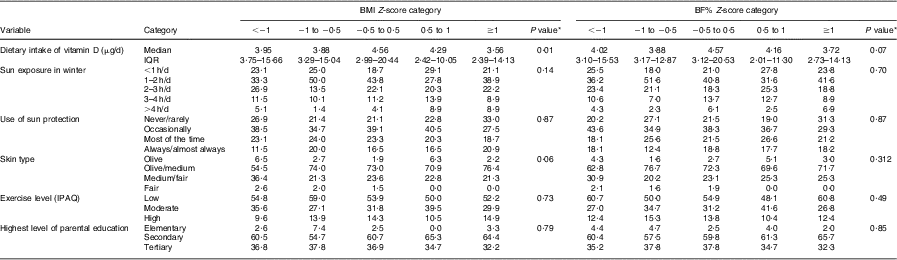
IPAQ, International Physical Activity Questionnaire; IQR, interquartile range.
*With the exception of dietary vitamin D intake where P value for the difference in median values is reported using non-parametric tests, in all other cases P value for the linear trend across categorical variables is reported using the χ 2 test.
Discussion
Main findings
In the present cross-sectional study, we have shown that one in three adolescents is vitamin D deficient in a sunny place like Cyprus while only one in ten seems to have a sufficient vitamin D level. Female gender, darker skin type and low sun exposure in winter are significant predictors of lower mean vitamin D levels and deficiency status. Adolescents with the highest BMI and BF% have statistically significantly lower vitamin D levels and increased odds for vitamin D deficiency and insufficiency, which does not appear to be explained by sun exposure or dietary intake of vitamin D. Quite interestingly, we also found that irrespective of the measure of adiposity used those in the lowest BMI and BF% categories also appear more likely to be vitamin D insufficient.
Vitamin D levels and status
It is now widely accepted that vitamin D deficiency is becoming a public health problem worldwide( Reference Poopedi, Norris and Pettifor 4 – Reference Dong, Pollock and Stallmann-Jorgensen 6 , Reference González-Gross, Valtuena and Breidenassel 9 , Reference Rajakumar, de las Heras and Chen 12 , Reference Al-Othman, Al-Musharaf and Al-Daghri 21 ) and has been shown to be important even in countries with abundant sun exposure( Reference Poopedi, Norris and Pettifor 4 , Reference Dong, Pollock and Stallmann-Jorgensen 6 , Reference Al-Othman, Al-Musharaf and Al-Daghri 21 , Reference Levis, Gomez and Jimenez 22 ). In the present study vitamin D levels were measured mostly over the winter and spring months and, as a result, possibly capture the lowest end of the spectrum. Nevertheless, mean vitamin D levels among Cypriot adolescents appear comparable to those reported in a recent multi-centre European study in adolescents (the Healthy Lifestyle in Europe by Nutrition in Adolescence (HELENA) Study)( Reference González-Gross, Valtuena and Breidenassel 9 ) which however included participants from a wider age spectrum and a number of Northern European countries. Findings are also consistent with those reported in a study of adolescents from the island of Crete who had their vitamin D levels measured over the winter season( Reference González-Gross, Valtuena and Breidenassel 9 ). Elsewhere, in other sunny parts of the world, vitamin D deficiency is also becoming more prevalent. In Brazil, adolescents were shown to have mean vitamin D levels just above the deficiency cut-off point while the prevalence of vitamin D insufficiency was as high as 60 %( Reference Peters, dos Santos and Fisberg 23 ). Similarly, a study in Beirut showed that one in two children aged 10–16 years was vitamin D insufficient( Reference Fuleihan, Nabulsi and Choucair 24 ), while in Qatar the prevalence of vitamin D deficiency this age group appeared to be over 60 % during the autumn and winter period( Reference Bener, Al-Ali and Hoffmann 25 ). Thus our findings confirm that vitamin D deficiency is also becoming very prevalent in the Mediterranean region, at least during the winter months( Reference González-Gross, Valtuena and Breidenassel 9 ).
Predictors of vitamin D levels and status
Monthly mean levels of vitamin D have been described to follow a sinusoidal pattern throughout the year, generally peaking at the beginning of autumn and displaying the lowest values at the beginning of spring in the northern hemisphere( Reference Shoben, Kestenbaum and Levin 26 ). This is largely consistent with the pattern observed over the 6-month period in the present study, which shows vitamin D levels declining steadily over the winter months to reach the lowest values around February, when they start rising again over the spring months. Also consistent with the literature, females were shown to be at increased risk of inadequate vitamin D status( Reference Tolppanen, Fraser and Fraser 3 , Reference Dong, Pollock and Stallmann-Jorgensen 6 , Reference McCarthy, Cole and Fry 27 , Reference Harkness and Cromer 28 ). As expected, we found lower vitamin D levels among those with darker skin complexions as well as those reporting spending less time in the sun in winter. In contrast, no similar association was observed with reported sun exposure in the summer, as perhaps even short exposure to the sun during the summer is sufficient to synthesise adequate levels of vitamin D( Reference Holick and Jenkins 29 ). Surprisingly, frequent use of sun protection did not seem to affect vitamin D levels significantly. If anything, it seemed that vitamin D levels were higher among those who reported more frequent use. This has also been described in a study of 7500 children aged 7–13 years in the UK( Reference Tolppanen, Fraser and Fraser 3 ) and was attributed to the fact that children who use sun protection tend to spend more time outdoors. Finally, vigorous activity and fitness have been shown in previous studies to be positively associated with vitamin D levels( Reference Dong, Pollock and Stallmann-Jorgensen 6 , Reference Jones, Blizzard and Riley 7 ). We did not observe such an association; however, the data used in our study did not refer to fitness levels but to intensity of physical activity, which in previous studies has not always been found to correlate with vitamin D status( Reference Jones, Blizzard and Riley 7 , Reference Elizondo-Montemayor, Ugalde-Casas and Serrano-González 8 ).
Association of BMI and body fat percentage with vitamin D levels and status
Irrespective of the adiposity measure used, serum vitamin D levels appeared lower by an average of 2–3 ng/ml among those in the higher Z-score categories. For BMI, similar results have been reported previously( Reference Elizondo-Montemayor, Ugalde-Casas and Serrano-González 8 , Reference Rajakumar, de las Heras and Chen 12 ). For instance, a study of 237 children in the USA compared levels between obese (BMI >95th percentile) and non-obese children aged 8–18 years and reported a difference in the range of 3·3 ng/ml( Reference Rajakumar, de las Heras and Chen 12 ). Similarly, a recent study by Oliveira et al., which investigated vitamin D levels in 160 normal-weight and overweight adolescents aged 15–17 years in Brazil, showed that serum vitamin D levels were significantly lower among overweight compared with normal-weight adolescents and in those with excess fat mass( Reference Oliveira, Novaes and Azeredo 30 ). Furthermore, the odds of vitamin D deficiency and insufficiency were raised significantly in the higher BMI and BF% Z-score categories, which include those with BMI and BF% values above the 85th and/or 95th percentile as compared with the Center for Disease Control and Prevention BMI charts and published body fat reference curves in children (Table 3)( Reference McCarthy, Cole and Fry 27 ). Vitamin D inadequacy among obese individuals of all ages including adolescents has been described by several studies( Reference Garanty-Bogacka, Syrenicz and Goral 13 , Reference Alemzadeh, Kichler and Babar 31 – Reference Harel, Flanagan and Forcier 33 ). This is attributed to the decreased bioavailability of vitamin D in the obese due to sequestration in body fat stores( Reference Wortsman, Matsuoka and Chen 34 ). Indeed, slightly stronger associations were observed with respect to BF% since this is a better indicator of adiposity in the high BMI range. These associations did not seem to be confounded by sun exposure, physical activity and dietary intake of vitamin D. Similar to our results, daily sunscreen use and duration of physical activity in sunlight did not seem to differ across vitamin D levels and between adolescents with and without excess fat in the Brazilian study and therefore could not explain the observed vitamin D–adiposity association( Reference Oliveira, Novaes and Azeredo 30 ). This finding is also consistent with studies with elderly and young adult populations( Reference Harris and Dawson-Hughes 35 – Reference Chacko, Song and Manson 37 ).
The negative association of vitamin D with high BMI and body fat measures is well documented and appears to be more or less consistent across studies in different age groups( Reference Lenders, Feldman and Von Scheven 11 , Reference Jungert, Roth and Neuhauser-Berthold 36 ). Nevertheless, evidence on the association of vitamin D with adiposity measures beyond the obese status and across the BMI range is conflicting. For example, a cross-sectional study of 559 adolescents aged 14–18 years in the USA has shown a small inverse linear relationship between serum vitamin D levels and total fat mass assessed by dual-energy X-ray absorptiometry( Reference Dong, Pollock and Stallmann-Jorgensen 6 ) while, in contrast, a study in adolescent girls( Reference Foo, Zhang and Zhu 38 ) did not find any association. Similarly, Tolppanen et al. found no association between BMI and vitamin D deficiency status after adjusting for possible confounders( Reference Tolppanen, Fraser and Fraser 3 ) while in a study of 382 healthy children and adolescents in the USA fat mass was not independently associated with vitamin D status( Reference Weng, Shults and Leonard 5 ). In the multi-centre HELENA study, an overall small to moderate negative correlation of BMI Z-score with vitamin D concentration was observed while, in contrast, vitamin D was shown to be positively associated with body fat in girls( Reference Valtuena, Gonzalez-Gross and Huybrechts 39 ). The fact that there is no consensus on the relationship of vitamin D with adiposity measures in general population studies might suggest differences in the association across the spectrum of adiposity.
In the present study, we have observed that the lowest Z-score category of either measure of adiposity seems to also be at a high risk of vitamin D insufficiency, and in fact the effect appears comparable to that in the obese. Similarly, a population study of 1766 adults over 65 years of age in England reported significantly higher odds of vitamin D deficiency in people with BMI < 25·0 kg/m2( Reference Hirani and Primatesta 40 ). In the HELENA study, underweight adolescent girls (BMI < 18·5 kg/m2) had lower vitamin D levels compared with all other BMI categories including the obese. In fact, the authors of the study provided evidence to suggest that there is an interaction between BMI and physical fitness since both boys and girls with low BMI (<18·5 kg/m2) and lower physical fitness seemed to have more compromised vitamin D status( Reference Valtueña, Gracia-Marco and Huybrechts 41 ). Furthermore, in a study examining the bioavailability of vitamin D in adolescent girls with normal BMI and those with anorexia nervosa, vitamin D was not correlated with body fat measures( Reference DiVasta, Feldman and Brown 42 ).
Our findings suggest a possible U-shaped pattern of association of BMI and BF% with vitamin D which becomes more pronounced in the case of vitamin D insufficiency. This association holds even after adjusting for potential confounders such as sun exposure, skin type, use of sun protection, physical activity, parental education and vitamin D intake. Vitamin D intake seemed to reflect the lower vitamin D status in the lower and higher BMI/BF% categories but could not totally explain the U-shaped association. Of course, there is always the possibility of residual confounding (especially due to the self-reported nature of many of the variables considered), as well as the potential contribution of variables not considered here, such general health status. Indeed, the U-shaped pattern in the association between adiposity and vitamin D status as described in our study mirrors the pattern observed between BMI or BF% and mortality or morbidity for a number of diseases in all age groups, including adolescents( Reference Bjørge, Engeland and Tverdal 43 – Reference Baumgartner, Heymsfield and Roche 45 ). Baumgartner et al. in their review report the lack of studies on the relationship of low BMI and BF% with morbidity and mortality( Reference Baumgartner, Heymsfield and Roche 45 ) and comment on the fact that reported associations between underweight and chronic diseases often do not have a plausible physiological explanation. In the case of vitamin D, a possible explanation behind the increased risk of hypovitaminosis in the underweight and obese could be its reduced bioavailability at the extremes of BMI. More specifically, it has been shown that in individuals with BMI > 25·0 kg/m2, there is a strong negative correlation between peak serum vitamin D and increasing BMI after ingestion of vitamin D( Reference Wortsman, Matsuoka and Chen 34 ). In contrast, in individuals in the BMI range <25·0 kg/m2, peak serum levels of vitamin D seem to be increasing with increasing BMI and/or BF%( Reference DiVasta, Feldman and Brown 42 ). Nevertheless, further longitudinal studies are needed to investigate the behaviour and role of vitamin D beyond the normal weight and body fat spectrum, especially in the underweight population.
The study findings underline the need for health professionals to be aware of the high prevalence of inadequate vitamin D status in sunny places especially in winter and the individual characteristics of people at risk. In terms of clinical practice, children should be encouraged to practise safe sun exposure (i.e. sun exposure under UV index <3) to avoid increasing risk for skin cancer and whenever this is not enough to maintain sufficient vitamin D levels, vitamin D supplements or food fortification might be appropriate.
Limitations
The present study is the first prevalence study of inadequate vitamin D status among Cypriot adolescents. No causal inferences can be made with regard to the role of any of the factors studied in the development of vitamin D deficiency due to the cross-sectional design of the study. Nevertheless, the observed associations are largely supported by the physiology of vitamin D synthesis and are consistent with the findings of previous studies in other age groups and populations( Reference Tolppanen, Fraser and Fraser 3 , Reference Weng, Shults and Leonard 5 , Reference Jones, Blizzard and Riley 7 , Reference Levis, Gomez and Jimenez 22 ). The fact that self-reported measures of sun exposure and physical activity levels were used is also a limitation, even though this is not uncommon in most previous studies. Furthermore, the sample was drawn from a cohort of adolescents that excluded those with wheezing symptoms and asthma diagnosis, and thus it is not entirely representative of the general population. Nevertheless, asthmatics have been shown to have lower levels of vitamin D than non-asthmatics( Reference Bozzetto, Carraro and Giordano 46 ). Hence, the prevalence of vitamin D status reported here may in fact be an underestimate of the prevalence in the general population. Finally, parental education was used as a proxy for socio-economic status due to lack of alternative indicators; nevertheless, this has been shown to have a comparable association with vitamin D level as other socio-economic indicators( Reference Tolppanen, Fraser and Fraser 3 ).
There are also a number of strengths in the present study. First, two adiposity indicators, BMI and BF%, were used to investigate the association of adiposity with vitamin D levels and status. Furthermore, we looked at this association across the whole spectrum of adiposity. Previous studies have generally either looked at this association among the obese only( Reference Lenders, Feldman and Von Scheven 11 , Reference Garanty-Bogacka, Syrenicz and Goral 13 , Reference Alemzadeh, Kichler and Babar 31 ), while studies that have expanded their investigation beyond the high end of the spectrum have included underweight individuals within the BMI < 25·0 kg/m2 category or assumed that the relationship is linear( Reference Tolppanen, Fraser and Fraser 3 – Reference Dong, Pollock and Stallmann-Jorgensen 6 , Reference Oliveira, Novaes and Azeredo 30 , Reference Foo, Zhang and Zhu 38 ). The present study has specifically looked at vitamin D status at the lower end of the BMI/BF% spectrum and has provided evidence that people within the lower end of adiposity might also have compromised vitamin D levels.
Conclusion
Vitamin D deficiency is an important public health problem even in sunny places like Cyprus. Our study has confirmed that female gender, darker skin type, low sun exposure and obesity are significant predictors of lower vitamin D levels in adolescents, in line with findings from previous studies. Furthermore, the study has provided evidence to suggest that individuals in the lowest BMI and BF% categories also appear more likely to be vitamin D insufficient and proposed a U-shaped association between vitamin D and adiposity measures, a novel finding that merits further investigation.
Acknowledgements
Sources of funding: This work was co-funded by the European Regional Development Fund and the Republic of Cyprus through the Cyprus Research Promotion Foundation (Project YΓEIA/▵YΓEIA/0308(BIE)/22). The sponsors had no role in the design, analysis or writing of this article. Conflict of interest: The authors have no conflict of interest to report. Ethics: The study was approved by the Cyprus National Bioethics Committee. Authors’ contribution: O.K. coordinated the study, performed the statistical analysis and prepared the first draft of the manuscript. P.K.Y. conceived of and designed the study and secured the funding through the Cyprus Research Promotion Foundation. A.P. supervised analysis of the vitamin D samples and assisted in the coordination of the study. P.K.Y. and N.M. assisted in drafting and revising the manuscript. N.M. is the main PhD advisor of the first author (O.K.). P.Y., V.R. and C.K. are members of the PhD advisory committee and were involved in the overall supervision of the study. D.L. advised with the statistical analysis. P.N. and A.P. critically revised the manuscript. All authors have read and approved the final version of the manuscript.


