Introduction
An ageing European population coupled with the recent financial crisis has increased the urgency with which governments are implementing reforms such as raising statutory pensionable ages (SPA) and retrenching early retirement benefits. These policies are aimed at raising the European Union's average age of permanent labour market exit which is currently 61.4 (Eurostat 2011). These reforms are more likely to raise the low employment rates of older people (Blossfeld, Buchholz and Kurz Reference Blossfeld, Buchholz and Kurz2011; Duncan Reference Duncan2003; Hotopp Reference Hotopp2005; Roberts Reference Roberts2006) if they are accompanied by measures that enhance employability by raising productivity. One such measure is to invest in the training of older people which will help their job prospects (De Grip and van Loo Reference De Grip and van Loo2002; Thomson et al. Reference Thomson, Dawe, Anlezark and Bowman2005; Wooden et al. Reference Wooden, Van den Heuvel, Cully and Curtain2001; Zeytinoglu, Cooke and Harry Reference Zeytinoglu, Cooke and Harry2007). The pace of technological change has also increased the need for older people to retrain. In this context it is useful to consider the training participation rates of older people and the extent to which these vary across different national settings.
Previous research indicates that there is scope for increasing the training participation of older people as training rates decline with age (Bassanini et al. Reference Bassanini, Booth, Brunello, de Paola and Leuven2005; Cheung and McKay Reference Cheung and McKay2010; Felstead Reference Felstead, Parry and Tyson2011, Reference Felstead2010; O'Mahony and Peng Reference O'Mahony and Peng2008; McNair and Flynn Reference McNair and Flynn2005; Taylor and Urwin Reference Taylor and Urwin2001; Urwin Reference Urwin2006). However, the extent to which this is due to age-specific factors remains unclear. This is because age-training profiles do not control for other confounding factors such as education, skill, hours of work, industry and occupation. This is important as training incidence is lower among some groups and sectors where older workers, particularly those who have been displaced, are over-represented, for example those with the least formal educational qualifications and part-time workers (Bassanini et al. Reference Bassanini, Booth, Brunello, de Paola and Leuven2005; Cully et al. Reference Cully, Vanden-Heuvel, Wooden and Curtain2000; Felstead Reference Felstead, Parry and Tyson2011; Wooden et al. Reference Wooden, Van den Heuvel, Cully and Curtain2001). Differences in national education and welfare systems are also likely to impact on the training participation of older people (Blossfeld, Buchholz and Kurz Reference Blossfeld, Buchholz and Kurz2011) but little cross-country analysis of age-training gaps has been undertaken. There is also limited evidence on the training of older non-workers, yet this group may be most in need of (re)training. Furthermore, not all training raises productivity and skills to the same extent (Felstead Reference Felstead2010, Reference Felstead, Parry and Tyson2011; Urwin Reference Urwin2006). Therefore, age-related research is needed on other aspects of training such as duration, intensity, work-relatedness and employer support (Zeytinoglu, Cooke and Harry Reference Zeytinoglu, Cooke and Harry2007).
This study addresses the shortcomings highlighted above by including non-workers, multiple confounding factors and all 15 European Union countries that were member states prior to the 2004 enlargement (EU-15). We also extend the current analysis by examining different dimensions of training, specifically: work-relatedness, occurrence during work-hours and time in training. The analysis is carried out using the European Union Labour Force Survey (EU-LFS) covering four years (2004–07) and consisting of approximately 1.8 million non-working and 3 million working respondents.
Our results indicate that across the EU-15 not only are older people less likely to be involved in any kind of training, they are also less likely to participate in training that is work-related or undertaken during work-hours. The duration of training they do is also likely to be shorter. These age-based training gaps are found to be larger among non-workers and this is likely to be particularly problematic for older workers who lose their jobs.
In the next section we discuss the main issues that have emerged from previous research on the determinants of age-training gaps. The following sections describe the dataset, the empirical model and the results. The final section summarises the main findings and outlines some policy implications.
Previous research on the determinants of age-training gaps
Lower training rates among older people are usually explained in terms of human capital theory (Becker Reference Becker1964). Theory predicts that the returns to human capital investments are lower for older workers because productivity and wage gains are experienced for a shorter time owing to the proximity of retirement. Therefore, older people will have less incentive to train and employers less incentive to invest in their training. As such, lower training rates among older people are consistent with predictions of human capital theory. One interpretation is that lower acceptance rates for training offers among older workers reflect entirely rational behaviour (O'Mahony and Peng Reference O'Mahony and Peng2008; McNair and Flynn Reference McNair and Flynn2005; Urwin Reference Urwin2006). However, Taylor and Urwin (Reference Taylor and Urwin2001) find that the lower incidence of training among older workers is mainly due to reduced offers from employers rather than rejections of offers by employees.
Nevertheless, the theoretical prediction that returns to training decline with age requires some qualification. For employers, the expected duration of employment, rather than age, should be the crucial factor in training decisions and rates of turnover and absenteeism are lower among older workers (Taylor and Urwin Reference Taylor and Urwin2001). Retirement age also varies with institutional arrangements and the generosity of pension plans by occupation and employer (Montizaan, Cörvers and De Grip Reference Montizaan, Cörvers and De Grip2010). There are also notable country differences in employment policies, pension arrangements and scope for lifelong learning (Blossfeld, Buchholz and Kurz Reference Blossfeld, Buchholz and Kurz2011). For example, the expectation might be that there are higher training rates for older people in Nordic social democracies where there are more opportunities for training over the lifecourse and strong active labour market policies (Hofäcker and Pollnerová Reference Hofäcker, Pollnerová, Blossfeld and Buchholz2006). In contrast, training rates among older people may be lower in conservative welfare states, such as Germany and the Netherlands, which have generous and extensive early retirement programmes (Blossfeld, Buchholz and Kurz Reference Blossfeld, Buchholz and Kurz2011: 17).
From the workers’ standpoint, wage returns to training will vary according to characteristics of the workplace. For example, final salary occupational pensions could raise the monetary returns to training but less so if age is a barrier to promotion. Wage returns to training may also be lower for those already on higher seniority-wages (Vignoles, Galindo-Rueda and Feinstein Reference Vignoles, Galindo-Rueda and Feinstein2004). Training costs will certainly impact on the decision to train and these vary with factors such as timing and duration. The inconvenience of time and location has been shown to be an important factor for older workers (Sussman Reference Sussman2002) and training during paid work-hours may therefore be a preferred option. Fees are a particular concern for older non-workers (Chapman, Crossley and Kim Reference Chapman, Crossley and Kim2003). Older people are also deterred by psychological costs of training linked to fear and lack of confidence in the ability to succeed (Cully et al. Reference Cully, Vanden-Heuvel, Wooden and Curtain2000).
From the employers’ perspective, it is reasonable to be selective about which employees to train. This selection appears to reflect preconceptions about the potential benefits of training to both the employee and the employer (Vignoles, Galindo-Rueda and Feinstein Reference Vignoles, Galindo-Rueda and Feinstein2004). As discussed, proximity to retirement is a factor but there is also evidence that employers believe older workers are less enthusiastic about training and less willing to adapt to new technology (McNair and Flynn Reference McNair and Flynn2005; Taylor and Walker Reference Taylor and Walker1994; van Dalen, Henkens and Schippers 2010). If employers also believe that ability to learn and retain information declines with age, they will expect the potential gains from training older workers to be lower. However, the evidence in support of this assumption is mixed (Waldman and Avolio Reference Waldman and Avolio1986; Wood, Wilkinson and Harcourt Reference Wood, Wilkinson and Harcourt2008; Wooden et al. Reference Wooden, Van den Heuvel, Cully and Curtain2001).
Such considerations suggest that the assumption of lower net benefits of training for older people may be based partly on stereotypical ageist attitudes. Research on the barriers to training faced by older workers has considered these concerns and finds that unavailability of training is an important issue (Maltby Reference Maltby, Loretto, Vickerstaff and White2007; McKay and Middleton Reference McKay and Middleton1998; Porcellato et al. Reference Porcellato, Carmichael, Hulme, Ingham and Prashar2010; Sussman Reference Sussman2002). This is not only because older workers are perceived to be more costly to train but also because of less specific, and potentially ageist attitudes of employers (Cully et al. Reference Cully, Vanden-Heuvel, Wooden and Curtain2000; Wooden et al. Reference Wooden, Van den Heuvel, Cully and Curtain2001). Similarly, Lundberg and Marshallsay (Reference Lundberg and Marshallsay2007) and Chapman et al. (Reference Chapman, Crossley and Kim2003) identify lack of employer support and negative attitudes toward training for older workers as a disincentive for training.
Previous research also suggests that a lack of motivation for training among older people is not simply due to their proximity to retirement but also because they perceive less need for training (Cully et al. Reference Cully, Vanden-Heuvel, Wooden and Curtain2000; Felstead Reference Felstead2010; Guthrie and Schwoerer Reference Guthrie and Schwoerer1996; Lundberg and Marshallsay Reference Lundberg and Marshallsay2007). This could be because older individuals believe they have accumulated sufficient skills and experience. Even where there is a perceived need, the poor quality of training may discourage participation. The importance of quality is confirmed by Lundberg and Marshallsay (Reference Lundberg and Marshallsay2007) who found that older employees valued training that enhanced their productivity. It is also a mistake to think of older workers as a homogenous group. As highlighted by Rix (Reference Rix2002), their training needs and expectations reflect their ‘diversity’ in terms of social, occupational and educational background.
To summarise, there are various reasons why older people may be less likely to participate in training. Proximity to retirement is clearly important but not the only determining factor. Recent research highlights the importance of workplace characteristics, institutional arrangements, the cost and quality of training and age-specific barriers such as the ageist attitudes of employers.
Data
The analysis uses individual-level data from the EU-LFS for the years 2004–07. The EU-LFS facilitates inter-country comparisons by including standardised EU variables that are sometimes withheld in the country-specific LFS datasets; 2004–07 represents a period where most of our selected variables are available in most years and across most of the EU-15.
Four years of data are used in order to identify consistent patterns that reflect more than annual fluctuations. Respondents between 20 and 64 years of age are included. The sample was restricted by the unavailability of some variables for some countries. In particular, some of the training variables were unavailable for some countries, therefore the sample sizes vary and these are reported in the regression tables. Taking these restrictions into account, the full data include 2,999,674 workers (employees only) and 1,856,550 non-workers (unemployed and inactive). The large sample size provides tight confidence bands on estimated parameters thus aiding statistical inference.
Our sample of workers is restricted to employees (EU-LFS variable STAPRO = 3) and excludes the self-employed and family workers because their work patterns are known to be very different to those of employees. Their inclusion might well have distorted the overall responses on training and working hours given their normal working hours are less precisely prescribed than those of employees. Our sample of non-workers includes both the unemployed and the economically inactive (WSTATOR = 3, 5). We account for the difference between these two categories by including unemployment status, as defined by the International Labour Organization (ILO), as an explanatory variable. We did not exclude the ‘inactive’ because the exact distinction between unemployed and inactive is problematic. Excluding the inactive could bias the analysis since some older people who wish to work may be technically classified as ‘early retired’. We were unable to restrict the sample with respect to disability status because the variable MAINSTAT, which identifies those who are disabled, is missing for Germany and the United Kingdom (UK).
Our main dependent variable TRAINED records participation in training outside the formal education system. We define three additional measures of training. TRAINED_WorkRel records whether the purpose of training was work related; TRAINED_InWrkHrs whether training occurred during normal working hours and TRAINED_Time the proportion of time spent training. All these variables are defined for the four weeks prior to the interview using the EU-LFS variables COURATT, COURPURP, COUTWOHR and COURLEN, respectively. These variables have only been consistently available in the EU-LFS since 2004 and no other training time-domains are available. Table 1 presents summary statistics and definitions for these dependent variables and the explanatory variables.
Table 1. Summary statistics

Notes:1. The sample of ‘workers’ includes employees only. Largest sample sizes are 1,856,550 for non-workers and 2,999,674 for workers. Sample sizes are slightly smaller for some estimations because of country-specific missing variables. ISCED: International Standard Classification of Education. ILO: International Labour Organization. NACE: Nomenclature statistique des activités économiques dans la Communauté Européenne.
Training incidence
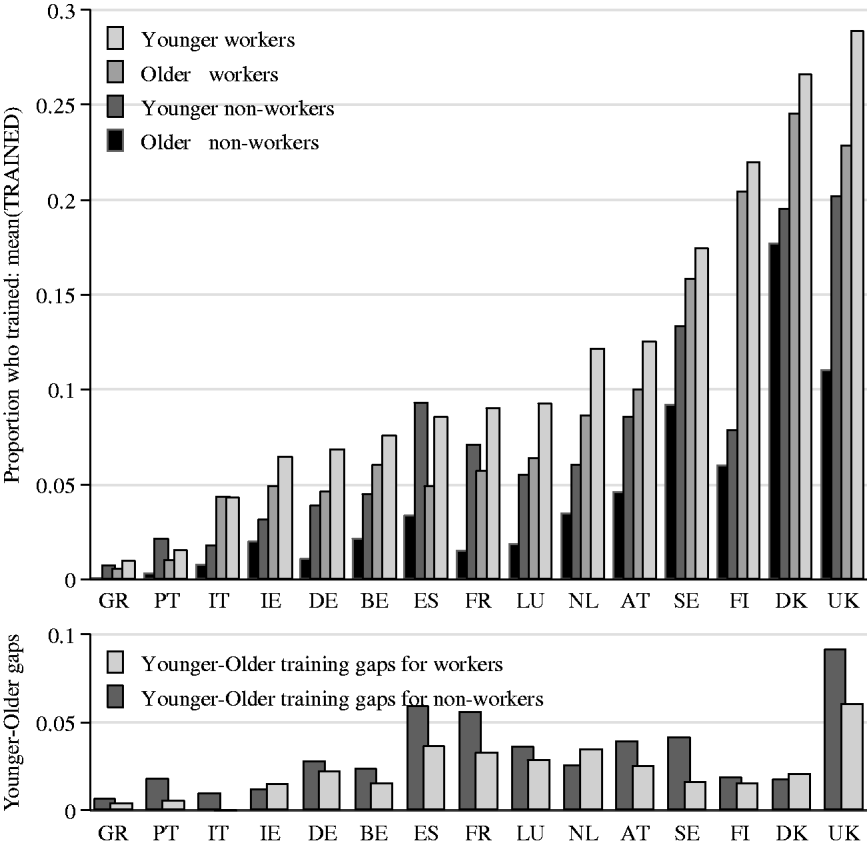
In the EU-15 approximately 9.6 per cent of employees and 4.4 per cent of non-workers received some training in the four weeks prior to their survey interview (see Table 1). Mean training rates for older respondents are lower for both workers and non-workers (9.0 and 2.5%) in comparison with younger respondents (9.8 and 5.9%). The upper panel of Figure 1 shows that there is large variation across countries for both workers and non-workers and for both age groups (18–49 and 50–64). Training incidence is highest in the UK and Denmark but considerably lower in Greece, Portugal, Italy and Ireland. In Finland training rates are high among workers but low among non-workers.

Figure 1. Proportion who undertook training.
The lower panel in Figure 1 highlights that in most countries the proportion who trained is lower for the older age group. Italy is the only exception where the difference for workers is negligible. The largest age-gaps are for non-workers and can be found in the UK, Spain and France. The smallest gaps are found in Greece, Portugal and Italy where there is relatively little training to begin with but also in Finland and Denmark where training rates are high.
Work relatedness of training
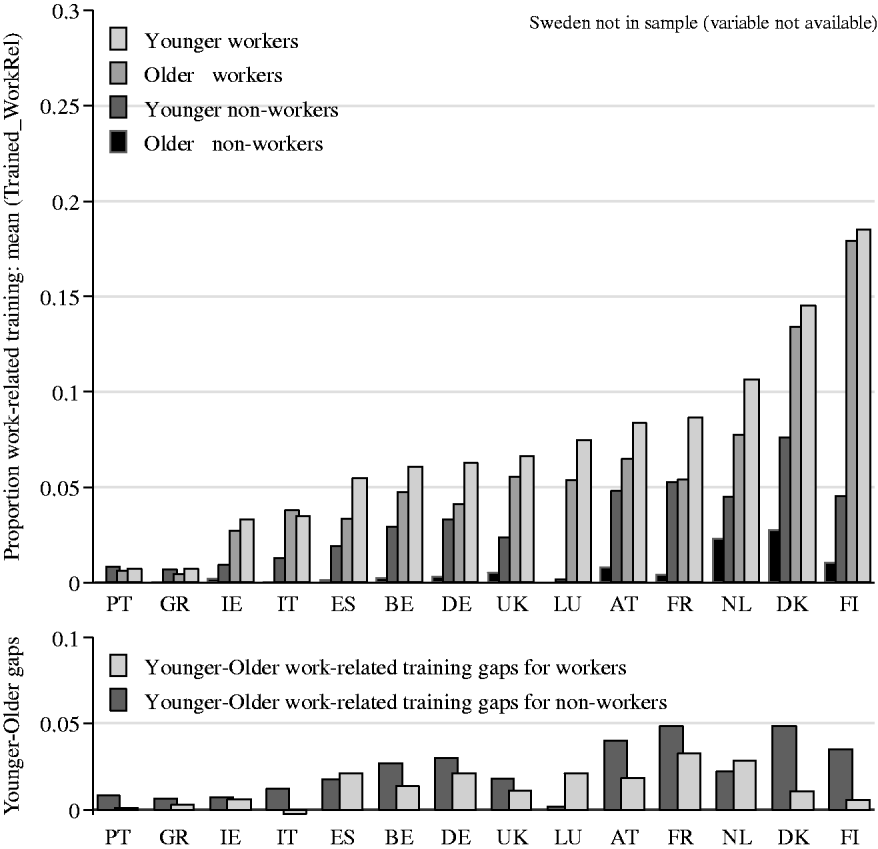
EU-LFS respondents (excluding Sweden) were asked if the purpose of the training was mainly work-related or personal/social. From Table 1 we see that 5.3 per cent of workers undertook mainly work-related training. When compared to the 9.6 per cent that undertook any kind of training this indicates that just over half (55%) of training was work-related. Among the workless, only 1.3 per cent report undertaking work-related training, though exactly how non-workers interpret ‘mostly job related’ may vary depending on personal circumstances. Conditional on the aforementioned caveat, under one-third (29.5%) of non-workers’ training was work-related. These rates are lower still for older workers and older non-workers, 4.4 and 0.4 per cent, respectively, indicating that less than 50 per cent of the training by older workers and only 16 per cent of the training by older non-workers was work-related. The upper panel of Figure 2 confirms this; the older cohorts were less likely to participate in work-related training, with the exception of Italy. The lower panel shows that the age-training gap for non-workers is greatest in France and Denmark. The age-training gap for workers is greatest in France and the Netherlands.

Figure 2. Proportion who undertook work-related training.
Training during work-hours
Although we do not know from the data who paid for the training, we do have information on whether training was undertaken during work-hours. This variable is the one most likely to be correlated with an employer's commitment to training. This is because the opportunity costs of lost production are greater for those who trained during working hours than those who undertake training outside normal hours. Employers are more interested in investing in job-specific training, so this type of training is most likely to be undertaken during work-hours. Training that is less job-specific but increases workers’ utility by, for example, raising wages (possibly through a job change) is more likely to be undertaken outside normal work-hours. In line with this prediction, Bassanini et al. (2005: 56) found that 80 per cent of vocational courses in 16 Organisation for Economic Co-operation and Development (OECD) countries were paid for by employers.
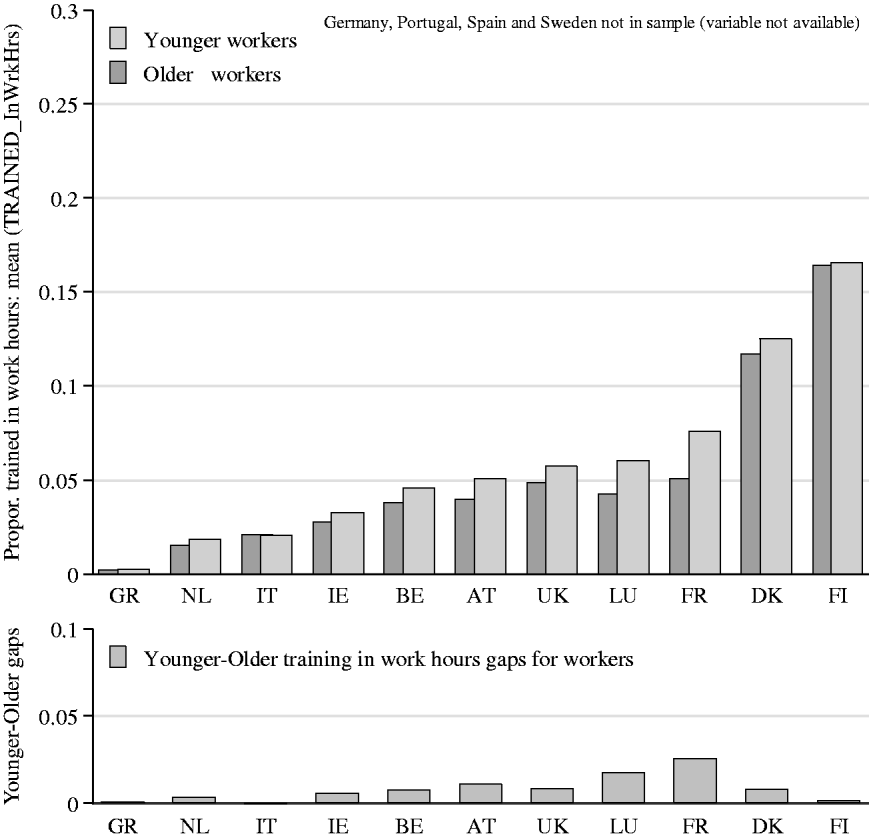
In the 11 EU countries for which data are available, Table 1 shows that 2.8 per cent of workers undertook their training mostly during normal work-hours. This equates to about 30 per cent of workers who undertook any kind of training. This suggests that a significant amount of training undertaken by workers is considered by employers to improve job-specific skills. However, the proportion of older workers undertaking training during work-hours is just 2.5 per cent, compared to 2.9 per cent for younger workers. The upper panel of Figure 3 shows that there is large variation across countries. Comparing Figures 1 and 3 we see that in Finland, Denmark and France the majority of training took place during normal work-hours. In other countries, such as the Netherlands, a very small proportion of the training took place during work-hours. The lower panel of Figure 3 illustrates that, with the exception of France and Luxembourg, in most countries there is only a small difference between the percentage of younger and older trainees undertaking training during work-hours.

Figure 3. Proportion of workers training during work-hours.
Time in training
Felstead (Reference Felstead2010: 1298) suggests that the time spent training is a revealing quality dimension as it indicates the ability level and knowledge demanded at work. We define the proportion of time spent training over a range of 0–160 hours for the four-week period. Table 1 shows that on average, workers in the EU-15 trained for about 2.3 per cent of their time (equivalent to about four hours). The time spent in training is much lower for the workless, 1.6 per cent of their time. Interestingly, the differences between younger workers and younger non-workers are small, 2.4 versus 2.5 per cent. The overall difference is driven by differences between older workers and older non-workers. Older workers spent on average 1.8 per cent of the previous four weeks in training but for older non-workers this is just 0.6 per cent.
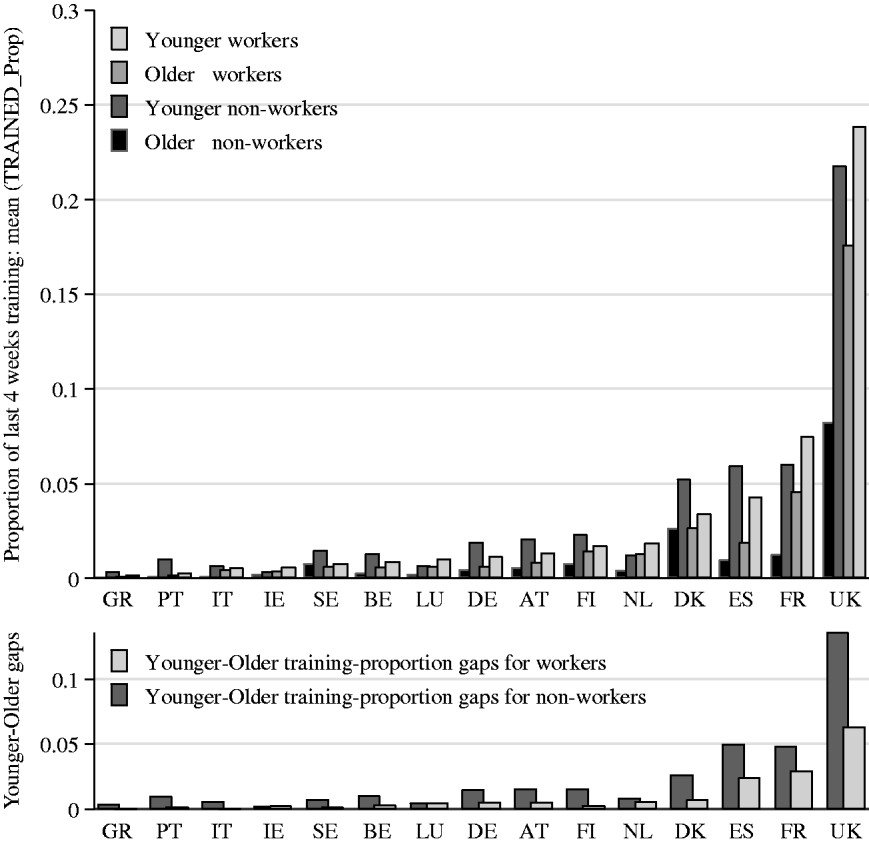
The upper panel of Figure 4 shows considerable variation across countries with hours of training longest in the UK. In every country older respondents undertook fewer hours of training than younger respondents. The lower panel shows that most age-training gaps are very small because only a small proportion of time is spent training. The one exception is the UK where large age-training gaps are associated with a high proportion of time spent training.

Figure 4. Proportion of last four weeks spent in training.
Empirical specifications
We carry out separate analyses by employment status and gender. This isolates employment effects on training that might otherwise obscure the effect of age. For example, there are more opportunities for training among the older employed (Bassanini et al. Reference Bassanini, Booth, Brunello, de Paola and Leuven2005). The four measures of training participation are the dependent variables in the model estimations. The analysis is purely in terms of reduced-form equations as the EU-LFS does not include supply-side variables, such as offers of training, needed for structural estimates as in Taylor and Urwin (Reference Taylor and Urwin2001).
For the multivariate analysis of the binary dependent variables we report marginal effects based on the Probit estimator:
where t i is the observed binary outcome of the latent continuous variable ti. These record either participation in training (TRAINED=1), participation in work-related training (TRAINED_WorkRel=1) or participation in training during normal work-hours (TRAINED_InWrkHrs=1). The X i are vectors of individual characteristics and the βs are vectors of corresponding parameters plus a constant. Φ(.)is the standard cumulative normal distribution and σ is the standard error of the regression. Maximisation of (1) yields estimates of the parameter vector ![]() $\^ \beta $ and the standard error
$\^ \beta $ and the standard error ![]() $\^ \sigma $ associated with the highest likelihood of having observed the data outcomes given the estimated parameters.Footnote 1
$\^ \sigma $ associated with the highest likelihood of having observed the data outcomes given the estimated parameters.Footnote 1
The proportion of time in training variable, TRAINED_Time, is continuous between 0 and 1 but is censored at 0 for those who undertook no training and at 1 for those who spent all their working time training in the previous four weeks. The double-censored Tobit of Nakamura and Nakamura (Reference Nakamura and Nakamura1983) is appropriate because it treats the uncensored observations as part of a linear model and the censored observations (TRAINED_Time=0, 1) as part of a non-linear Probit model thus making full use of the observed values on the dependent variable. Using Ordered Probit would not be appropriate in this setting because TRAINED_Time is measured on an interval scale. Tobit takes account of the scaling in the observations and does not apply arbitrary cut-off points to the continuous part of the dependent variable.
For the multivariate analysis on the censored TRAINED_Time we report marginal effects conditional on being uncensored using the Tobit estimator:
 $$\ln Lik. = \sum\limits_{t = 0} {\ln \Phi \left( {\displaystyle{{t_i - X_i \beta} \over \sigma}} \right)} - {\textstyle{1 \over 2}}\sum\limits_{0 \lt t \lt 1} {\left( {\ln 2\pi \sigma ^2 + \left( {\displaystyle{{t_i - X_1 \beta} \over \sigma}} \right)^2} \right)} + \sum\limits_{t = 1} {\ln \left( {1 - \Phi \left( {\displaystyle{{t_i - X_i \beta} \over \sigma}} \right)} \right)} $$
 where Equation (2) is similar to Equation (1) with the addition of an intermediate summation term that captures the uncensored observations on the observed dependent variable 0 < t < 1. The first summation term in Equation (2) captures all individuals who undertook no training. The second summation term captures the intermediate cases of individuals who spent an intermediate proportion of their time training. The third summation term captures all individuals who spent 160 hours or more in training during the four-week period. Maximisation of Equation (2) yields estimates of the parameter vector ![]() $\^ \beta $ and the standard error
$\^ \beta $ and the standard error ![]() $\^ \sigma $.
$\^ \sigma $.
Explanatory variables
We define our age indicator OLDER as a dichotomous variable equalling 1 if the individual is at least 50 years old and 0 otherwise. The classification of those 50 years and over as older reflects existing literature on older workers which generally considers these as the demographic group of interest (Khan Reference Khan2009; OECD 2004, 2005). Because previous research (Taylor and Urwin Reference Taylor and Urwin2001) has shown that other age groups also have varying training participation rates, and in order to provide a more detailed age analysis, we also include binary variables that capture younger age groups (YOUNGER_40_49, YOUNGER_30_39 and the control group YOUNGER_20_29).
Other explanatory variables control for as many confounding factors as have been found to be relevant in previous research and are available in the dataset. These include marital status, nationality, educational attainment, urban density of residence and a range of workplace characteristics for those in employment. The latter include hours or work, tenure, firm size, industrial sector and occupational status. Occupational status can be viewed as a proxy for earnings data which are not available for a sufficiently large sub-sample in the EU-LFS. Country dummy variables are also included since we are interested in country differences and how variation in institutional structures affects labour markets.
We also include variables not examined in previous research; recording whether a worker is working from home or is looking for another job. We are interested in working from home because this could affect the opportunities for training. Looking for another job could also impact on an individual's demand for training. Within the analysis of non-workers we include an unemployment indicator based on the ILO definition. This identifies those non-workers who are actively seeking work and is analogous to the indicator for workers who are looking for another job.
Regression results
The marginal effects for the Probit estimates for the binary dependent variables (TRAINED, TRAINED_WorkRel, TRAINED_InWrkHrs) are reported in Tables 2–5. Table 6 reports marginal effects for the proportion of time spent training (TRAINED_Time) using the Tobit estimator. Marginal effects indicate changes in the probability of the dependent variable resulting from changes in the regressors. For binary regressors, marginal effects indicate changes in the probability of a positive outcome on the dependent variable. For continuous regressors, marginal effects provide the usual slope effects.
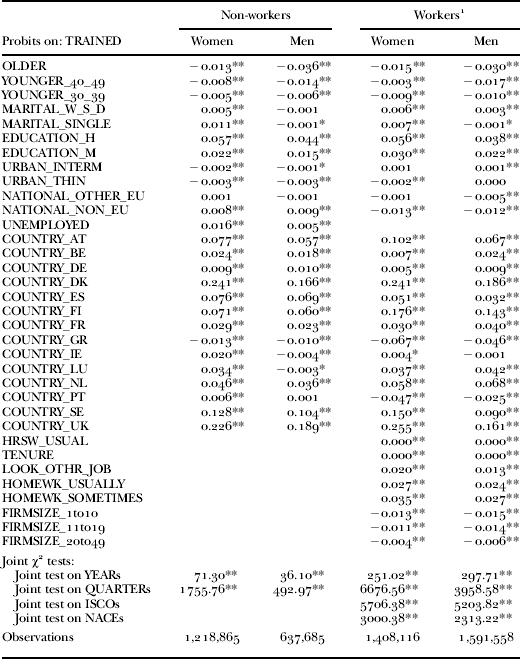
Table 2. Probit marginal effects on whether training was undertaken

Notes:1. Employees only. See Table 1 for definitions of the variables.
Significance levels:* 0.05 and ** 0.01 level of significance (based on t-statistics or χ2-statistics).
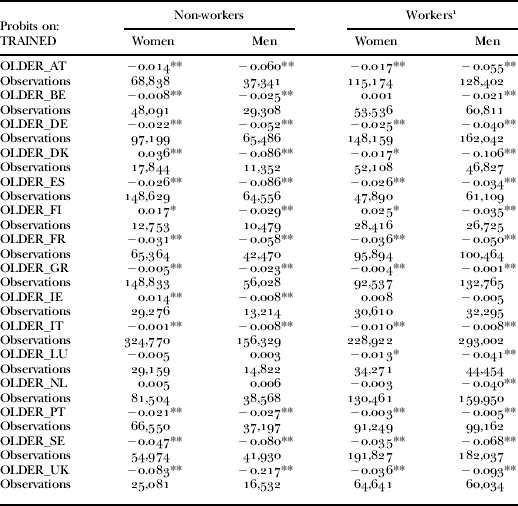
Table 3. Country-specific Probits, only marginal effects on OLDER reported

Notes:1. Employees only. See Table 1 for definitions of the variables.
Significance levels:* 0.05 and ** 0.01 level of significance (based on t-statistics or χ2-statistics).
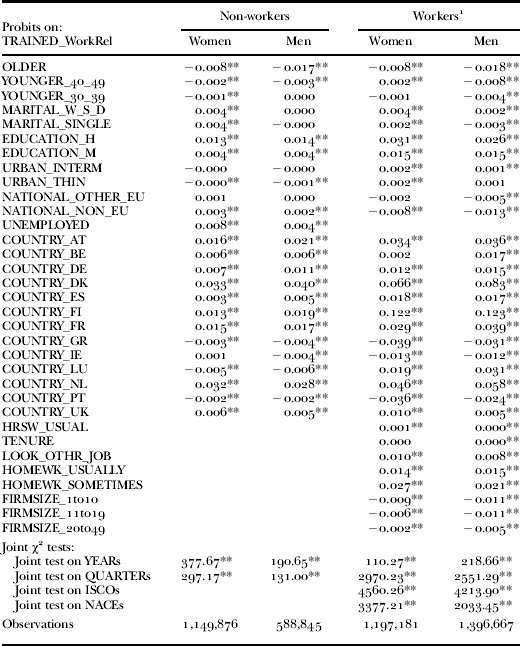
Table 4. Probit marginal effects on undertaking work-related training

Notes:1. Employees only. See Table 1 for definitions of the variables.
Significance levels:* 0.05 and ** 0.01 level of significance (based on t-statistics or χ2-statistics).
Table 5. Probit marginal effects on whether training was during work-hours

Notes:1. Employees only. See Table 1 for definitions of the variables.
Significance levels:* 0.05 and ** 0.01 level of significance (based on t-statistics or χ2-statistics).
Table 6. Tobit marginal effects on proportion of last four weeks spent training

Notes:1. Employees only. See Table 1 for definitions of the variables.
Significance levels:* 0.05 and ** 0.01 level of significance (based on t-statistics or χ2-statistics).
Participation in training (TRAINED)
In the Probits presented in Table 2, the marginal effects on OLDER are negative and significant in all four cases. This confirms that, after controlling for individual characteristics, the probability of training is lower for older women and men, both in and out of work. For women the effect is a reduction in the range −0.013 to −0.015 while for men it is much larger and in the range −0.036 to −0.030. Reductions in this range are actually quite large when we consider that the mean probabilities of training are 0.044 for non-workers and 0.096 for workers.
What is interesting is that for each gender taken separately, the effect of being older is very similar regardless of employment status. This age-related decline in the probability of training is also captured by the other age variables (YOUNGER_40_49 and YOUNGER_30_39). The decline in training appears monotonic in age with the one exception of female workers for whom the negative effect for 40–49-year-olds is smaller than that of 30–39-year-olds.
The analysis takes account of country-specific differences by including country dummy variables (the reference country is ITALY, the country with the highest number of observations). The results indicate that, after conditioning for individual characteristics, the increase in training probability for women and men, in and out of work, is highest in Denmark and the UK as indicated in Figure 1. Only Greece is associated with a conditional reduction in the probability of training for both non-workers and workers. Portugal is associated with a reduction in the probability of training for workers only. Ireland and Luxembourg are associated with small reductions for non-working men only.
In relation to our new explanatory variables that have not previously been examined by other research, the impact of working from home (HOMEWK_USUALLY=1/HOMEWK_SOMETIMES=1) has a strong positive effect on training for both genders. This suggests the flexibility of working from home increases opportunities for training. The impact of looking for another job (LOOK_OTHR_JOB) on the probability of undertaking training is important for both genders. Analogously, ILO unemployed status for non-workers on the probability of undertaking training is important for both genders but particularly so for women. This fits in with traditional concepts of the active unemployed who are looking for work and suggests that training is one way of pursuing re-employment. As an additional exploration, separate regressions for the unemployed and the inactive (not reported) were estimated and the impact of being older was greater for the inactive than the unemployed.
In relation to the explanatory variables that have been looked at in past research, most of the results are in line with previous evidence. For example, a higher probability of undertaking training is associated with higher educational attainment, occupational status, larger firm size, longer hours of work, tenure and being employed in the public sector.
The comparison of the results for workers and non-workers is interesting because non-workers have not previously been analysed as a separate group. For example, being a non-EU national (NATIONAL_NON_EU) is associated with a significantly reduced probability of undertaking training among workers but a higher probability among non-workers. Compared to the reference category (URBAN_DENSE), a non-urban environment (URBAN_THIN) is associated with a lower probability of undertaking training, with the one exception of male workers where it is has no significant effect. However, a sub-urban environment (URBAN_INTERM) is associated with a lower probability of training among non-workers but a higher probability of training among male workers. This is consistent with Brunello and Gambarotto (Reference Brunello and Gambarotto2004) and Brunello and De Paulo (Reference Brunello and De Paulo2004) who find that in Italy and the UK training incidence was higher in less agglomerated areas. They explain these results in terms of turnover and poaching effects.
Country-specific participation in training (TRAINED by country)
To examine EU age-training gaps further, we ran separate Probits for each gender, employment status and country, amounting to 60 regressions. In Table 3 we report just the marginal effect on the OLDER variable in each case and the number of individuals in each regression. The results mirror those found in the lower panel of Figure 2 whilst providing more information on gender differences.
By comparing the marginal effects in Table 2 to those in Table 3 we note a great deal of similarity across counties in the conditional effects of being older. However, there are notable differences. For some countries the conditional older age-training gaps are very small and in some of these cases statistically insignificant indicating little or no differences in training for the older age group. For example, in Greece and Italy the conditional age-training gaps are very small regardless of gender and work status. In Luxembourg and the Netherlands the age-training gaps for non-workers are insignificant. In Ireland and Portugal the age-training gaps for workers are very small and this is also the case for female workers in Belgium and the Netherlands.
In a few countries, but always for women, the conditional age-training gap is positive, indicating that older women are actually more likely to train. This is true for female non-workers in Denmark, Finland and Ireland. It is also true for female workers in Finland. In some other countries the conditional age-training gaps are noticeably large. The most extreme cases of this can be found in the UK where the conditional age-training gaps for non-working men, in particular, is very large. Age-training gaps are also very large for the other UK respondents, Swedish respondents, Danish men and non-working Spanish men. These highlight cases which offer the greatest opportunity for policy makers to narrow the age-training gaps by active labour market policies.
Work-related training (TRAINED_WorkRel)
The results in Table 4 suggest that age-training gaps are still significant when we consider just work-related training. It is interesting that the gender-age gap persists with the male OLDER marginal effects being more than twice the size of the female ones. This means that older women are 0.8 per cent less likely to train than their youngest counterparts while older men are 1.6 per cent less likely to train. This is in relation to mean work-related training rates in the range 1.3–5.3 per cent (see Table 1). As in Table 2, the age-related decline in the probability of training is also captured by the younger age variables and here too it typically declines monotonically in age. Again, the one exception is female workers for whom the marginal effect for 40–49-year-olds is actually positive and where the effect for 30–39-year-olds is no different to that of 20–29-year-olds.
Conditional country differences show that for those not in work Denmark and the Netherlands have the highest increases in the probability of work-related training. For those in work, Finland is associated with the largest increase in the probability of training. Greece and Portugal are associated with the largest conditional reductions in the probabilities of training for non-workers and workers, respectively.
In relation to the other explanatory variables, most results do not differ by much. Notable exceptions include the fact that for female workers work-related training is more probable if they live in non-urban areas (URBAN_INTERM, URBAN_THIN). This suggests that poaching and turnover effects are stronger in relation to work-related training for working women.
Training during work-hours (TRAINED_InWrkHrs)
The negative significance of the marginal effects on OLDER in Table 5 shows that the associated probability is also lower for training during normal work-hours. The difference between the genders is stark with the OLDER marginal effect for men being nearly five times greater than that for women (−0.96% versus −0.2%). This result is significant both statistically and in magnitude. As argued above, whether training takes place during work-hours is an important indicator of the commitment of employers to training, and of the net benefit to firms of training. As in Tables 2 and 4, the probability of training for male workers declines with age. However, for female workers the conditional probability of training rises with age but only up to the age of 49, thereafter it falls for the older group aged 50 and over.
It is difficult to compare the country effects in Tables 2, 4 and 5 because of four missing countries in Table 5. However, Finland and Denmark are the two countries that stand out, when compared to the reference county, Italy, as having substantially higher probabilities of training during work-hours. Only Greece and the Netherlands have lower conditional probabilities of training during work-hours than Italy.
In relation to the other explanatory variables, the main differences between the results in Tables 2 and 5 are that urban density seems to have next to no influence on training during work-hours. The effects of working from home are still largely the same but in the case of women this becomes negative and significantly so. We suggest that for these women the definition of work-hours may be ambiguous.
Time in training (TRAINED_Time)
The results in Table 6 show that respondents who are 50 and over undertake fewer hours of training than younger ones. This is true for women and men, workers and non-workers. The gender differences are similar to those in Table 2, with the OLDER marginal effects more than twice the size for men as they are for women (for both workers and non-workers). The similarities to Table 2 continue for the younger age variables with the probability of training typically declining with age with the one exception of working women where the negative effect for 40–49-year-olds is smaller than that for the younger 30–39-year-olds. As in Table 4, for work-related training, tenure is not a significant factor in influencing women's time spent training. In relation to the other explanatory variables, the general patterns are similar to those seen before.
Summary and implications
The analysis in this paper indicates that overall training rates in the EU-15 are highest in the UK and Nordic countries (Denmark, Finland and Sweden). They are lowest in Ireland, Germany and most of Southern Europe (Greece, Italy and Portugal). Training rates in the other EU-15 economies lie between these two groupings. The ‘varieties of capitalism’ perspective (Esping-Anderson Reference Esping-Anderson1999; Hall and Soskice Reference Hall and Soskice2001) provides some interpretation for these findings. For example, higher training rates in the UK's liberal market economy are likely to be driven by low job security in a labour market where the low-skilled and least educated are exposed to high risks of unemployment. The higher Nordic training rates are attributable to the social democratic commitment to full employment coupled with strong training policies and support for lifelong learning. In contrast, there are fewer opportunities for lifelong learning in conservative-coordinated economies such as Germany where the education system is highly stratified and there is strong support for apprenticeships. The lower training rates in the Southern European mixed-market economies (Hall and Gingerich Reference Hall and Gingerich2009) are consistent with weaker social policies and restricted public support. It is more difficult to interpret the low Irish training rates as Ireland is usually categorised as a liberal market economy alongside the UK (Hall and Gingerich Reference Hall and Gingerich2009).
The results in Tables 2–6 confirm that a common feature within the EU-15 is that older people aged 50–64 are less likely to participate in training even when confounding factors are controlled for. In addition, the results suggest that older people are less likely to participate in the kinds of training that are work-related, take place during work-hours and last for a longer period of time. These age-training gaps are wider among non-workers. There are also notable cross-country variations in the level and significance of age-training gaps (Figures 1–4;Table 3). Conditional age-gaps in general training (Table 3) are largest in countries with high overall training rates such as Sweden and the UK. They are also high for Danish men and for non-working men in Spain. Conversely, these conditional age-gaps are smallest in countries with low general training rates such as Italy and Greece.
Although the age-training gaps in UK and Nordic countries are larger, the training rates of older people are actually higher in these countries, particularly in Denmark, reflecting the fact that training rates are high for both younger and older people. As highlighted in Blossfeld, Buchholz and Kurz (Reference Blossfeld, Buchholz and Kurz2011), extensive re-training measures are offered in Denmark and Sweden. van Dalen, Henkens and Schippers (Reference van Dalen, Henkens and Schippers2009) also find that employers are more willing to implement training programmes for older workers in the UK than in other EU countries. Nevertheless, conditional training rates in the UK are still significantly higher for younger cohorts. The Netherlands provides one exception where conditional age-training gaps (Table 3) are small despite the fact that Dutch training rates are above the EU-15 average. This is consistent with Montizaan, Cörvers and De Grip (Reference Montizaan, Cörvers and De Grip2010) who have suggested that increased training rates among older Dutch public-sector employees are linked to reductions in pension entitlements.
There are some notable gender differences in the relationship between age and training. In particular, while there is a systematic age-related decline in training for men (working and non-working), this pattern is not systematic for working women. In ‘general training’ (Table 2) and ‘time spent training’ (Table 6) working women aged 40–49 experience a slight resurgence in training compared to their 30–39-year-old counterparts. This pattern is more pronounced for work-related training (Table 4) and training during work-hours (Table 5) where working women aged 40–49 actually experience an increase in training compared to their youngest counterparts before experiencing a downturn in their fifties. Table 3 highlights country-level differences in the training participation of men versus women. For example, in Denmark and Ireland, older non-working women experience higher rates of training than the youngest women. In Finland, this is true for working and non-working older women.
One interpretation of the results is that older people are simply less likely to train because of their close proximity to retirement. Increases in statutory retirement ages in various EU-15 countries may therefore mitigate this effect. However, the statistical significance of the age-training differences is also consistent with alternative explanations including: higher costs of training, ageist attitudes, differences in learning ability, lack of perceived need and institutional factors. Some of the country-level differences, in particular, will reflect national differences in these factors. Macro-economic changes are also important. The results from this study refer to 2004–07, the final years of a macro-economic boom where unemployment rates were low and the pension problem had not yet become a pension crisis. During economic downturns older workers face higher risks of labour market exit (Blossfeld, Buchholz and Kurz Reference Blossfeld, Buchholz and Kurz2011) and the current economic crisis, triggered in 2008, highlights the need for lifelong training.
These results have implications for policy interventions that aim to increase the employability of older people by encouraging them to undertake more training. First, they need to be offered more opportunities for training and this may require changes in attitudes towards age. Policies such as raising or abolishing mandated retirement ages may encourage older workers to take up training but will do little to help unemployed older people if they have limited scope for re-entering employment. Second, training for its own sake is not the objective, the nature of the training matters. To ensure that the training extends working lives by enhancing the labour market opportunities of older workers, policies should be carefully designed to specifically promote the work-relevance of the training. These policies need to be credible; the value of this training needs to be tangible and training needs to be an ongoing process spanning entire working lives.
Acknowledgements
This research is part of the project SERVICEGAP and is funded by the EU Seventh Framework Programme (FP7). The opinions expressed are those of the authors only and do not represent the European Commission's official position.


