


Severe acute malnutrition (SAM) remains a major killer of children as the mortality rates in children with severe wasting – a widespread form of SAM – are nine times higher than those in well-nourished children( Reference Black, Allen and Bhutta 1 ). Despite economic growth of nearly 10 % per annum( Reference Chatterjee 2 ), in India the prevalence of severe wasting among children is increasing; in 1999, the Second National Family Health Survey (NFHS-2) indicated that 6·7 % of children aged 0–35 months were severely wasted( 3 ); in 2006, the Third National Family Health Survey (NFHS-3) indicated that this figure had increased to 7·9 %( 4 ). Therefore, at any point in time an average of 8 million Indian children under the age of 5 years are severely wasted( 5 ). These 8 million children – one-third of the severely wasted children worldwide( 5 ) – are dangerously undernourished, compromising their ability to survive, grow and develop to their full potential, which is the same potential as that of children in developed countries( Reference Bhandari, Bahl and Taneja 6 ).
In the state of Jharkhand child wasting is widespread. The NFHS-3 showed that 32·3 % of children aged 0–59 months are wasted and 11·8 % – an average of 600000 children at any point in time – are severely wasted. The response to SAM in Jharkhand is led by the National Rural Health Mission (NRHM); currently, this response relies on a network of forty-eight malnutrition treatment centres (MTC) where children with SAM receive therapeutic care following protocols based on guidelines for the management of SAM by the WHO( 7 ) and the Indian Academy of Pediatrics( 8 ).
The objective of the analysis presented here is twofold: (i) to assess the effectiveness of MTC in providing therapeutic care for children with SAM in Jharkhand (2009–2011); and (ii) to inform the future design and implementation of programmes for the delivery of therapeutic care for children with SAM in Jharkhand and in India.
Methods
The detection of children with SAM was ensured in the villages by community front-line workers of India's Integrated Child Development Services (ICDS) programme, either as part of monthly growth monitoring and promotion sessions at the ICDS centre (passive case finding) or in the context of community drives for the identification of children with SAM (active case finding).
Screening
In the context of monthly growth monitoring and promotion sessions, the weight and mid-upper arm circumference (MUAC) of children aged 6–59 months were measured and the presence of bilateral pitting oedema was assessed; in the context of community drives for the identification of children with SAM, the MUAC of children aged 6–59 months was measured and the presence of bilateral pitting oedema was assessed. All children with bilateral pitting oedema, and/or MUAC < 115 mm, and/or weight-for-age greater than 3 sd below the median weight-for-age in the WHO Child Growth Standards( 9 ) (i.e. weight-for-age Z-score (WAZ) < –3) were referred to the MTC.
Admission
Once at the MTC, the age, weight, height/length, MUAC and presence/absence of bilateral pitting oedema were assessed in all children who had been referred; in these children, SAM was defined as per WHO recommendations by the presence of bilateral pitting oedema and/or the presence of severe wasting; severe wasting was defined as MUAC<115 mm and/or weight-for-height/length greater than 3 sd below the median weight-for-height/length in the WHO Child Growth Standards( 10 ) (i.e. weight-for-height/length Z-score (WHZ) < –3). Therefore, all children aged 6–59 months with bilateral pitting oedema, and/or MUAC < 115 mm, and/or WHZ < –3 were admitted to the MTC.
Treatment
At the MTC, a medical doctor conducted a clinical examination in children to detect the presence/absence of medical complications (altered alertness, respiratory tract infections, diarrhoea/severe dehydration, high fever/malaria, tuberculosis and/or severe anaemia) using the criteria for the Integrated Management of Neonatal and Childhood Illnesses( 11 ); children with medical complications, and/or bilateral pitting oedema, and/or poor appetite were fed a locally prepared therapeutic formula meant as a substitute for F-75 (hereafter referred to as ‘F-75-proxy’); these children were fed F-75-proxy every 2 h for 2d while their medical complications were treated and monitored by a medical doctor. After completion of the initial 48 h in the MTC, these children were fed a locally prepared therapeutic formula meant as a substitute for F-100 (hereafter referred to as ‘F-100-proxy’) six times daily for 48 h to initiate rapid weight gain (rehabilitation phase).Footnote * Children with normal appetite and free of medical complications and bilateral pitting oedema were fed F-100-proxy from the day of admission. After completing 4 d at the MTC, children were fed F-100-proxy alternated with a locally prepared semi-solid therapeutic food until the child was discharged from the MTC.
Discharge
Children were discharged from the MTC when they met the following discharge criteria: (i) the child was active and alert; (ii) the child had no signs of bilateral pitting oedema, fever and/or infection; (iii) the child had completed all age-appropriate immunizations; (iv) the child was being fed 502–544 kJ (120–130 kcal)/kg body weight per d; (v) the child was gaining at least 5 g/kg body weight per d; and (vi) the primary caregiver knew the care that the child needed to receive once back home.
Follow up
Once discharged from the MTC, children were to be followed up in the community by the ICDS or NRHM front-line workers; these front-line workers were to ensure that the child was enrolled in and benefited from ICDS Supplementary Nutrition Programme and that the child returned for a follow-up visit to the MTC every 15 d during the six weeks following discharge (i.e. three follow-up visits).
Data management
Data management and statistical analyses were conducted using the statistical software package Stata Special Edition 10·1.
Results
Between March 2009 and September 2010, the Department of Health and Family Welfare, Government of Jharkhand set up forty-eight MTC in the twenty-four districts in the state with two MTC per district. The analysis presented here concerns the children who were admitted to these forty-eight MTC between 1 July 2009 and 30 June 2011.
Over this 2-year period, 3685 children aged 6–59 months were admitted in Jharkhand's MTC. Of the 3685 children admitted, ninety (2·5 %) did not meet the admission criteria (‘false positives’) as their MUAC was ≥115 mm, and/or their WHZ was >−3, and/or they did not have bilateral pitting oedema. The analysis presented here refers to the 3595 children who met the admission criteria (‘true positives’).
Of these 3595 children, 1976 (55·0 %) were girls while 1619 (45·0 %) were boys. The admissions concerned for the most part very young children as 2792 (77·7 %) of the children were in the age group 6–23 months and 3315 (92·2 %) were in the age group 6–35 months; regarding social identity, 2466 children (68·6 %) were from scheduled tribes (n 1892) or scheduled castes (n 574), while 1129 (31·4 %) were from other social groups (Table 1).
Table 1 Description of children with severe acute malnutrition (SAM) admitted to malnutrition treatment centres (MTC) in Jharkhand, India, 1 July 2009–30 June 2011
*SAM with oedema and/or medical complications.
†SAM without oedema or medical complications.
On the day of admission, ninety-four (2·6 %) of the 3595 children admitted had bilateral pitting oedema while the remaining 3501 (97·4 %) had severe wasting. Among the 3501 children with severe wasting, 1143 (32·6 %) had medical complications; thirty-seven children (1·1 %) had malaria, sixty children (1·7 %) had tuberculosis, eighty-one children (2·3 %) had diarrhoea/severe dehydration, 121 children (3·5 %) had a respiratory tract infection, 240 children (6·9 %) had severe anaemia, 348 children (9·9 %) had high fever and 227 children (6·5 %) had multiple complications; 2358 children (67·4 %) had no oedema and no medical complication. Therefore, 1237 (34·4 %) of the 3595 children admitted had complicated SAM (SAM with oedema and/or medical complications) while 2358 children (65·6 %) had uncomplicated SAM (SAM without oedema or medical complications; Table 1).
Of the 3501 children with severe wasting, 207 were missing MUAC measurement. Of the 3294 children with MUAC measurement, 2217 (67·3 %) had MUAC < 115 mm; of the 2217 children with MUAC<115 mm, 2069 (93·3 %) had WHZ < −3.
Of the 3501 children with severe wasting, 138 were missing WHZ measurement. Of the 3363 children with WHZ measurement, 3296 (98·0 %) had WHZ <−3; of the 3296 children with WHZ < −3, 2069 (62·8 %) had MUAC < 115 mm.
The following programme outcomes were recorded among the 3595 children who were admitted to the MTC (Table 2).
Table 2 Programme outcomes in children with severe acute malnutrition (SAM) admitted to malnutrition treatment centres in Jharkhand, India, 1 July 2009–30 June 2011
*SAM with oedema and/or medical complications.
†SAM without oedema or medical complications.
‡Children with complicated or uncomplicated SAM.
§Children with a weight gain ≥15 % of initial weight.
∥Children with a weight gain <15 % of initial weight.
-
• Transfers: 177 children (4·9 %) were transferred to a district hospital or other facility for medical reasons and were not transferred back to the MTC; the remaining 3418 children (95·1 %) comprise the programme exits (deaths, defaulters and discharged).
-
• Deaths: twenty children (0·6 %) died while they were in the MTC; twelve deaths were recorded among children with oedema and/or medical complications while eight deaths were recorded among children without oedema and/or medical complications.
-
• Defaulters: 628 children (18·4 %) defaulted from the programme as they left the MTC against the advice of the MTC staff.
-
• Discharged: 2770 children (81·0 %) were discharged from the programme when they met the discharge criteria.
Multiple regression analysis indicated that those at higher risk of defaulting the programme were children with higher MUAC at admission (adjusted OR = 0·72; 95 % CI 0·59, 0·87), children belonging to non-scheduled caste/scheduled tribe groups (adjusted OR = 0·49; 95 % CI 0·41, 0·60) and children with uncomplicated SAM (adjusted OR = 0·60; 95 % CI 0·48, 0·74); those at higher risk of non-recovery were children with lower MUAC at admission (adjusted OR = 2·80; 95 % CI 2·30, 3·42), shorter length of stay (adjusted OR = 2·84; 95 % CI 2·19, 3·70) and younger children (adjusted OR = 1·46; 95 % CI 1·18, 1·81).
For the 2770 children who were discharged from the programme, the average weight gain while in the MTC – determined as the total individual weight gain (after loss of oedema in the case of children who had oedema at admission) of all the discharged children divided by 2770 – was 9·6 (sd 8·4) g/kg body weight per d (Table 3). For the 2770 children who were discharged from the programme, the average length of stay in the MTC – determined as the sum of the number of days in the MTC of all discharged children divided by 2770 – was 16·0 (sd 5·7) d (Table 3).
Table 3 Programme outcomes in children with severe acute malnutrition (SAM) discharged from malnutrition treatment centres in Jharkhand, India, 1 July 2009–30 June 2011
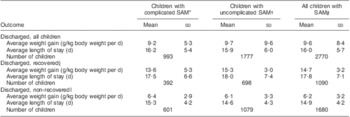
*SAM with oedema and/or medical complications.
†SAM without oedema or medical complications.
‡Children with complicated or uncomplicated SAM.
§Children with a weight gain ≥15 % of initial weight.
∥Children with a weight gain <15 % of initial weight.
Among the 2770 children who were discharged from the programme, 1090 (39·4 %) gained 15 % or more of their initial weight, with an average weight gain of 14·7 (sd 3·2) g/kg body weight per d and an average length of stay of 17·8 (sd 7·1) d; 1680 (60·6 %) of the 2770 discharged children gained less than 15 % of their initial weight; for these children, the average weight gain was 6·2 (sd 3·2) g/kg body weight per d and the average length of stay was 14·9 (sd 4·2) d (Table 3).
Among the 2770 children who were discharged from the programme, forty-seven children (1·7 %) did not gain weight, 549 children (19·8 %) had poor catch-up growth (<5 g/kg body weight per d), 1138 (41·1 %) had moderate catch-up growth (5–10 g/kg body weight per d) and 1036 children (37·4 %) had rapid catch up growth (≥10 g/kg body weight per d; data not presented).
Only 413 (14·9 %) of the 2770 discharged children came back for three follow-up visits after discharge, 212 (7·7 %) came back for two follow-up visits, 417 (15·1 %) came back for one follow-up visit and 1728 (62·4 %) did not come back for any follow-up visit; the proportion of discharged children who did not come back for any follow-up visit was similar among discharged recovered children (61·7 %; n 673) and among discharged non-recovered children (62·8 %; n 1055). A total of 433 children came back for the third follow-up visit; at discharge from the MTC, 146 (33·7 %) of these children had gained at least 15 % of their initial weight and thus were discharged recovered from the MTC; at follow-up visit 3 (i.e. 6 weeks after discharge), 263 children (60·7 %) had gained at least 15 % of their initial weight when they were admitted to the MTC (data not presented).
The programme performance indicators are presented in Table 4. Of the 3418 programme exits (deaths, defaulters and discharged), the proportion of exits who died was 0·6 %, the proportion of exits who defaulted was 18·4 %, the proportion of exits who were discharged recovered was 31·9 % and the proportion of children who were discharged non-recovered was 49·2 %.
Table 4 Programme performance indicators in malnutrition treatment centres in Jharkhand, India, 1 July 2009–30 June 2011
*SAM with oedema and/or medical complications.
†SAM without oedema or medical complications.
‡Children with complicated or uncomplicated SAM.
§Children with a weight gain ≥15 % of initial weight.
∥Children with a weight gain <15 % of initial weight.
Discussion
Between 1 July 2009 and 30 June 2011, a total of 3595 children with SAM were admitted to the forty-eight MTC run by the Department of Health and Family Welfare in the twenty-four districts of Jharkhand. The proportion of girls (55·0 %) was significantly higher than that of boys (45·0 %), suggesting that feeding and care practices in this population could discriminate against girls in infancy and early childhood although state-wide surveys indicate a similar prevalence of severe wasting among boys and girls( 4 ). Another two important features of the children admitted to the MTC was their social identity – 68·6 % were from scheduled tribes or scheduled castes – and their very young age – 77·7 % were in the age group 6–23 months. These three findings imply that in Jharkhand, programmes for the provision of care for children with SAM need to give priority attention to children under 2 years of age – particularly girls – from socio-economically disadvantaged groups.
The programme achieved survival outcomes (0·6 % child deaths) that compare favourably with national and international standards of care (<10 % child deaths)( 12 , 13 ). This is extremely important as the primary objective of MTC is to reduce fatality rates among children with SAM. Although not strictly part of programme performance monitoring, the outcomes of the children who are transferred to other facilities for medical reasons should be documented in future reporting.
It is important to note that almost two-thirds (65·6 %) of the 3595 children admitted had uncomplicated SAM; international guidelines recommend that children with uncomplicated SAM be cared for through a community-based programme for the management of SAM( 14 ) as these children – diagnosed before the development of medical complications – are at a significantly lower risk of death; in Jharkhand, death rates among children with uncomplicated SAM were three times lower than among children with complicated SAM.
The proportion of children who defaulted from the programme (18·4 %) was higher than the recommended standard of care (<15 %)( 12 , 13 ); however, the proportion of defaulters was significantly higher among children with uncomplicated SAM (21·1 %) than among children with complicated SAM (13·1 %), potentially because their families felt a lesser need to be in an MTC for an extended period as they did not perceive a life-threatening condition in their children. High defaulter rates have been reported in India by other facility-based interventions for children with SAM, where only one out of five children admitted stayed for the prescribed duration of treatment( Reference Mamidi, Kulkarni and Radhakrishna 15 ).
The proportion of children who reached the programme discharge criteria (81·0 %) compares favourably with national and international standards of care (>75 %)( 12 , 13 ); however, only 39·4 % of the discharged children gained 15 % or more of their initial weight, the minimum weight gain recommended globally by WHO to discharge children as recovered( 14 ).
This is an important finding; the average weight gain of the 2770 discharged children (9·6 (sd 8·4) g/kg body weight per d) compares favourably with the internationally agreed-upon minimum average weight gain (≥8 g/kg body weight per d) for programmes that treat children with SAM( 12 ). However, while the average weight gain of children who gained 15 % or more of their initial weight was above this threshold (14·7 (sd 3·2) g/kg body weight per d), that of children who gained less than 15 % of their initial weight was significantly below (6·2 (sd 3·2) g/kg body weight per d).
It is important to note that the average weight gain of the 2770 discharged children (9·6 (sd 8·4) g/kg body weight per d) is significantly higher than the mean weight gain achieved by therapeutic programmes in India that have used energy-dense local foods in hospital-based nutrition rehabilitation units (5 g/kg body weight per d) and so is the proportion of discharged children who achieved rapid catch-up growth (37·4 % v. 12 %)( Reference Mamidi, Kulkarni and Radhakrishna 15 ).
Conclusions
We can draw the following conclusions from the present analysis.
-
1. Facility-based therapeutic care for children with SAM through MTC is a key component of the continuum of care for children with SAM; MTC provide effective live-saving care for children with SAM and medical complications as demonstrated by the high survival rates of the programme. However, the data analysed here indicate that 60·6 % of the discharged children did not fully recover (weight gain <15 %) while in the MTC, primarily because their average daily weight gain was too low. Therefore the protocols and therapeutic foods currently used in the MTC need to be improved to include, among other things, the use of appropriate therapeutic foods (F-75 and F-100) with adequate amounts of all nutrients needed for optimal recovery (including vitamins and minerals), minimum average daily weight gain as a monitoring criterion and minimum weight gain as a discharge criterion.
-
2. Community-based therapeutic care for children with uncomplicated SAM needs to become a key component of the continuum of care for children with SAM. Two-thirds of the admitted children could have been treated in their communities as they had uncomplicated SAM; for these children, facility-based care in an MTC is dangerous because of the risk of cross-infection, has an important opportunity cost to the family and is expensive to the state. Also, global evidence shows that appropriate therapeutic foods for community-based management of SAM are as effective or more effective than F-100 in supporting rapid catch-up growth in children with SAM( Reference Diop El, Idohou Dossou and Ndour 16 ) and, importantly, can be safely used in community-based programmes( 14 ). Therefore admission criteria should be such that only children with medically complicated SAM are admitted to facility-based therapeutic care in the MTC (until complications disappear and weight gain starts), while children with uncomplicated SAM are admitted to community-based therapeutic care in their communities and homes.
-
3. Existing health systems need to be strengthened to provide effective care for children with SAM through an integrated model that comprises facility- and home-based therapeutic care with adequate referral between both programme components. Building on the existing system, MTC should become nutrition stabilization units for children with complicated SAM; once complications disappear and weight gain starts, these children and all children with uncomplicated SAM could be cared for in a community-based programme with appropriate therapeutic foods and feeding protocols. With an effective community-based programme for early detection and treatment, most children with SAM can be cared for by their mothers and families at home, while MTC or – nutrition rehabilitation centres, as they are referred to in other Indian states – are reserved for children with SAM and medical complications.
Acknowledgements
Sources of funding: Programme implementation was supported by the Government of Jharkhand, Department of Health and Family Welfare; funding for technical support and analysis was provided by UNICEF. Conflict of interest: There are no conflicts to declare. Authorship responsibilities: V.M.A. designed the study, conducted the analysis and wrote the manuscript; S.J., P.C., A.K. and K.S. guided programme implementation; N.B. and S.J. guided data collection and data cleaning; N.B. ensured data management; all authors made substantial conceptual contributions and revisions to the manuscript. The opinions expressed in this paper are those of the authors and do not necessarily represent an official position of the organizations with which they are affiliated.


