


A range of specific nutrients and foods have been suggested as important dietary determinants of obesity in childhood and adolescence, including but not limited to, fruit and vegetables( Reference Ledoux, Hingle and Baranowski 1 ), fibre( Reference Brauchla, Juan and Story 2 ), fat( Reference Pate, O'Neill and Liese 3 ), fast food( Reference Rosenheck 4 ) and sugary drinks( Reference Hu 5 ). However, with the exception of sugary drinks, where the evidence is increasingly clear( Reference Hu 5 ), the specific dietary risk factors for obesity in young people remain a matter of debate.
It is plausible that the overall dietary pattern may better explain obesity risk than individual nutrients or foods. Dietary patterns can summarise the combined and potentially synergistic effects of a repertoire of foods contributing to usual dietary intake in a defined population. Many food and nutrient intakes are strongly correlated or colinear, providing the basis for dietary patterns. This colinearity is partly due to the natural composition of the human diet, which has evolved over millennia by way of biology, ecology and culture. Moreover, where food is abundant, as in most western societies, dietary patterns may also be shaped by wider determinants, such as food environments( Reference Story, Kaphingst and Robinson-O'Brien 6 ) and psychology, e.g. social norms( Reference Lally, Bartle and Wardle 7 ) and hedonic hunger( Reference Lowe and Butryn 8 ). While epidemiologists may wish to separate the effects of individual exposures, e.g. foods and nutrients, the correlated nature of dietary variables can make this difficult. However, given the complexity of human diets, a focus on only one food or nutrient while not considering others may be questionable. This is where empirical dietary patterns can assist, as they make use of the correlated nature of dietary data to identify patterns in total food consumption, offering a viable counterpoint to the reductionist approach. In addition, the food-based information provided by dietary patterns may be easier to translate into guidelines for the public. For example, they can be interpreted in the context of substituting foods positively associated with a dietary pattern linked to greater disease risk, with foods that are negatively associated with that pattern and thus, risk. Therefore, dietary patterns may be a useful approach when considering dietary risk factors for obesity.
The purpose of the present paper was to systematically review and summarise the current evidence on empirical dietary patterns in childhood and later obesity risk.
Identification and review of evidence
Empirical dietary patterns
This review focused on studies that utilised empirical methods to identify patterns in total food intake. Studies employing diet indices or diet quality scores, e.g. Healthy Eating Index( Reference Guenther, Casavale and Reedy 9 ) were not included, as diet indices are not empirically derived and they usually focus on selected foods or nutrients rather than the total diet. Diet indices require many arbitrary decisions regarding cut-offs for scoring, weighting item contributions to the total score, and the scaling of scores. Some, for example, the Mediterranean diet score( Reference Panagiotakos, Pitsavos and Stefanadis 10 ), are strongly culturally influenced and may not be applicable in different populations.
To date, the most popular empirical dietary pattern methods have included principal components analysis (PCA), factor analysis (FA) and cluster analysis (CA). In brief, these are a posteriori data reduction techniques that identify underlying constructs or patterns in food intake. PCA and FA produce a number of dietary patterns, each consisting of a set of factor loadings (one for each food) that characterises a particular food and nutrient profile at the population level( 11 , 12 ). Individuals are then given a z-score quantifying the degree to which their reported dietary intake reflects the identified dietary patterns, relative to others in the same study population. These z-scores can be used as predictor variables to model disease risk. CA is a less frequently applied dietary pattern method that attempts to classify individuals into mutually exclusive groups or clusters with similar food intakes( Reference Devlin, McNulty and Nugent 13 ). Unlike PCA and FA, CA does not produce continuous dietary pattern z-scores but rather, individuals are assigned membership to one of the identified clusters, which precludes examination of dose–response relationships.
PCA, FA and CA aim to explain the maximum variation in food intakes, but they do not necessarily explain the maximum variation in nutrient intakes relevant to the health outcome of interest( Reference Hoffmann, Schulze and Schienkiewitz 14 ). It is after all nutrients, the product of food intake, that interact at the mechanistic level to influence disease risk. Furthermore, these methods are entirely exploratory, and their dependence on the data covariance can limit their reproducibility.
Reduced rank regression (RRR) is both an a priori and a posteriori empirical method( Reference Hoffmann, Schulze and Schienkiewitz 14 ). RRR can be used to identify combinations of food intake, or dietary patterns, that explain the maximum variation in a predefined set of intermediate (or response) variables. These intermediate variables are hypothesised to be on the causal pathway between food intake and a specific health outcome of interest. The intermediate variables may be nutrient intakes or biomarkers, but should be susceptible to food intake and not be proxies for the outcome. Similar to PCA and FA, RRR dietary patterns are characterised by a set of factor loadings at the population level, and individuals are scored for the dietary patterns using a z-score. By including a priori information in the form of intermediate variables, RRR can be a powerful method for examining specific diet–disease pathways that builds on prior knowledge. The incorporation of a priori information in RRR dietary patterns may also make them better at predicting disease risk than dietary patterns identified using exploratory methods such as PCA and FA( Reference Hoffmann, Schulze and Schienkiewitz 14 , Reference Hoffmann, Boeing and Boffetta 15 ).
Identifying the literature
Studies eligible for this review were (i) of prospective design, (ii) employed an empirical method (i.e. PCA, FA or RRR) to identify dietary patterns in childhood or adolescence, and (iii) reported associations between these dietary patterns and a prospectively measured obesity-related outcome. Eligible studies were identified in the literature published between 1970 and June 2013 using electronic searches of PubMed and Web of Science (English language only) and the following search terms: dietary patterns; PCA; FA; RRR; children; adolescents; obesity; BMI; overweight; weight. Reference lists in eligible articles and relevant reviews( Reference Smithers, Golley and Brazionis 16 , Reference Togo, Osler and Sorensen 17 ) were also hand searched. Studies on growth confined to infancy were excluded. Studies using CA were excluded because their dichotomous scores were not considered comparable with continuous dietary pattern z-scores produced by PCA, FA and RRR.
Study quality
At present, there is no universally accepted tool for scoring the methodological quality of observational studies( Reference Sanderson, Tatt and Higgins 18 ). In this review, a scoring tool applied by te Velde et al.( Reference te Velde, van Nassau and Uijtdewilligen 19 ) (in a review of dietary and physical activity behaviours and obesity in preschool children) was used to assess the methodological quality of each eligible study. The tool assessed study quality according to information, validity and precision related to: (i) study population and participation, (ii) study attrition, (iii) data collection methods and (iv) data analysis methods (Table 1). The scoring tool consisted of twelve criteria. Each could be assigned one of three possible scores: a positive score (+) if the study met the quality criterion, a negative score (−) if it did not meet the quality criterion, and a ‘?’ if a decision was not possible because insufficient information was provided. Citations to earlier papers were searched if information relevant to the criteria could not be found in the primary paper. A total quality score for each study was based on the number of positive scores for criteria reflecting validity or precision( Reference te Velde, van Nassau and Uijtdewilligen 19 ) (Table 1). Data from each study were extracted into a summary table and scored for methodological quality by two independent reviewers (G. L. Ambrosini and D. Johns).
Table 1. Criteria for assessing methodological quality of studies (adapted from( Reference te Velde, van Nassau and Uijtdewilligen 19 ))

Criteria related to: I, information; V, validity; P, precision.
a Sufficient to enable study replication.
Summarising the evidence
Meta-analysis can be used to combine statistical evidence from more than one study to estimate a pooled effect. However, this requires a sufficient number of comparable studies with a common outcome and exposure measurement, and limited between-study heterogeneity. Where appropriate, a meta-analysis was undertaken using a random effect model in STATA( 20 ) to combine the log-transformed results of eligible studies( Reference Egger, Smith and Phillips 21 ). The estimate of heterogeneity was used to gauge the appropriateness of combining studies for a pooled effect.
As the number of eligible studies was not expected to be large, a harvest plot was also employed to summarise the evidence. Harvest plots are an alternative to meta-analyses when large heterogeneity between studies precludes their statistical combination( Reference Ogilvie, Fayter and Petticrew 22 ). A harvest plot was created by plotting each eligible study according to its quality score and grouping studies by size and finding (null, negative or positive)( Reference Ogilvie, Fayter and Petticrew 22 ).
Results of literature review
Eligible studies
The literature searches identified 166 papers. Of these, nine papers met the eligibility criteria, including two that analysed the same cohort at different follow-up ages( Reference Johnson, Mander and Jones 23 , Reference Ambrosini, Emmett and Northstone 24 ) and one study published as a conference abstract( Reference Ambrosini, Mori and Appannah 25 ). The most common reason for exclusion at the screening stage was cross-sectional study design. After full screening, two of the nine eligible papers were deemed invalid and excluded for issues we have previously raised regarding the use of RRR( Reference Ambrosini, Johns and Jebb 26 ). At the end of the screening process, seven papers were eligible for review (Fig. 1).

Fig. 1. (colour online). Flow diagram of the study identification process. RRR, reduced rank regression.
The seven eligible studies were conducted in the UK( Reference Johnson, Mander and Jones 23 , Reference Ambrosini, Emmett and Northstone 24 ), USA( Reference Cutler, Flood and Hannan 27 ), Australia( Reference Ambrosini, Mori and Appannah 25 ), Norway( Reference Oellingrath, Svendsen and Brantstaeter 28 ), Finland( Reference Mikkilä, Räsänen and Raitakari 29 ) and Colombia( Reference Shroff, Perng and Baylin 30 ) (Table 2). The median duration of follow up was 4·5 years. Follow-up ages ranged from 3 to 39 years, however, most studies included follow up until the mid-to-late teenage years. With the exception of two studies, sample sizes approximated 1000 or more subjects. All studies included appropriate adjustments for confounders, including age, gender, physical activity, socioeconomic status and maternal education. Two studies adjusted for total energy intake( Reference Mikkilä, Räsänen and Raitakari 29 , Reference Shroff, Perng and Baylin 30 ).
Table 2. Studies of common empirical dietary patterns* in childhood or adolescence and later obesity risk
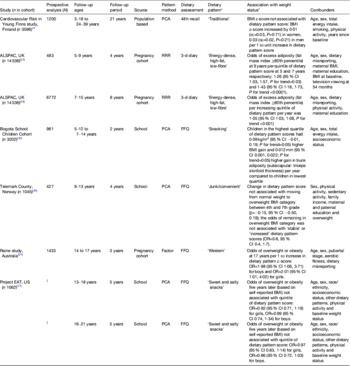
PCA, principal components analysis; RRR, reduced rank regression; ALSPAC, Avon Longitudinal Study of Parents and Children; Project EAT, Project Eating Among Teens.
* Dietary pattern characterised by high intakes of energy-dense, high-fat and low-fibre foods.
† Reported associations between dietary pattern and prospective measure of weight status.
‡ A total of 2516 were included from both age groups but the number in each age group was not reported.
Five studies applied PCA or FA and two applied RRR to identify dietary patterns. A comparable dietary pattern was identified in all the seven studies that consisted of a high consumption of energy-dense, high-fat and low-fibre foods. These were labelled ‘snacking’, ‘junk/convenient’, ‘sweet and salty snack foods’ ‘western’, ‘traditional’ and ‘energy-dense, high-fat, low-fibre’ (Table 3). All of these patterns were characterised by high intakes of confectionery and chocolate. High intakes of refined grains (low-fibre bread and breakfast cereals, rice and pasta), cakes and biscuits, savoury snacks and crisps, and processed meat (sausages, bacon, ham, salami, frankfurter/hot dogs) featured in most (83 %) of the patterns. High intakes of sugar-sweetened beverages, full fat milk, fried potato (chips), fats and oils, and takeaway foods (burgers, pizza, kebabs, fried/crumbed chicken or fish) featured in at least half of the patterns. Five of the seven studies reported that these dietary patterns had either negative factor loadings or were associated with lower intakes of fruit, vegetables and fibre (indicated by fibre, wholegrain, high-fibre breakfast cereal or high-fibre bread intake) and higher intakes of total fat and saturated fat( Reference Johnson, Mander and Jones 23 , Reference Ambrosini, Emmett and Northstone 24 , Reference Cutler, Flood and Hannan 27 , Reference Mikkilä, Räsänen and Raitakari 29 , Reference Ambrosini, Oddy and Robinson 31 ). In the remaining two studies( Reference Oellingrath, Svendsen and Brantstaeter 28 , Reference Shroff, Perng and Baylin 30 ) it was not possible to determine the foods or nutrients negatively associated with their dietary pattern, because neither negative factor loadings nor nutrient profiles were reported( Reference Oellingrath, Svendsen and Brantsaeter 32 , Reference Isanaka, Mora-Plazas and Lopez-Arana 33 ).
Table 3. Mapping of common dietary patterns and their key components

ALSPAC, Avon Longitudinal Study of Parents and Children (UK); Bogota, Bogota School Children Cohort (Colombia); Project EAT, Project Eating Among Teens (USA); Raine, Western Australian Pregnancy (Raine) Cohort (Australia); Telemark, Telemark County (Norway); Young Finns, Cardiovascular Risk in Young Finns Study (Finland). +, indicates that the food group/nutrient had a positive factor loading or a positive association with the dietary pattern; −, indicates either a negative factor loading or a negative association with the dietary pattern.
* Both ALSPAC papers identified the same dietary pattern( Reference Johnson, Mander and Jones 23 , Reference Ambrosini, Emmett and Northstone 24 ).
† Sausages, bacon, ham, salami, frankfurter/hot dogs.
‡ Low-fibre breakfast cereals and bread, rice, pasta.
§ Burgers, pizza, kebabs, fried/crumbed chicken or fish.
Quality of eligible studies
There was 93 % agreement between the two reviewers and differences in study quality scores were discussed to reach a consensus. The final study quality scores ranged from 43 to 71 % (Supplementary Table 1). The quality criteria met least often related to participation rates and selective attrition. All studies scored negatively for achieving a participation rate at baseline (beginning of analysed follow up) of at least 80 % of the original cohort. Only two studies reported investigating selective attrition during follow up( Reference Johnson, Mander and Jones 23 , Reference Cutler, Flood and Hannan 34 ) and three studies did not achieve at least 70 % follow up of the baseline sample 12 months later( Reference Johnson, Mander and Jones 23 , Reference Cutler, Flood and Hannan 27 , Reference Oellingrath, Svendsen and Brantstaeter 28 ). Other factors impacting study quality included reliance on a very small number of overweight or obese children( Reference Oellingrath, Svendsen and Brantstaeter 28 ) and the use of self-reported height and weight( Reference Cutler, Flood and Hannan 27 ).
Summary of evidence relating to childhood empirical dietary patterns and later obesity
Various obesity-related outcome measures were reported in the seven eligible studies (Table 2). One study analysed dietary pattern z-score as the outcome( Reference Oellingrath, Svendsen and Brantstaeter 28 ). Only three studies: Avon Longitudinal Study of Parents and Children (UK)( Reference Ambrosini, Emmett and Northstone 24 ); Western Australian Pregnancy (Raine) Cohort (Australia)( Reference Ambrosini, Mori and Appannah 25 ); Project Eating Among Teens (USA)( Reference Cutler, Flood and Hannan 27 ) had a comparable outcome measurement (OR) and dietary pattern measure (continuous z-score) suitable for meta-analysis. Of these, Project Eating Among Teens( Reference Cutler, Flood and Hannan 27 ) reported OR for four age- and gender-specific subgroups. Therefore, a meta-analysis combining the six OR from these three studies was undertaken. This produced a large estimate of between-study heterogeneity (78 %, P<0·0001), indicating that statistically combining these studies was inappropriate, and any estimated pooled effect misleading. There were an insufficient number of studies to conduct meta-analyses on other outcomes.
The harvest plot in Fig. 2 summarises the findings from all seven eligible studies. It can be seen that all four studies reporting a positive association between the dietary pattern and later obesity were of consistently higher quality than studies reporting null findings. No studies reported inverse associations between the dietary pattern and later obesity. The balance of evidence therefore supported a positive relationship between dietary patterns consisting of energy-dense, high-fat, low-fibre foods in childhood or adolescence and later obesity risk.

Fig. 2. Harvest plot summarising prospective studies examining a dietary pattern in childhood or adolescence characterised by high intakes of energy-dense, high-fat, low-fibre foods and later obesity risk. ALSPAC, Avon Longitudinal Study of Parents and Children (UK); Bogota, Bogota School Children Cohort (Colombia); Project EAT, Project Eating Among Teens (USA); Raine, Western Australian Pregnancy (Raine) Cohort (Australia); Telemark, Telemark County (Norway); Young Finns, Cardiovascular Risk in Young Finns Study (Finland).
Discussion
Summary of findings
This systematic review has identified support for a positive relationship between empirically derived dietary patterns in childhood or adolescence that are high in energy-dense, high-fat, low-fibre foods and later obesity risk. Another review recently concluded that energy-dense diets( Reference Perez-Escamilla, Obbagy and Altman 35 ) are a risk factor for obesity in children, but there is less evidence specifically for dietary fibre( Reference Brauchla, Juan and Story 2 ) and dietary fat( Reference Pate, O'Neill and Liese 3 ). These results of the present review therefore provide evidence that these correlated dietary factors may be important for childhood obesity when considered together in an overall dietary pattern, rather than as separate entities.
This review's conclusion is based on findings from high-quality studies; however, it has highlighted several limitations in the existing literature. Most clearly, there is a paucity of prospective studies on dietary patterns and obesity risk in young people. There is a predominance of cross-sectional studies, but these cannot reliably inform causation, or more specifically, the temporal sequence between dietary intake and obesity development. Once overweight or obese, individuals may change their dietary intake in an effort to combat further weight gain or encourage weight loss. As a result, associations reported in cross-sectional studies may reflect reverse causation and confuse our understanding of the true aetiological relationships.
Challenges combining the evidence
It is not possible to statistically combine the results of prospective studies published to date on empirical dietary patterns and obesity risk in young people. The initial obstacle was the reporting of different outcome measures. In the Telemark County (Norway)( Reference Oellingrath, Svendsen and Brantstaeter 28 ) and Western Australian Pregnancy (Raine) Cohort( Reference Ambrosini, Mori and Appannah 25 ) studies, overweight or obesity was defined using International Obesity Task Force( Reference Cole, Bellizzi and Flegal 36 ) cut offs for BMI. In Project Eating Among Teens( Reference Cutler, Flood and Hannan 27 ), overweight or obesity was defined as having a BMI ≥85th percentile using US reference data( Reference Must, Dallal and Dietz 37 ). In both Avon Longitudinal Study of Parents and Children analyses( Reference Johnson, Mander and Jones 23 , Reference Ambrosini, Emmett and Northstone 24 ) excess adiposity was the outcome and was defined as those subjects who were above the 80th percentile for fat mass index, a cut-off that also identified overweight or obese individuals according to their BMI in this cohort( Reference Johnson, Mander and Jones 23 ). Other studies reported BMI( Reference Shroff, Perng and Baylin 30 ), BMI z-score( Reference Mikkilä, Räsänen and Raitakari 29 ) or trunk adiposity( Reference Shroff, Perng and Baylin 30 ) as outcomes. Greater consistency in the reporting of outcome measures would enable more study comparisons.
Even among studies reporting similar outcome measures there was considerable heterogeneity, suggesting other contributors to between-study differences. Several factors are likely, but the differences in empirical dietary pattern methods are notable. The majority of studies used exploratory dietary pattern methods (PCA, FA) and although the key foods featuring in the observed dietary patterns were highly comparable, exploratory dietary patterns may lack specificity, limiting their comparability. On the other hand, RRR characterises more specific dietary patterns based on a set of predefined intermediate variables, and this specificity could increase their reproducibility. Another source of variation is the differences in number (ranging from 23( Reference Mikkilä, Räsänen and Raitakari 29 ) to 152( Reference Cutler, Flood and Hannan 27 )) and type of food groups included in each dietary pattern analysis. This will impact the observed dietary patterns, their factor loadings and scores. Most studies used either a FFQ or a 3-d diet diary; one used a 48 h dietary recall and this may be less representative of usual dietary intake in young people, who show greater day-to-day variation in dietary intake than adults( Reference Livingstone, Robson and Wallace 38 ). The sources of error in these dietary assessment methods may also vary. These differences may have influenced the dietary patterns observed in each study.
Childhood and adolescence includes periods of rapid growth and development, with accompanying changes in autonomy. The risk factors for obesity are multifactorial and the most influential risk factors may change with age. For example, in the Avon Longitudinal Study of Parents and Children, the association between an energy-dense, high-fat, low-fibre dietary pattern and adiposity diminished between 7 and 15 years of age( Reference Ambrosini, Emmett and Northstone 24 ). Although the majority of studies identified in this review focused on teenage years, there were some variations in follow-up ages. Additional data will allow a more precise consideration of the potential changing nature of dietary patterns during childhood and adolescence.
Methodological issues
There were considerable differences in study quality. All studies failed to follow up >80 % of their original cohort, and most of the studies did not report on possible selective cohort attrition. Although dietary assessments are sometimes limited to cohort subsets for reasons beyond researchers’ control, e.g. limited resources, investigations into selectiveness and attrition are to be encouraged. The differences between studies identified in this review present a challenge to orthodox meta-analysis. However, using harvest plots it has been possible to gain an overview across all eligible studies, reducing the risk of selection bias.
Other methodological issues not assessed by the quality scoring tool are worth noting. Dietary misreporting, particularly under-reporting, can obscure observed diet–disease relationships( Reference Rennie, Coward and Jebb 39 ). This is especially relevant in obesity research, as dietary under-reporting is strongly associated with overweight and obesity( Reference Livingstone, Robson and Wallace 38 ) and may be related to reported dietary intake, as particular foods may be more susceptible to under-reporting( Reference Scagliusi, Ferriolli and Pfrimer 40 ). Furthermore, dietary under-reporting is common among older children and adolescents( Reference Livingstone, Robson and Wallace 38 ). All the three studies that attempted to control for dietary under-reporting observed positive associations between their dietary patterns and later obesity. Another debated issue in nutrition epidemiology is adjustment for total energy intake. Two studies included in this review adjusted for total energy intake in their analysis( Reference Mikkilä, Räsänen and Raitakari 29 , Reference Shroff, Perng and Baylin 30 ). However, it can be argued that this is an over adjustment that may lead to under-estimating the true association, because total energy intake is assumed to be on the causal pathway to obesity.
The identified dietary patterns were not always well described. For example, many studies reported only those factor loadings outside an arbitrary (and variable) cut-off. One study did not report factor loadings for all dietary patterns (these were requested from the author)( Reference Shroff, Perng and Baylin 30 ). Many studies did not describe the nutrient profiles of their dietary patterns or the amount of variation explained by their patterns. Better reporting of empirical dietary patterns is needed to support comparison and replication, and to improve our understanding of dietary patterns and health outcomes.
Conclusions
The balance of evidence from this systematic review is that empirical dietary patterns that are high in energy-dense, high-fat and low-fibre foods predispose young people to later overweight and obesity. This review also demonstrates that examining multiple dietary factors as a dietary pattern may better explain obesity risk than individual nutrients or foods. However, more work is required to clarify these relationships. To assist in developing and focusing obesity intervention efforts, more well-designed prospective studies are greatly needed. Research on empirical dietary patterns would benefit from a more focused approach and hypothesis-driven methods such as RRR may assist in clarifying potential pathways and minimise confusing public health messages. Such focus and more consistent reporting would also facilitate greater replication, i.e. the testing of similar dietary patterns in various study populations, to confirm associations and their generalisability.
Acknowledgements
The author wishes to thank Dr David Johns from MRC Human Nutrition Research, Cambridge, as the second reviewer assessing the methodological quality of studies for this review and Dr Susan Jebb (MRC Human Nutrition Research, Cambridge) for giving advice on the manuscript.
Financial support
The present paper was funded by a programme grant from the Medical Research Council (grant no. U105960389) and was presented as an invited oral presentation for the Nutrition Society Irish Section Summer Meeting, ‘Childhood Nutrition and Obesity: current status and future challenges’ in Dublin, June 2013.
Conflicts of interest
None.
Authorship
G.L.A. designed this review, conducted literature searches and data analyses, and wrote the paper.
Supplementary material
To view supplementary material for this article, please visit http://dx.doi.org/10.1017/S0029665113003765.


